info@biomedres.us
+1 (502) 904-2126
One Westbrook Corporate Center, Suite 300, Westchester, IL 60154, USA
Site Map
 ISSN: 2574 -1241
ISSN: 2574 -1241
ISSN: 2574 -1241
Received: July 07, 2025; Published: July 31, 2025
*Corresponding author: Töysä T, Licentiate of Medicine, Specialty General Practice, Retired, Student of Eastern Finland, Kuopio, Finland
DOI: 10.26717/BJSTR.2025.62.009800
Clinical Mg deficiency (grass tetany) and low S-Mg can be caused by deficiency of easily digestible carbohydrates,
which are needed for proper digestion of long carbohydrate molecules and protein synthesis in rumen. In energy
deficiency microbes begin to produce ammonia (NH3 – NH4OH), which elevates the pH of rumen. Elevated pH
and NH4 promote formation of (in basic solution insoluble) magnesium ammonium phosphate, struvite.
Struvite can explain a part of the Mg precipitation to non-extractable form after liming. Struvite formation has
been used in wastewater processing for Mg, N and P capture. It is more useful for phosphor fertilization than P
precipitated by iron (oxides).
Possibly biological struvite dissolution could partially explain the increase of P and Mg content in agricultural
soil after reduced P and Mg fertilization. In soil soluble P content (determined by acid ammonium acetate) is
generally associated with increasing pH, seemingly opposite to rumen.
Conclusions: Struvite can partly explain the slow soil P and Mg responses to fertilization. pH regulation of soil
includes open questions.
Clinical Mg deficiency (grass tetany) and low S-Mg can be caused by deficiency of easily digestible carbohydrates, which are needed for proper digestion of long carbohydrate molecules and protein synthesis in rumen. In energy deficiency microbes begin to produce ammonia (NH3 – NH4OH), which elevates the pH of rumen. Elevated pH and NH4 promote formation of magnesium ammonium phosphate, Simesen 1959 in [1]. Magnesium ammonium phosphate (colorless, acid soluble, but in water insoluble) struvite [2] can explain a part of the Mg precipitation to non-extractable form after liming [3,4]. Struvite formation has been used in wastewater processing for Mg, N and P capture. It is more useful for phosphor fertilization than P precipitated by iron (oxides) [5].
Data on phosphor in fertilizers and yields from 1946-75 are attained by ruler from the graphics of Sillanpää [6] (Fig 1 represents P output in yields, P input (sum of mineral fertilizers and recycled P fertilizers (manure) from Sillanpää [6], as well as “P.input.Sill.&. FAO.61-“ (where P mineral fertilizers from 1961-75 are replaced by data from FAOSTAT [7]. FAOSTAT [7] shows inputs of only P mineral fertilizers). Approximate P supply from manure in 1945-75 was ca 5.5 kg/ha (with decreasing trend: 6 kg in 1945-60 and 5 kg/ha in 1961- 75 [6], roughly about a half of P output in 1950–75. In 1973-75 maximal total P supply was ca 40 kg/ha.
Approximates of soil Mg supply have been calculated by amounts of liming agents and their Mg-%’s added by Mg-supplements from non-limes as given for 1957-90 in [8], which includes some additional data including interpolationsAll magnesium supplements, except manure, are categorized as fertilizers. Finnish lime consumption in in 1951–90 is from Nordkalk, Lauronen, who gave approximates of their Mg percents [9]: 2% before 1971, in 1972-80 increasingly ad 7%, in the 1980’s 7 %, 6 % during the 1990’s and 5% after that. Amounts of limes for 1951-90 are divided by the number of hectares, from Statistics Finland for 1951-60 [10] and FAOSTAT for 1961–90 [11]. Limes for 1991-2013 are from [12] given by kg/ha. Mg fertilizers for 1956-57 are from [13], values for 1951-55 are approximated by relative number to respective mineral P fertilizers [6]. Mg amounts from non-limes before 1990 are presented in [8], including estimations. Data since 1983 are provided by Statistical Yearbook of Finland [14]. The mean value of magnesium supplements from non-lime sources during 2007–2009 (2.31 kg/ha) is used as an estimate for the years 2010–2013. Atmospheric depositions for Mg supply were not included, supposing that more Mg is deposited from fields to forests and lakes than on the contrary. Soluble (exchangeable) soil values are from Eurofins Viljavuuspalvelu Oy [15]. Analyses are performed by acid ammonium acetate, pH 4.65 (since 1952) [16].
Figure 1
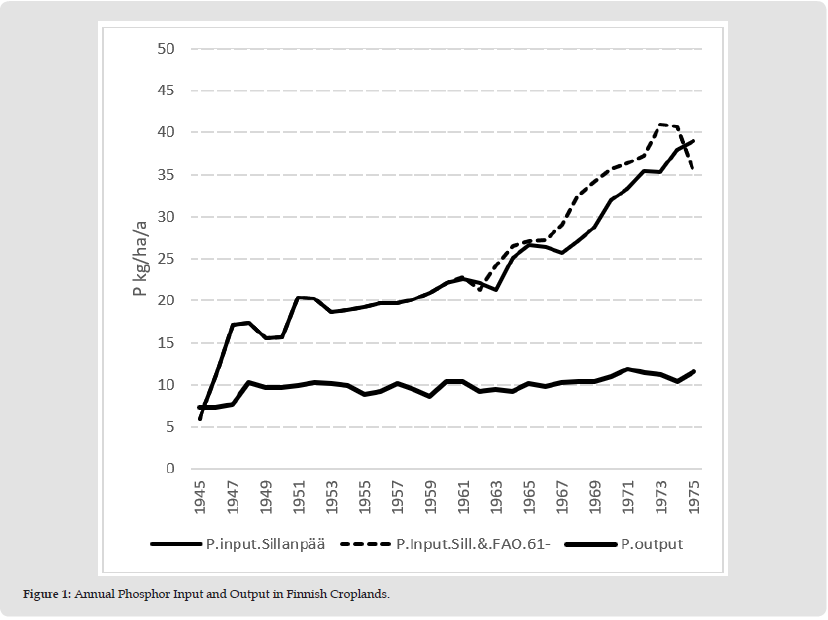
Figure 2 shows mineral P fertilizer rates in 1951-2015 by 5-year means (1951-60 are from Sillanpää [6], 1961–2015 from FAOSTAT [7]). Mineral P fertilizer use has declined since 1973 [7,13], but soil soluble P [12] increased until 1998 before dropping. Soil values mg/l, resp kg/106 dm3, i.e. 10 cm layer of a hectare. By multiplying the given values (mg/l) by 2.5 gives (acid acetic acid) soluble P content in 25 cm (plough) layer. Still 2018 soil Mg content was above the level of 1973. In 1983 mineral Mg rates (35 kg – 2847 Eq/ha) achieved the decling level of P (29 kg – 2816 Eq P/ha]. Equivalent weights of P (10.5) and Mg (12.15) are similar. Mg supplementation was reduced starting in 1988, but by 2013, soil Mg content remained higher than in 1988 and did not show a decline. similar to P. Fertilization and soil data on magnesium suggest that the need for annual mineral Mg supplementation is below 13 kg/ha.
Figure 2
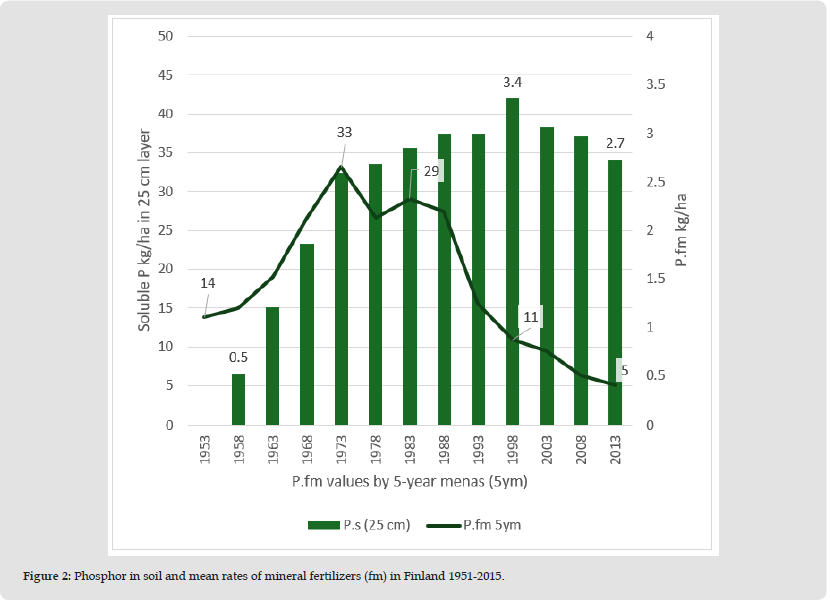
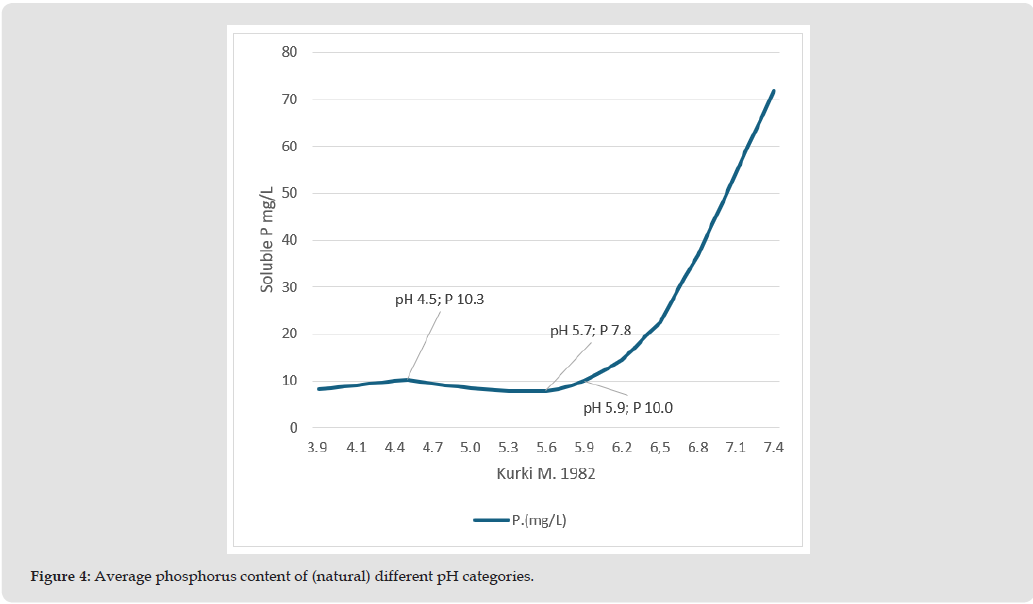
Mean annual output of phosphorus in 1946-59 was 9.4, in 1960- 69 10.0 and in 1970-75 11.3 kg/ha in yields (Figure 1). P analyses of soil and mineral fertilization data (Figure 2) suggest that in 1946-98 accumulated soil reserves of P began to get liberated after 1998, 25 years after reduction of P fertilization (Figure 2) and the reduction of soluble P seems to continue. The average yield-based output of P for 2011–2015 (2013 5ym) was about double that of 1962 [13] due to higher yields, but stayed below 20 kg/ha, as reduced P applications supposedly led to lower P concentrations at harvest. Improvement of P recycling from manure (which had been ca 5 kg in the 1960’s) and via struvite method [5] from wastewaters can help to replace the P losses. (Figures 3 & 4) It seems possible that the reduction of fertilizers [13] has increased biological activity of soils, have obviously promoted dissolution of struvite and other minerals, which have replaced the reduced fertilizers.
Figure 3
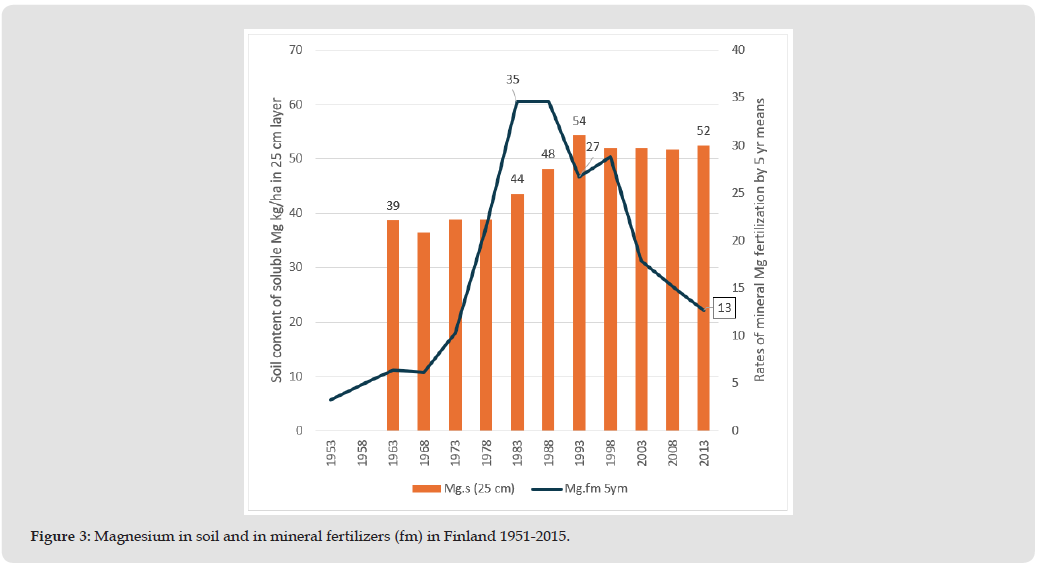
Figure 4
Liming and P Liberation
The biological processes, which liberate soil minerals and elevate pH are obviously not as simple as suggested by Figure 5 [14]. The experiments with lime [3,4] show that a part of P becomes non-extractable (non-available to plants): increase of pH does not always increase soil soluble P. In usual fertilization trials (in acid ammonium acetate) [15] soluble P predicted well plant P deficiency and boarders between P fertilized and non-fertilized were clear in the 1960’s [16]. The discrepancy is possibly in the future to be dissolved by the multiple molecules of silicon [17,18].
Figure 5
Some Special Causes of Mg Deficiency
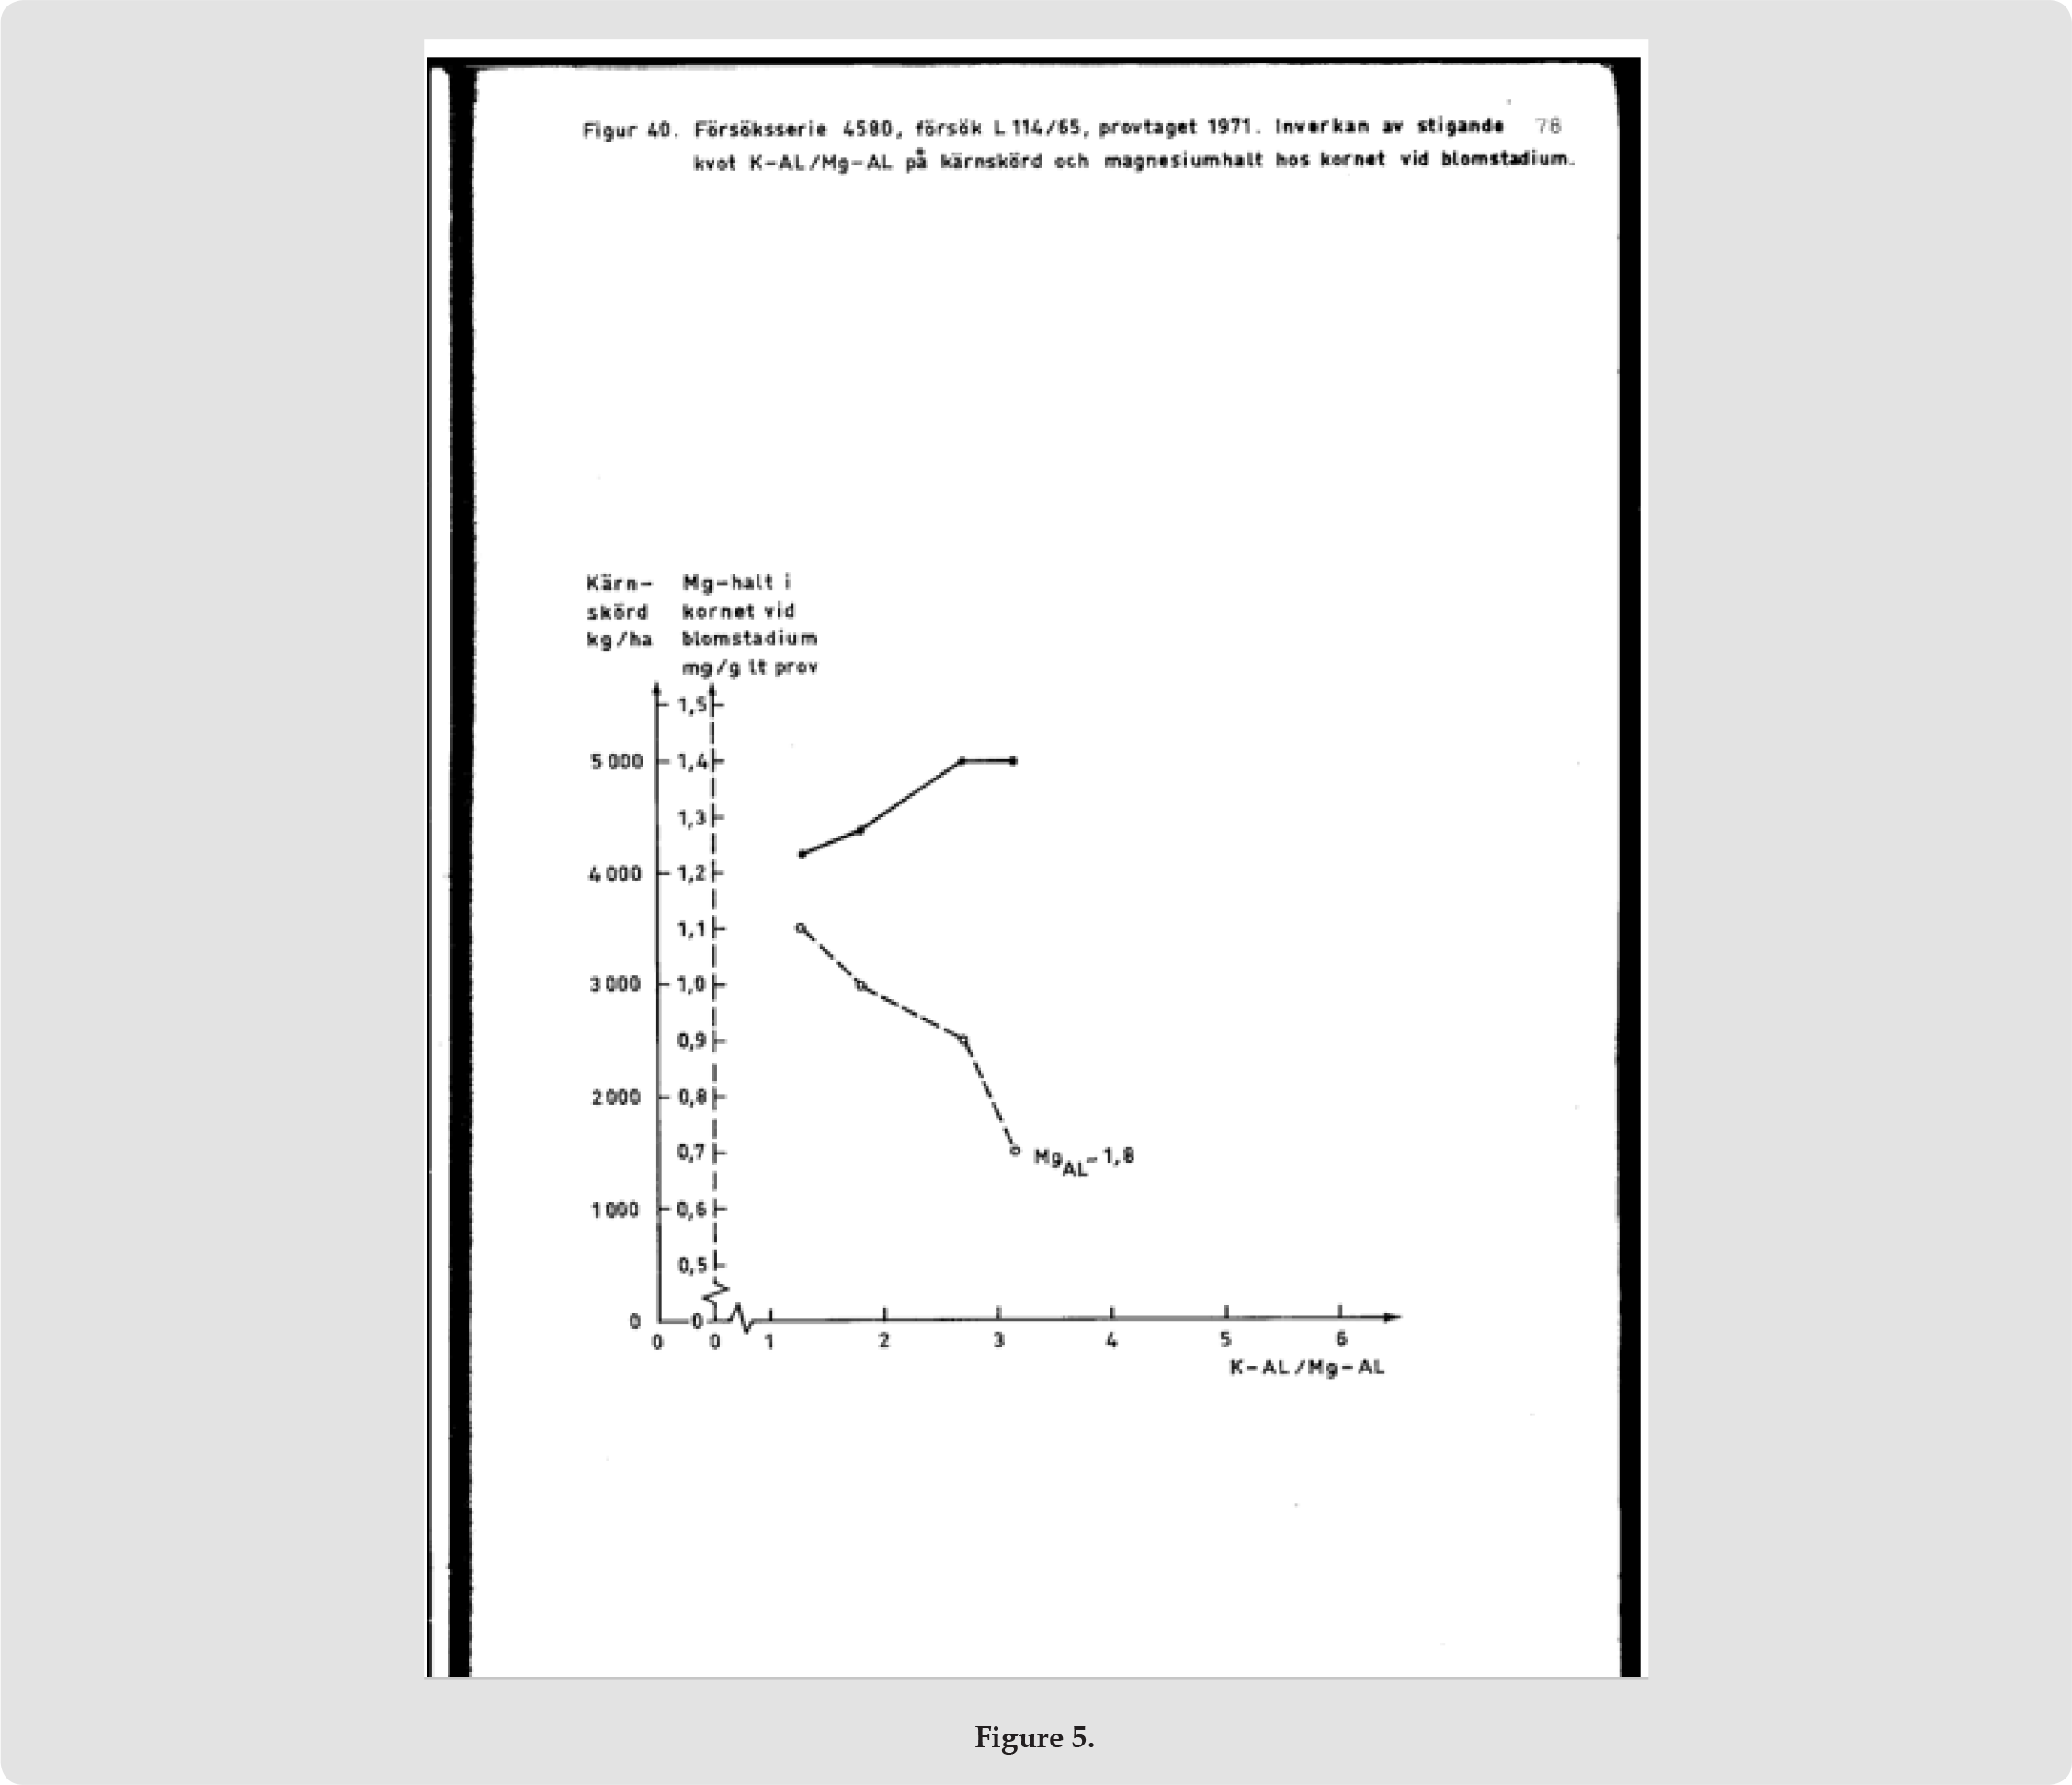
Historically Mg deficiency of soil has been difficult to notice (or it was non-noticeable) in monocots by using amounts of yields (or the effect of Mg supplements on yields) as a measure of Mg deficiency. If in the soil there are disproportionally abundantly K, this can displace Ca and especially Mg so effectively that K content in the plant increases over 3-fold to its requirement, associated with respective decrease of Ca and Mg [19]. In barley trials, Jerlström observed that by barley the lowest soil Mg/K ratio corresponded with the highest yields [20] (Figure 5). Figure 5 shows that increase in soil K/Mg ratio (“K-AL/ Mg-AL”) (determined by ammonium lactate method, pH 3.75 [21]) ad extremely high level, increased grain yield of barley and decreased Mg content of (barley at flowering stage). Even Jokinen has written about this discovery [4] in English (on p. 258). Barley was been identified as the Finnish cereal with the lowest impact from magnesium deficiency [22]. Optimal metabolic function and efficient symbiotic nitrogen fixation demand higher magnesium levels than those required simply for preventing visible magnesium deficiency (such as chlorosis) or for adequate chlorophyll synthesis [23]. Chlorophyll contains only a few percents of the plant Mg [23]. ““The only possible way of clearly increasing the magnesium content of the (grass) yields appears to be the cultivation of mixed clover-grass leys”, wrote Jokinen [4] on p. 261. Fodder K/(Ca+Mg) predicted grass tetany risk [24] Although NO3 increases fodder Mg content, it can decrease S-Mg, if fodder (crude) protein is too high [25-27].
This can be explained by struvite fotmatioin.In 1958 wrote agricultural adviser and farmer about successful experiments with magnesium for clover thriving (and on history of high rates of P fertilizers). Four natural factors regulate soil pH: Temperature, groundwater Si content (weatherability of local minerals) and humus content [15+1] and additionally ditching [21+1], which has been underestimated in historical surveys. The biological processes for managing soil pH [15+1] seem to need more attention.
Struvite partly accounts for slow soil P and Mg responses to fertilization, but has less impact on N-balance. Biological factors and silicon need attention in pH regulation.
To Professor Hänninen and Veterinary surgeon of Seppo Haaranen for several discussions.


 Abstract
 PDF
PDF