 Research Article
Abstract
Silicate weathering is known to bind carbon. This study assesses associations between mineral soil humus content (1960-70) [Hum(us).min(.60’s)] (indicator of soil organic carbon – SOC), groundwater silicon [Si.gw], mineral (“.min”) soil parameters from 1966-70 (“68”) and 1986-90 (“88”): pH, (Ca+Mg+K), proportion of clays in fine mineral soils [Prp.(clays/fims], temperature [Temp] from 1961-90 (“(61-90)”) and 1981-2010 (“(81-10)”) by Rural Centers (RC) (N = 18).
Results: Next are represented results of combined regressions, e.g. the first one shows that combined regression of [Hum.min] was explained 79.6 % by [pH. min.68;Temp.(61-90)], p< 0.001, coefficient signs (-/+). After “cf” is difference (Δ) or “E.D.” (“explained difference”) by other “[…]” parameters in the same equation. Supposed (given) inter-periodical 1.09-fold change in Si.gw and 0.82-fold change in [Hum.min], respectively
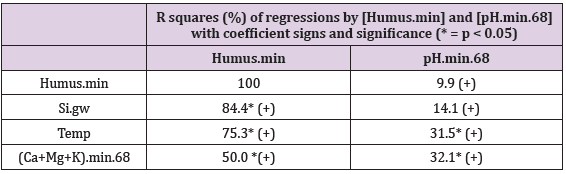
Table.
1) [Hum.min].E.[pH.min.68;Temp.(61-90)]_79.6_0.000.(-;+)..cf.[pH.min.88;Temp.
(81-10)].Δ. (-7.2) %
2) [Humus.min].E.[1.09*Si.gw;Temp.(60-90)]_85.5_0.000.(+;+).(78;22).cf.[Si.
gw;(Temp.(81-10)]..Δ.(-3.7)_%
3) [pH.min.68].E.[Hum.min.60’s;Temp.(61-90)]_43.4_0.014_(-;+)..cf.[0.82*Hum.
min.60’s;Temp.(81-10)].E.D. 36 %
4) [pH.min.88].E.[0.82*Hum.min;Temp.(81-10)]_64.4_0.000_(-;+).(27;73)..
cf.(Hum.min;T.(61-90)).E.D.45 %
5) [pH.min.88].E.[Si.gw;Temp.(81-10)]_65.9_0.000_(-;+).(30;70)..cf.[1.09*Si.
gw;Temp.(61-90)].E.D..36 %.
Inter-periodical difference in [Humus.min] was predicted by changes in [pH.min;
Temp] to be ad 7.2 %. Changes in [pH.min] was explained ad 45 %.
Conclusion: Factors indicating silicate weathering predicted regional humus content, pH and their changes in mineral soils, best humus content. Different continuous silicate weathering possibly explains the stable relative difference in regional pH values. Increase in silicate weathering rate can reduce atmospheric and increase soil carbon content.
Keywords: Humus; Silicon Weathering; Carbon Capture; pH; Temperature; Regional; Periodical; Cropland; (Ca+Mg+K)
Abbreviations: “.68”: Period 1966-1970; ”.88”: Period 1986-1990; “.(61-90)”: 1961-1990; “.(81-10)”: 1981-2010; CEC: Surrogate for Cation Exchange Capacity (Ca+Mg+K); COMS: Coarse Mineral Soils; FMS: Fine Mineral Soils (= clays + silt); Hum(us).min.(60’s): (parts in parentheses Depending on Space and Clarity); Hum: Humus Content of Finnish Mineral Soils in 1960-1970; min: Mineral Soils (coms + fims); prp: Proportion; RC: Rural Center; SOC: Soil Organic Carbon (ca. 0.58*humus); TOT: Total
Introduction
Silicate weathering contra carbonate weathering: Silicate weathering is known to sequestrate carbon, e.g.: CaSiO3 + 2CO2 + H2O > Ca++ + 2HCO-- +SiO2 (soluble) [1]. Importance of this process has been discovered lately: earlier “silicic” bedrock was interpreted to “promote the acidity of soils” [2]. Carbon capture via silicate weathering has been treated comprehensively e.g. in [3], including reduction of carbon loss caused by liming agents. To some extent silicate fertilizers have been known in agricultural praxis since the 19th century [4]. The decline in soil organic carbon (SOC) from mineral cropland soils estimated by data from 1974- 2009 has been ca 0.4 %/ha/a, i.e. ca 220 kg/ha/a [5]. Carbon loss has generally been associated positively with annual management practices and negatively with clay soils [5]. Biogenic amorphous silica can increase water-holding capacity of soil [6], which could resist erosion and support the maintenance of carbon balance. Independently on universal guiding for cropland liming [7], relative regional differences in cropland soil pH-values have stayed stable for decades [8]. The aim of this study is to clarify associations of humus content and pH of mineral soils with silicate weathering factors: groundwater silicon (Si.gw), temperature (Temp) and sum of soil soluble (Ca+Mg+K) [(Ca+Mg+K).min.68] and soil-type (clay proportion in fine mineral soils, Prp.(clays/fims)). Inter-periodical changes are assessed by pH from periods 1966-1970 (“68”) and 1986-1990 (“88”) and by Temp values from periods 1961-1990 (“(61-90)”) and 1981-2010 (“(81-10)”).
Materials and Methods
Latitude and longitude per Rural Centers (RC) - earlier ‘Agricultural Advisory Centers’ - have been determined, as in [9], by two-phases: first by selecting visually an approximate central commune/town of each RC in the map [10] and then via internetsearch [“GPS coordinates” and the name of the commune]. ((Table 1), includes the data for calculations). Mean annual temperatures of RC’s are approximated by the same method by benefiting map [10] together with map [11] for period 1960-1990 and with map [12] for period 1981-2010. Data on groundwater silicon mean (Si. gw) and median (Si.gw.md) from 1999, are provided by Geological Survey of Finland [13]. Soil pH, Ca, Mg and K values by Rural Centers from period 1966-1970. (N of samples by soil-types: mineral ca 270,000, mull ca 52,000 and org ca 97,000) and pH.min values from1986-1990 are provided by Viljavuuspalvelu Oy Kurki M [14] and Viljavuuspalvelu Eurofins Oy, (N ca 480,000), [15]. Occurrence of humus classes by RC’s and the whole country in 1960-1970 are obtained from [16], including ca 834,000 samples. Explanations for abbreviations of humus contents (Humus.min) in humus classes (i) of mineral soils (“vm” resp. 0-3 %, “m” resp. 3-6 % , “rm” resp. 6-12 % and “erm” resp. 12-20 %) are from [17]. Humus content of mineral soils, [Humus.min], for RC.x is attained by multiplying the proportion, occurrence (o.ix) (%) (Figuref 1a) of each humus class by its humus class content (c.i) (%) (approximated by the mean of the limits, i.e. 1.5; 4.5; 9 and 16, respectively), as a result (o.ix*c.i). After that each result in each humus class is divided by the sum of occurrences Σo.ix. The sum Σ[Σ(o.ix*c.i)/Σo.ix] gives the humus content of mineral soils in RC.x. The same procedure is reiterated for each RC and the whole country (Figures 1a & 1b). Because of the scanty number of groundwater samples Finska Hushållningss. (N 3) and Åland (N 6) [13] are excluded.
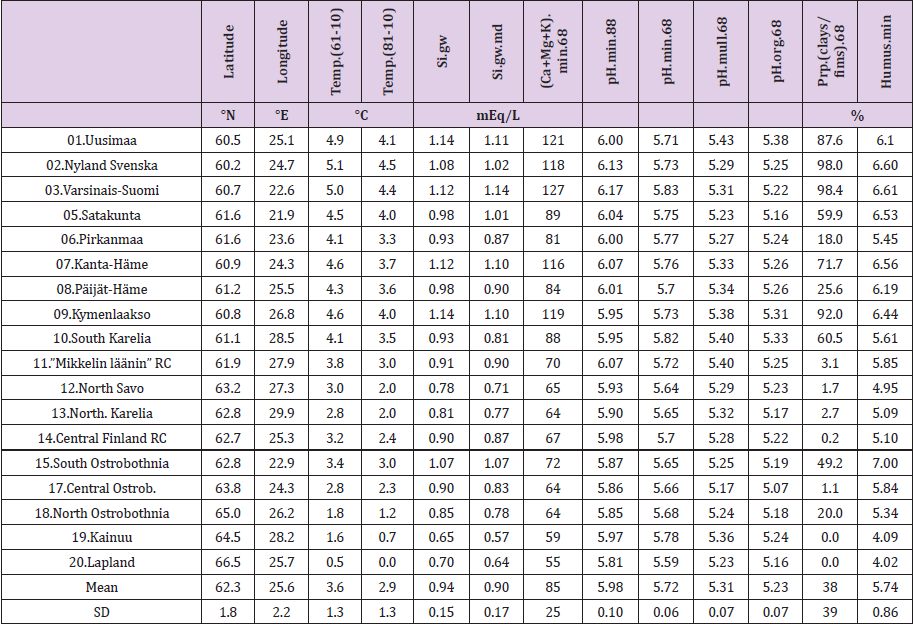
Table 1: Latitude, Longitude, Temperature in 1961-90 and 1981-2010, mean and median of groundwater Si, pH.min (of mineral soils) in 1986-90, pH.min, pH.mull, pH.org and proportion of clays in fine mineral soils in 1966-70 and humus content of mineral soils in 1960-70 by Rural Centers.
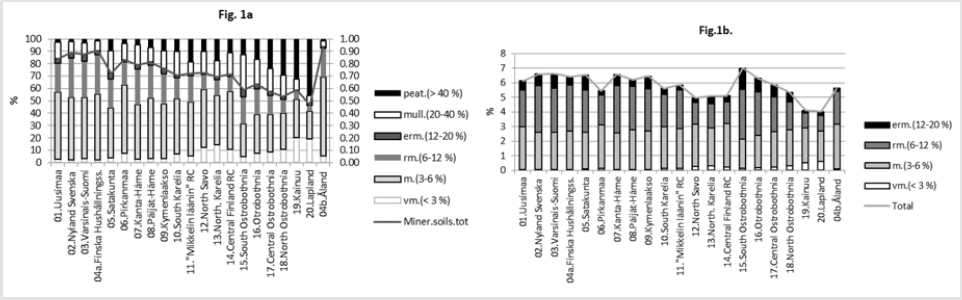
Figure 1:
a. Ditribution of soiltypes in Finnish Rural Centers
b. Humus content in Finnish mineral soils by humus clases and by Rural Centers in 1960-1970.
Ostrobothnia is excluded because of its high deviation between mean and median Si.gw [18] and additionally because its soil acidity, which is obviously regulated not only by silicates and humus, but by sulfur and iron compounds [19]. In Finnish experimental stations between 1960 and 1981 agricultural humus content was reduced in 13 fields and increased in 2 fields, on an average the humus content was reduced from 7.4 to 6.0 %, i.e. annually 9 % [20]. By data in [16] the mean humus content in Finnish mineral soils in 1960-70 (with midpoint in 1965) was 5.95 by all samples, by all RC’s 5.80, by selected RC’s 5.74. Values from [16] although they obviously under-estimate, are used as such. Approximates for soil organic carbon content [SOC] can be attained by multiplying humus-% by 0.58 [21] (Table 2). For clarity sometimes postfix “60’s” is added to [Humus.min]: [Humus.min.60’s]. Latitude [Lat] and longitude [Long] are given for further discussions. [Lat] is given as a reference for [Temp]. Regressions are performed by IBM SPSS Statistics 27. (Figure 1a) shows distribution (proportions, occurrence o) of soil-types in Finnish Rural Centers (RC), all RC’s included. (Figure 1b) shows humus contents of Finnish mineral soils by soil classes and by Rural Centers [15], including all RC’s. Values are calculated for each humus class (i) in RC.x by proportions, occurence (o.ix) (%) and humus content (c.i) (%) e.g. value for “m” in Uusimaa = o.m.Uusimaa*4.5/Σoi.Uusimaa. (Here, for clarity of the (Figure 1b), occurrence sum does not include organic soils). Table 3 represents R squares of single regressions by [Humus.min] and [Si.gw]. For normally distributed variables the significance level of (p = 0.05) of the R square for 18 pairs of observations is ca 0.22. R square (%) values above 22 are interpreted as significant for rapid survey. Signs in parentheses are directions of the regression coefficients.
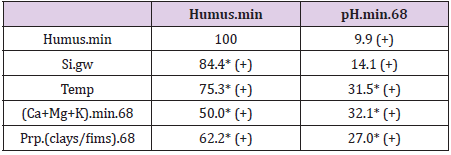
Table 3: R squares (%) of regressions by [Humus.min] and [pH. min.68] with coefficient signs and significance (* = p < 0.05).
Results
All represented associations were positive. All associations with Humus.min were significant. pH associated significantly with Temp, (Ca+Mg+K) and Prp.(clays/fims), but insignificantly with Humus.min and Si.gw.
Associations of Humus.min, Si.gw and pH.min.68 with Each Other
In compliance figures RC’s are arranged by [Temp] in increasing order
Associations of [Humus.min] with Parameters of Weathering Rate in Mineral Soils
Regressions of [Humus.min] are represented in (Figures 2-6). In parentheses are represented significances, signs of coefficients and possible proportions of Beta coefficients. Thin dotted lines show the limits of standard deviation. (Figure 2) shows [Humus.min] and its regression by (“E.by.”) [(Ca+Mg+K).min.68]. Regression by [(Ca+Mg+K).min.68], explained [Humus.min] positively by 49.6 % (p = 0.001). Geographic factors latitude and longitude explained [humus.min] by 73.5 % (p < 0.001). Compactly: [Humus.min].60’s.E.(Lat; Long)_73.5_0.000.(-;-).(61;39). In (Figure 3) distribution of [Humus-%.min] is like a mirror image of the distribution of Male CHD in 1964-1984, e.g. (Figure 3) in [18]. Figure 4 shows [Humus.min] and its regression by [Prp.(clays/ fims).68]. Regression by [Prp.(clays/fims).68]. explained positively [Humus.min] by 55.6 % (p < 0.001).
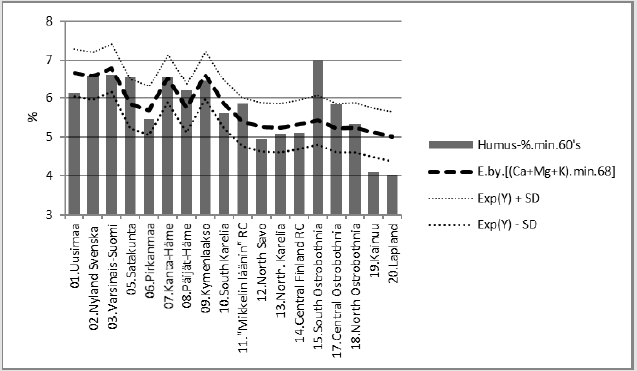
Figure 2: [Humus.min] and its regression by [(Ca+Mg+K).min.68].
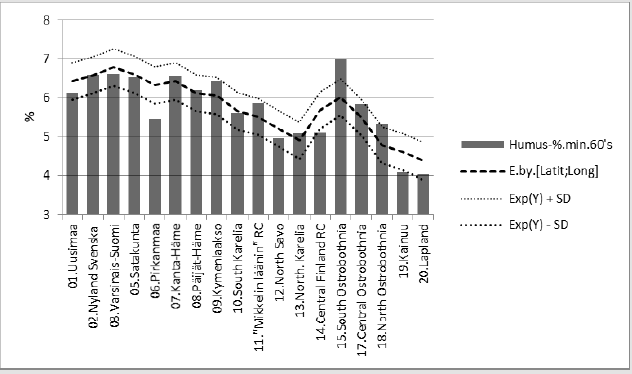
Figure 3: Regression of [Humus.min] by [Latit;Long].

Figure 4: [Humus.min] and its regression by [Prp.(clays/fims).68].
Predicting of Periodical Humus.min
Figure 5 represents [Humus.min] and its regression by [pH. min;Temp.(61-90)]. [Humus.min] was explained 80 % (p < 0.001) by this regression. The same equation with parameters: [pH. min.88;Temp.(t.0 +0.7 °C)] explained average change in [Humus. min] by 7.2 %. (Inter-periodical difference in mean Temp was 0.7 °C).
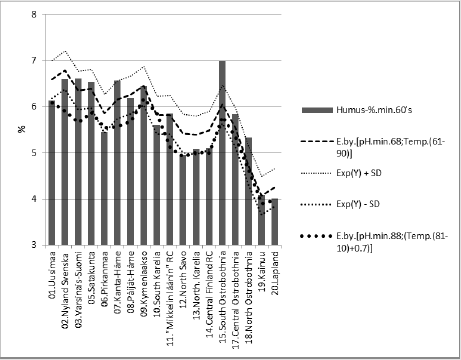
Figure 5: [Humus.min] and its regression by [pH.min.68;Temp.(61-90)], and curve by the same equation with parameters from the 1980’s.
Compact: [Hum.min.60’s].E.[pH.min.68;Temp.(61- 90)]_79.6_0.000.(-;+).(20;80).cf.[pH.min.88; Temp.(81-10)].Δ. -7.2 %. If proposed that Si.gw (or Si availability to plants) had been 22 % higher in period (66-70), than in (86-90), combined correlation of Si.gw and Temp could explain average decrease in Humus.min by 10.8 %. If Si.gw change had been 9 %, the average change in Humus. min had been 3.1 %.
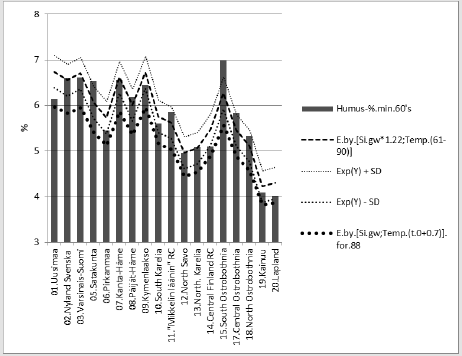
Figure 6: [Humus.min] and its regression by [1.22*Si.gw;Temp.(61-90)], and curve by the same equation with respective parameters from the 1980’s.
Compact: Humus.min.60’s.E.(Si.gw*1.22;Temp. (60-90))_85.6_0.000.(+;+).(78;22).cf.(Si.gw; T.(t.0+0.7). Diff..(-10.8)_%Humus.min.60’s.E.(Si.gw*1.09;Temp.(60- 90))_85.5_0.000.(+;+).(78;22).cf.(Si.gw;(Temp.(t.0+0.7)).E..(-3.7). Figure 7 shows that the pH in of mineral soils is higher than that of organic soils (including mull).
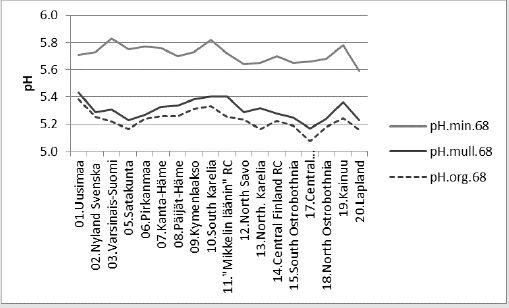
Figure 7: shows that the pH in of mineral soils is higher than that of organic soils (including mull).
pH.min and Its Predicting
Figure 8 suggests that similar successive pH values could have some explaining rules. Figure 8 shows changes in [pH.min] between periods “68” and “88”. Next are represented regressions of [pH. min.68]. In parentheses are given significances, signs of coefficients and possible proportions of Beta coefficients. In Figure 9 [pH.min] is explained 43.4 % (p = 0.014) by [Humus.min;Temp.(61-90)]. When supposed that inter-periodical decrease in Humus.min was 18 %, this gives coefficient 0.82 for Humus.min in the 1980’s. Mean inter-periodical difference (0.7 °C) was added for the parameters of 1980’s. Parameters [0.82*Humus.min;Temp.(t.0+0.7)] in the same equation explained 36 % of the observed average difference in interperiodical pH. Compactly: [pH.min.68].E.[Hum.min.60’s;Temp. (61-90)]_43.4_0.014_(-;+).(37;63).cf.[0.82*Hum.min;Temp.(81- 10)].E.(+36).%. In Figures 10 & 11 has been used supposed value 0.82*Humus min for Humus value in “88”. First was calculated regression for “88”, then “predicted” value for “68”. The average difference in inter-periodical pH was explained by 45 %.
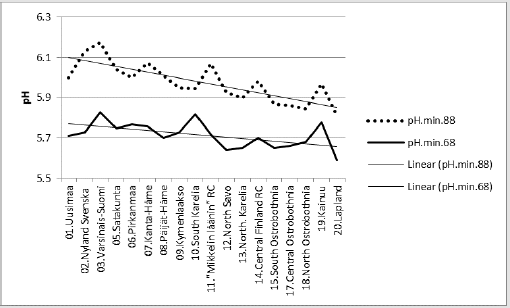
Figure 8: Suggests that similar successive pH values could have some explaining rules.
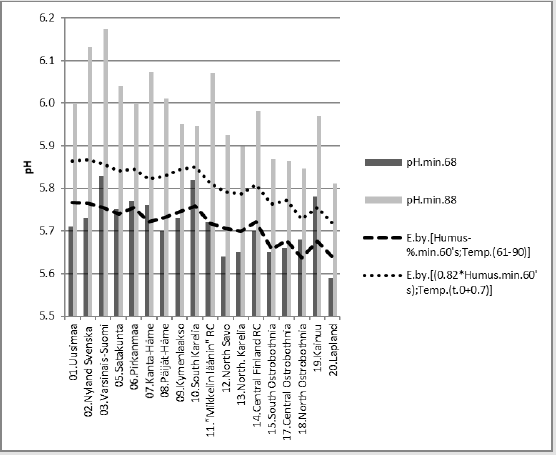
Figure 9: [pH.min.68] and its regression by [Humus.min;Temp.(61-90)], and curve by the same equation with respective parameters from the 1980’s.
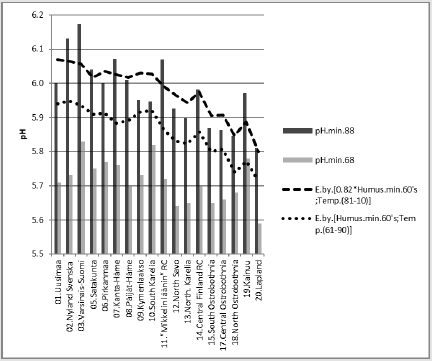
Figure 10: [pH.min.88] and its regression by [0.82*Humus.min;Temp.(81-10)] and a curve by the same equation with respective parameters from the 1960’s.
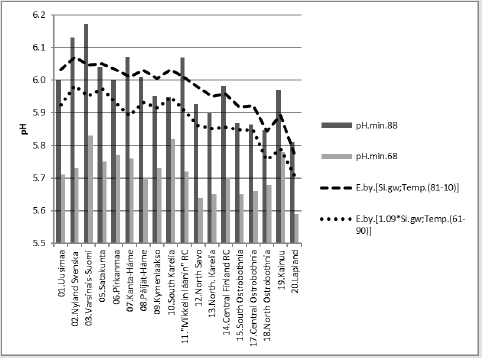
Figure 11: [pH.min.88] and its regression by [Si.gw;Temp.(81-10)] and a curve by the same equation with respective parameters from the 1960’s./p>
Compactly: [pH.min.88].E.[0.82*Hum.min;Temp.(81- 10)]_64.4_0.000_(-;+).(27;73)..cf.[Hum.min; Temp.(61- 90)].E.D.45% Supposed relative inter-periodical change in Si.gw (and/or Si availability), i.e. Si availability was 9 % higher in “68” than in “88”. Supposed Si.gw change with Temp increase, explained together 36 % of the average difference in inter-periodical pH.
Compactly: [pH.min.88].E.[Si.gw;Temp.(81-10)]_65.9_0.000_ (-;+).(30;70)..cf.[1.09*Si.gw; Temp.(61-90)].E.D.36 %. In Figure 12 are calculated [pH.min.88] regressions by [Si.gw;Temp.(81-10)]. For Si.gw was given supposed value, which is 1.6-fold to measure in 1999 (and especially for “88”). This could explain 99 % of the observed average difference in inter-periodical pH.
Compact: [pH.min.88].E.[Si.gw;Temp.(81-10)]_65.9_0.000_ (-;+).(30;70)..cf.[1.6*Si; Temp.(t.0-0.7)].E.Diff..99 %. Figure 13 shows [Si.gw] and its regression by [Humus.min;Temp.(61-90)]. Regression by [Humus.min;Temp.(61-90)] explained [Si.gw] by 88.3 % (p < 0.001), coeff. signs (+;+). Proportions of Beta coefficients: (59;41). Temperature seems to fortify the “Si.gw effect on Humus”.
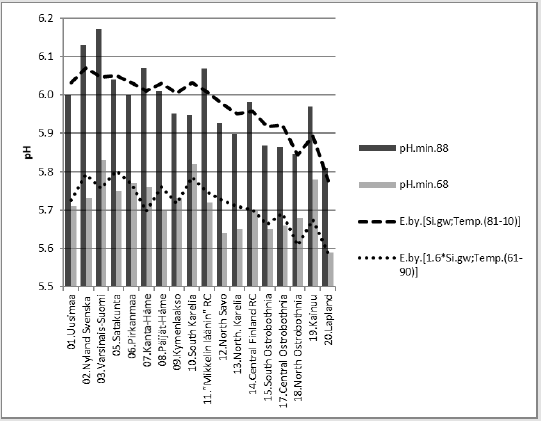
Figure 12: [pH.min.88] and its regression by [Si.gw;Temp.(81-10)] and a curve by the same equation with respective (supposed) parameters from the 1960’s.
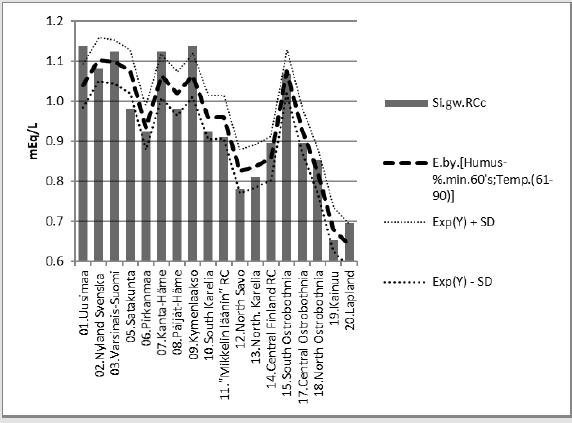
Figure 13: Si.gw and its regression by [Humus.min;Temp.(61-90)].
Associations Between Weathering Factors: Rural Centers are arranged in next (Figures 14 – 17) by increasing annual Temp (Figure 14) shows compliance between [Temp] and [Humus. min]. [Temp] explained [Humus.min] by 75.3 % (p < 0.001). N.B. prediction by plain Temp suggests 7 % increase in humus content between periods “68” and “88”!
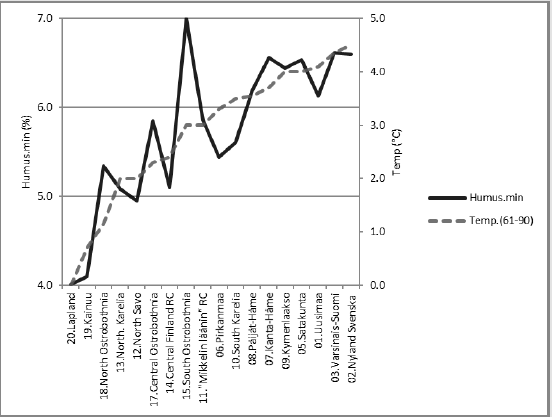
Figure 14: [Humus.min.60’s] and Temp.(61-90).
Compliance of Humus.min with Si.gw
Figure 15 shows compliance between [Humus.min] and [Si.gw]. [Humus.min] was explained 84.4 % by [Si.gw] and 85.4 % by [Si. gw;Temp.(61-90)].
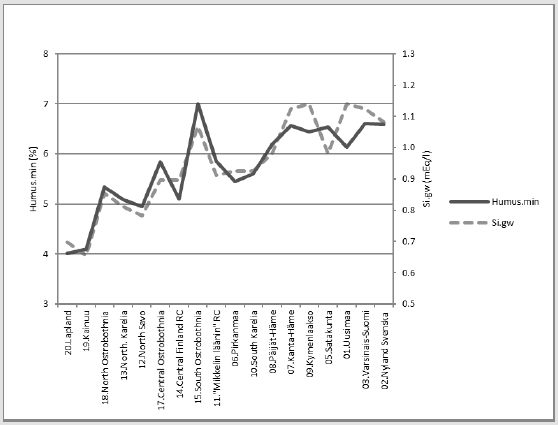
Figure 15: Association between [Humus.min] and [Si.gw].
Compliance of Humus.min with pH.min.68
Figure 16 shows compliance between [Humus.min] and [pH.min68]. [Humus.min] was explained 9.9 % by [pH.min.68] alone, but 79.6 % by [pH.min.68;Temp.(61-90)].
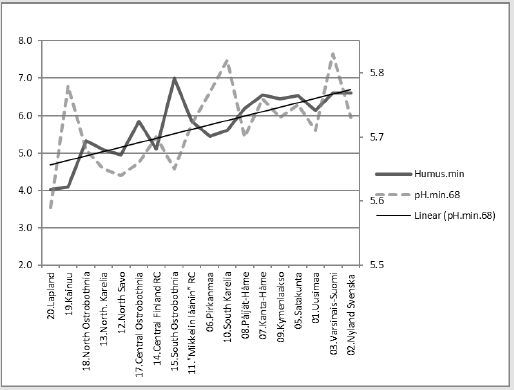
Figure 16: Association between [Humus.min] and [Si.gw].
Compliance of Si.gw with pH.min.68
Figure 17 shows compliance between[pH.min] and [Si.gw]. [pH.min] was explained positively 14.1 % (p = 0.125) by [Si.gw], but 39.7 % (p = 0.023) by [Si.gw;Temp.(61-90)].
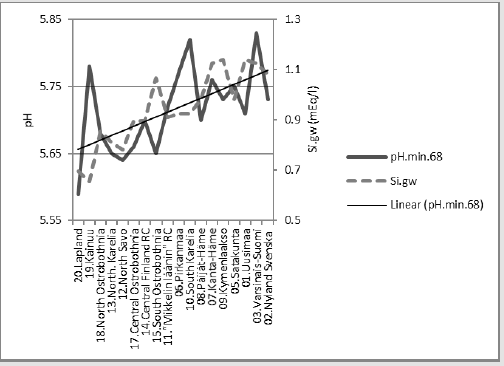
Figure 17: Association between [pH.min] and [Si.gw].
Compact: [pH.min.68].E.[Si.gw;Temp.(61-90)]_39.7_0.023_(-;+).(36;64). cf. Figure 2 in [24].
Discussion
[Humus.min] (SOC) was significantly explained by factors
associated with weathering (Table 1), (Figures 3-6). [Humus.min]
was best explained by [Si.gw] (84 %). Changes in [pH.min] and
[Temp] predicted 7.3 % reduction in [Humus.min] during 20 years.
[pH.min.68] was explained significantly positively by weathering
factors [Temp], [Prp.(clays/fims).68] and [(Ca+Mg+K).min.68].
Prerequisites for antacid production [1], maintenance of pH, in
non-carbonate soils are – as generally in chemical reactions –
temperature and proper substrates: Silicates are the real natural
liming agents – with pH ad 9.5 [22]. [(Ca+Mg+K).min] and [Si.
gw] are obviously mainly signs of preceding chemical reaction.
Anyhow some oligomers of Si.gw, [= H4SiO4, Si(OH)4], with pK
6.8 [23,24] can work as buffers and liming agents in Finnish
cropland soils where pH was and is below 6.8 [13,14,25]. Figures
9-12 represent combined pH regressions by [Humus.min], [Temp]
and/or [Si.gw]. Figures represent experiments for predicting
pH-value for two different decades by the same equation.
Agricultural soil gets acids not only via atmospheric CO2: plant
roots [26] and many micro-organisms excrete acids [27], which can
promote silicate weathering and carbon capture. Humus contains
even humic acids [28], with can have buffer abilities [29]. Possibly
silicon/silicon compounds work as matrix for formation of humic
acids [30]. By maintenance of soil humidity [6] the soluble silicates
can protect soil against erosion. (Obviously too effective ditching
could promote erosion and via humus loss elevate pH (Figure 9)).
Significant association of [Prp.(fims/min).68] with [Humus.
min] (Figure 2) is in concordance with Heikkinen et al. [5] who
found that clay soils resisted best carbon loss or even could
increase carbon binding independently on soil management [5].
Relative periodical stability in inter-regional pH values (Figure
11) is not fully explained. The data above suggests that it could be
dependent on different regional speed of weathering: high values
in weathering factors (low values in Lat) suggest on moderately
fast weathering of solid silicates, associated with [Si.gw] and
[(Ca+Mg+K)] formation. If the relative difference in weathering
factors remains for decades the same, so the relative difference
is expected to be the same in humus content and Si.gw. Anyhow,
as old farmers said: the soil can get “tired”, which suggests
that methods in represented in [3] are obviously worth trying.
Inter-periodical difference in [Humus.min] was explained 7 % by
changes in temperature and pH (Figure 5). Other predictions (Figures
6 & 9-12) are made by suppositions. Prediction of pH seems to need
additional factors as: changes in soil liming and changes in structural
and biological humus characteristics, possibly changes in acid rain,
although it is not supported by the approximated linear reduction [5].
Inter-dependence and the general trend of [Temp], [Humus.min],
[Si.gw] and [pH] are represented in (Figures 14-17), where RC’s are
arranged in order by increasing [Temp]. Although locally humus
content behaves oppositely to soil pH (and Si.gw), in micro-milieu
of roots, where liberation of soluble SiO2 and carbon capture
occurs, pH can obviously be above to the macroscopic level.
The scanty examples suggest that predicting [pH.min.68] by [pH.
min.88] and the average inter-periodical difference gives better
estimates than via predicting [pH.min.88] by [pH.min.68], possibly
depending on higher number of samples from “88” and shorter time
to 1999 (time point, when groundwater samples were collected).
Possibly plant available Si was changed inter-periodically, too.
Conclusion
Factors indicating silicate weathering predicted regional humus content, pH and their changes in mineral soils, best humus content. Different continuous silicate weathering possibly explains the stable relative difference in regional pH values. Increase in silicate weathering rate can reduce atmospheric and increase soil carbon content.
Acknowledgement
I am grateful to Professor Osmo Hänninen and late veterinary surgeon Seppo Haaranen for several discussions.
References
- Töysä T (2019) Regional K buffer in organic and mineral soils and their associations with estimated cation exchange capacity, pH, groundwater silicon and some environmental factors in continental Finland 1986-90 with discussion on inorganic carbon. Biomed J Sci & Tech Res 20(3).
- Koljonen T (1975) The behavior of Selenium in Finnish soils. Ann Agr Fenn 14(3): 240-247.
- Beerling DJ, Leake JR, Long SP, Scholes JD, Ton J, et al. (2018) Farming with crops and rocks to address global climate, food and soil security. Nature plants 4(3): 138-147.
- Bernard R (1894) Introduction to Bread from Stones. From Bread from Stones: A New and Rational System of Land Fertilization and Physical Regeneration by Dr. Julius Hensel (Agricultural Chemist). Translated from the German: 1-111.
- Heikkinen J, Ketoja E, Nuutinen V, Regina K (2013) Declining trend of carbon in Finnish cropland soils in 1974-2009. Global Change Biology 19(5): 1456-1469.
- Schaller J, Cramer A, Carminati A, Mohsen Zarebanadkouki (2020) Biogenic amorphous silica as main driver for plant available water in soils. Sci Rep10: 2424.
- Yli Savola, Sari (2002) Kalkitusyhdistyksen Kalkitusopas.
- Töysä T, Hänninen O (2017) Soil pH Ca and Mg Stability and pH Association with Temperature and Groundwater Silicon. Biomed J Sci & Tech Res 1(7): 1851-1853.
- Töysä T (2018) Regional associations of CHD and musculoskeletal morbidity with environmental and geographic factors – e.g. Ca, Mg, Si, Sn. Biomed J Sci & Tech Res 4(2): 3797-3803.
- Agriculture and forestry 1990:2 Helsinki: National Board of Agriculture.
- Ilmatieteenlaitos in Lahermo P, Tarvainen T, Hatakka T, Backman B, Juntunen R, et al. (2015) Suomen kaivovesien fysikaalis-kemiallinen laatu vuonna 1999. Geologian Tutkimuskeskus. Tutkimusraportti 155: 1-92.
- Finnish Meteorological Institute.
- Lahermo P, Tarvainen T, Hatakka T, Backman B, Juntunen R, et al. (2002) Tuhat kaivoa - Suomen kaivovesien fysikaalis-kemiallinen laatu vuonna 1999. In: Lahermo P, Tarvainen T, Hatakka T, Backman B, Juntunen R, et al (Eds.)., Geologian tutkimuskeskus, Finland.
- Kurki Martti (1972) Suomen peltojen viljavuudesta II. pp 135-145.
- (2015) Liite_1.2. Eri maalajien keskimaarainen happamuus ja_86_90. xls 117.50 KB. Acidity and mineral element contents per soil-types in Finnish Rural Centres 1986-1890.
- Kurki Martti (1972) Suomen peltojen viljavuudesta II. Proportions of humus-classes by regions.
- https://fi.wikipedia.org/wiki/Maalaji
- Töysä T (2020) Regional Groundwater Si and Mg/Ca, Soil Mg/Ca, Soil-Types, Cardiac Diseases and Local Long-Term Dolomite Application - Soil Values from Two Periods Suggest on Different Roles of Mg and Si in Cardiac Epidemiology. Biomed J Sci & Tech Res 26(5): 20363-20378.
- Hartikainen H (2005) Occurence and chemistry of selenium in Finnish soils on p. 22 in Agrifood Research Reports 69. In: Eurola M (Edt.). Proceedings Twenty Years of Selenium Fertilization, Helsinki, Finland.
- Erviö R (1982) Changes in humus content by some experimental stations. Bulletin 17. Agricultural Research Center, Soil Research Center, 31600 Jokioinen, Finland.
- Waksman SA, Stevens KR (1930) A critical study of the methods for determining the nature and abundance of soil organic matter. Soil Sci 30(2): 97-116.
- Silva B, Paradelo R, Vázquez N, García Rodeja E, Barral MT (2012) Effect of the addition of granitic powder to an acidic soil from Galicia (NW Spain) in comparison with lime. Environmental earth sciences 68(2): 429-437.
- Belton DJ, Deschaume O, Perry CC (2012) An overview of the fundamentals of the chemistry of silica with relevance to biosilicification and technological advances. FEBS J 279(10): 1710-1720.
- Töysä T (2019) Regional pH in Five Agricultural Soil-Types – Associations with Temperature and Groundwater Si in Continental Finland. Biomed J Sci & Tech Res 14(1): 1-8.
- Keskinen R, Ketoja E, Heikkinen J, Salo T, Uusitalo R, et al. (2016) 35-year trends of acidity and soluble nutrients in cultivated soils of Finland. Geoderma Regional 7(4): 376-387.
- Ström L (1997) Root Exudation of Organic Acids: Importance to Nutrient Availability and the Calcifuge and Calcicole Behaviour of Plants. Oikos 80(3): 459-466.
- Boyle JR, Voigt GK, Sawhney BL (1974) Chemical weathering of biotite by organic acids. Soil Science 117(1): 42-45.
- Humic substance.
- Pertusatti J, Prado AGS J (2007) Buffer capacity of humic acid: thermodynamic approach. Colloid Interface Sci 314(2): 484-489.
- Schwarz K (1974) Recent dietary trace element research, exemplified by tin, fluorine and silicon. Federation Proceedings 33(6): 1754-1757.
