info@biomedres.us
+1 (502) 904-2126
One Westbrook Corporate Center, Suite 300, Westchester, IL 60154, USA
Site Map
 ISSN: 2574 -1241
Received: September 25, 2026; Published: October 14, 2026
*Corresponding author: Takuma Nomiya, Laboratory of Med. Science and Metaphysics,1-5-6-RisonaKudan Bldg. 5F, Kudan-minami, Chiyoda-ku, Tokyo, 102-0074, Japan
DOI: 10.26717/BJSTR.2026.67.010436
Purpose: The classical biological model can be classified into the “multi-Target single-Hit” model and the “single-
Target multi-Hit” model. However, the “multi-Hit” model has been in decline before it is fully discussed. The
purpose of this study is to verify the accuracy of that model and to produce a calculation model which can be
fitted to actual cell survival curves.
Materials and Methods: Survival rate of microorganism in the “multi-Target single-Hit” model and the “single-
Target multi-Hit” model were calculated by using spreadsheet application. Ten actual cell survival data were
used for fitting survival curves in each model, and the least squares method was used for fitting.
Results: Both models were successfully represented by equations using only two parameters of “n” (the number
of Target/Hit) and “k” (fitting coefficient). As a result of fitting to the actual survival data, the sum of least squares
in the “multi-Target single-Hit” model and the “single-Target multi-Hit” model were 3.0889 (S.D. 5.660) and
0.7545 (S.D. 1.1331), respectively. The “multi-Hit” model showed better fitting than the conventional “multi-Target”
model.
Conclusion: Although the equation [1 -(1 -e)n] which is based on the “multi-Target single-Hit” model has been
used until these days, actually, the “single-Target multi-Hit” model has shown to be more suitable for calculating
survival rate.
Keywords: Target Theory, Multi-Target Model, Mutli-Hit Model, Radiosensitivity
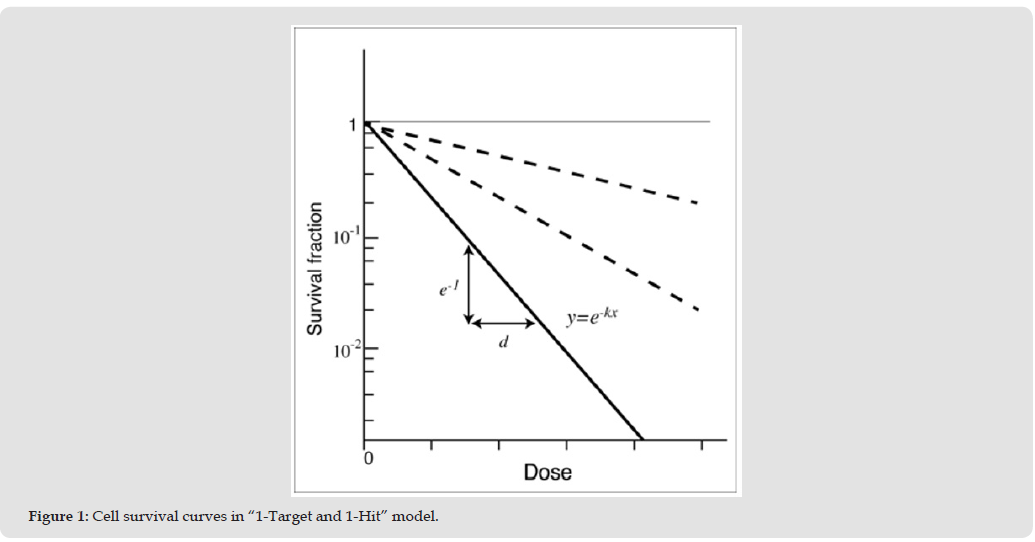
The “Target theory” is an essential theory to understand basic radiation biology. The basic concept of the Target theory has been established in the mid-20th century, and has been supported until present [1-3]. Fundamental concept of the Target theory is that when a certain number of “Hit (radiation damage)” occurs on a certain number of “Target” in a cell, and all the Target in the cell are inactivated, then the cell is inactivated (dies). In the “single-Target single-Hit” model in which a cell has single Target and the Target is inactivated by one or more Hits, when a dose which occurs average 1 Hit per Target (mean lethal dose: MLD) has been irradiated, the cell survival rate becomes “e-1” (37%: e is base of natural logarithm) (Figure 1, Appendix A). In case a dose of “x*MLD” is irradiated to a cultured cell line, the cell survival rate becomes “e-x”, and using constant “k” which represents inherent coefficient of a cell line, the cell survival rate is described as “e-kx”. Survival curves of a certain bacterium like Balantidium coli shows straight line, and these survival curves are correspond with “single-Target single-Hit” model [4]. When it comes to “multi-Target” model or “multi-Hit” model, a cell survival curve is described as follows [5, 6];

S: cell survival rate, xD: irradiated dose, n: number of Target(s)
To be exact, this equation represents survival rate based on the “multi-Target and single-Hit” model. Other than the above model, there are “single-Target multi-Hit” model and “multi-Target multi-Hit” model as variations of Target models [7]. However, only the abovementioned equation (the “multi-Target single-Hit” model) is explained as “Target theory” in the almost all textbooks of radiation biology, and “single-Target multi-Hit” and “multi-Target multi-Hit” models are not usually explained. So, many readers seem to be apt to regard that the “Target theory” and “multi-Target single-Hit” model is identical. In the present study, the “multi-Target single-Hit” model and the “single-Target multi-Hit” model were compared, and we evaluated that which model is the better to apply to (or fit with) actual cell survival curves.
Figure 1
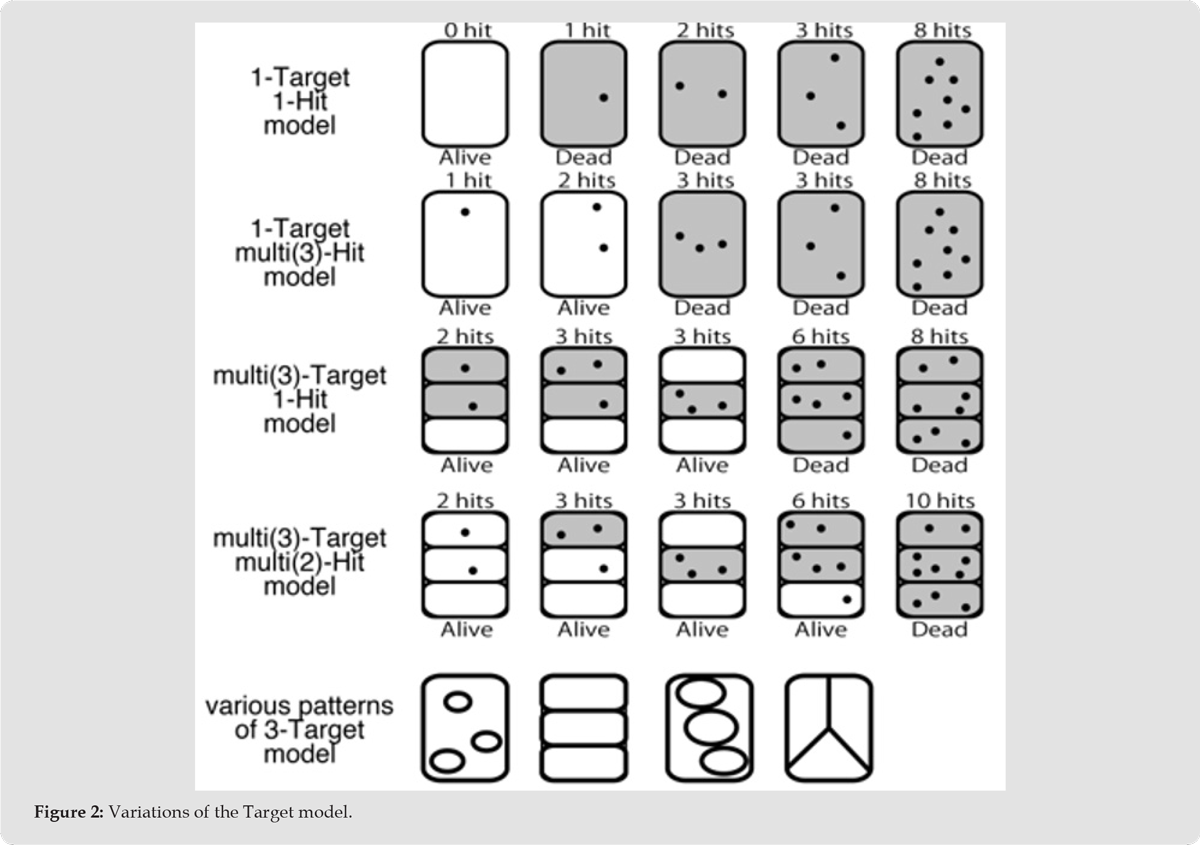
Each model was defined as follows (Figure 2);
A) “Single-Target Single-Hit” Model: A single microorganism (a cell, a virus, a bacterium, etc.) has one Target, and the Target is inactivated by a single Hit.
B) “Multi-Target Single-Hit” Model: A single microorganism has more than one Target, and each Target is inactivated by a single Hit.
C) “Single-Target Multi-Hit” Model: A single microorganism has one Target, and each Target is inactivated by more than one Hit.
D) “Multi-Target Multi-Hit” Model: A single microorganism has more than one Target, and each Target is inactivated by more than one Hit.
A single microorganism is inactivated (dies) when all Targets are inactivated. A microorganism survives when at least one Target is active. In the above models, (B), (C) and (D) correspond with “multi-Target” or “multi-Hit” model. (D) is a very complicated model which consist of compound concept of (B) and (C). Too complicated and impractical model is just only to prevent researchers and clinical doctors from understanding biological models. So, we limited the purpose of the present study to compare only (B) and (C) in order to clarify and simplify the focus of the problem.
Figure 2
Calculation of Each Model was Performed Under the Following Conditions:
− Although a microorganism (a single life unit) is applicable to not only a cell, but also a virus, a phage, a bacteria, a yeast, etc., we call the single life unit as “cell” for convenience in the present study.
− The size and the shape of a Target are not specified. Provided that the probability of “a certain number of Hit” in one Target is quite the same in each Target (but the actual “number of Hits” are different according to the Targets even in the same probability).
− The nature of the “Target” is not argued here. It is not defined whether the Target is nucleus or mitochondria or DNA or a certain protein or whatever. But a “Target” is a something inactivation of which lead cells to death.
− “A single Hit” means a certain amount of damage to the cell by irradiation, and “single Hit” does not always mean single phenomena. “2 Hits” and “3 Hits” mean twice or three times as much damage as “1 Hit”.
− The microorganisms are identical and homogeneous in the all models in this study. In the “n-Target” model, all the cells have “n” Targets. In the “n-Hit” model, all the Targets are equally inactivated by “n” Hits.
− “Cell cycle-dependent radiosensitivity”, “Repopulation of cells” or “Repairing cell damage” are not considered in this study. These factors may have to be included in the model in the future, but these have not been included in this model yet.
− “Extrapolation number”, “D0” and “DQ” are not specified in this study. These are mentioned in the part of “Discussion”.
Cell survival rates were calculated by using spreadsheet applications on computers. Cell survival curves were fitted by using the least squares method. Cell survival data which were used for fitting-sample were cited from the past publications [2, 8-14]. Ten cell lines were selected from radiosensitive cell lines to radioresistant cell lines evenly. For convenience of calculation, the number of Target (“n”) were calculated by maximum of 20 in both the “multi-Target single-Hit (conventional concept)” model and the “single-Target multi-Hit (new concept)” model.
Cell survival rate when a dose which occurs x-Hits per one Target “D(x)” was irradiated was defined as S(x), the number of Target was represented as “n” (integer, n>0). The survival rate in the “multi( n)-Target single Hit” model was defined as “STn(x)”, and the survival rate in the “single-Target multi(n)-Hit” model was defined as “SHn(x)”.
i) In the “single-Target single-Hit” model, it is assumed that a cell (= one Target) is inactivated (dies) by 1 Hit. It has been known that when a dose which occurs averagely x-Hit per Target “D(x)” was irradiated, the cell survival rate “S(x)” is calculated as “e-x” (Appendix A).
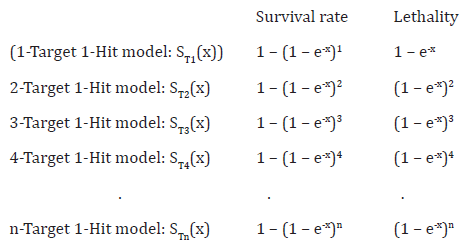
ii) In the “multi-Target single-Hit” model, the survival rate and the lethality is represented as follows;
Probability that one Target is not inactivated with a dose of D(x): e-x
Probability that one Target is inactivated with a dose of D(x): 1 – e-x
Probability that all “n” Targets are inactivated (= Lethality): (1 – e-x )n
Probability that at least one Target survives (= Survival rate): 1 – (1 – e-x )n (2)
iii) Survival rate and lethality in 1-Target multi-Hit model are calculated as follows;
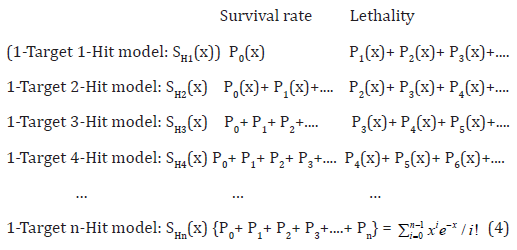
iv) Probability of “n”-Hit cell in the “single-Target multi-Hit” model is calculated as follows. It is known that a probability that a phenomenon which causes averagely “x” times causes “n” times follows Poisson distribution [15-17].
− Probability that 0 Hit occurs in one Target: P0(x) = x0·e-x /0!
− Probability that 1 Hit occurs in one Target: P1(x) = x1·e-x /1!
− Probability that 2 Hits occur in one Target: P2(x) = x2·e-x /2!
− Probability that 3 Hits occur in one Target: P3(x) = x3·e-x /3!
… …
− Probability that n Hits occur in one Target: Pn(x) = xn·e-x /n!
(3) (Appendix B)
v) Cell survival rates in the “single-Target multi-Hit” model is described as follows;
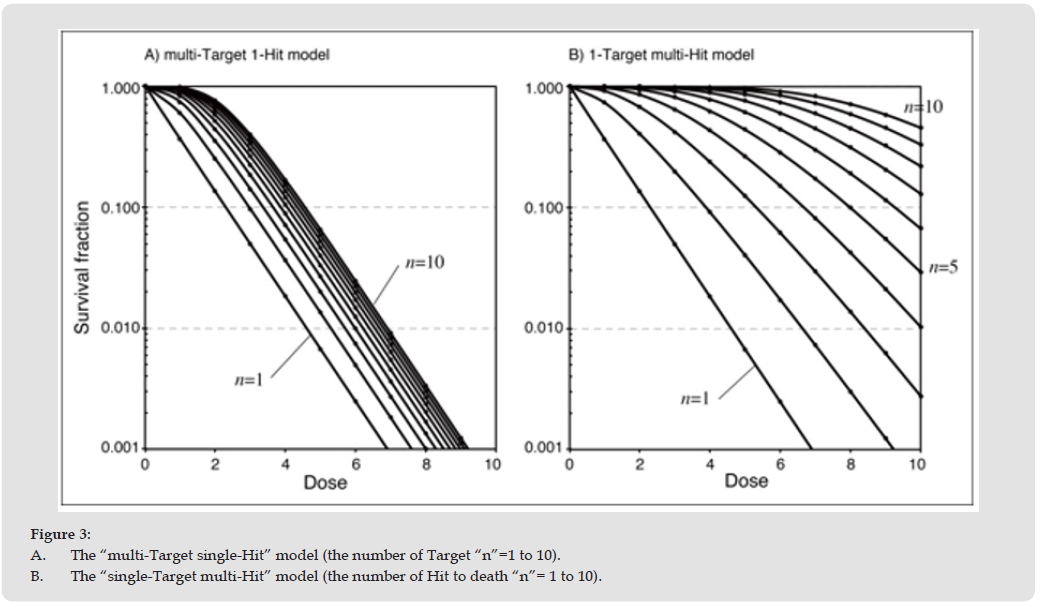
Calculated cell survival rates of the “multi-Target single-Hit” model and the “single-Target multi-Hit” model were shown in Table 1, and the calculated survival curves were shown in Figure 3. As shown in the graphs, survival curves in these two models resulted in quite different shape. Although equation (2) and equation (3) had been confused by some researchers, it was proven that these equations were not identical and did not converge with each other.
Table 1: Cell survival rate of each model.
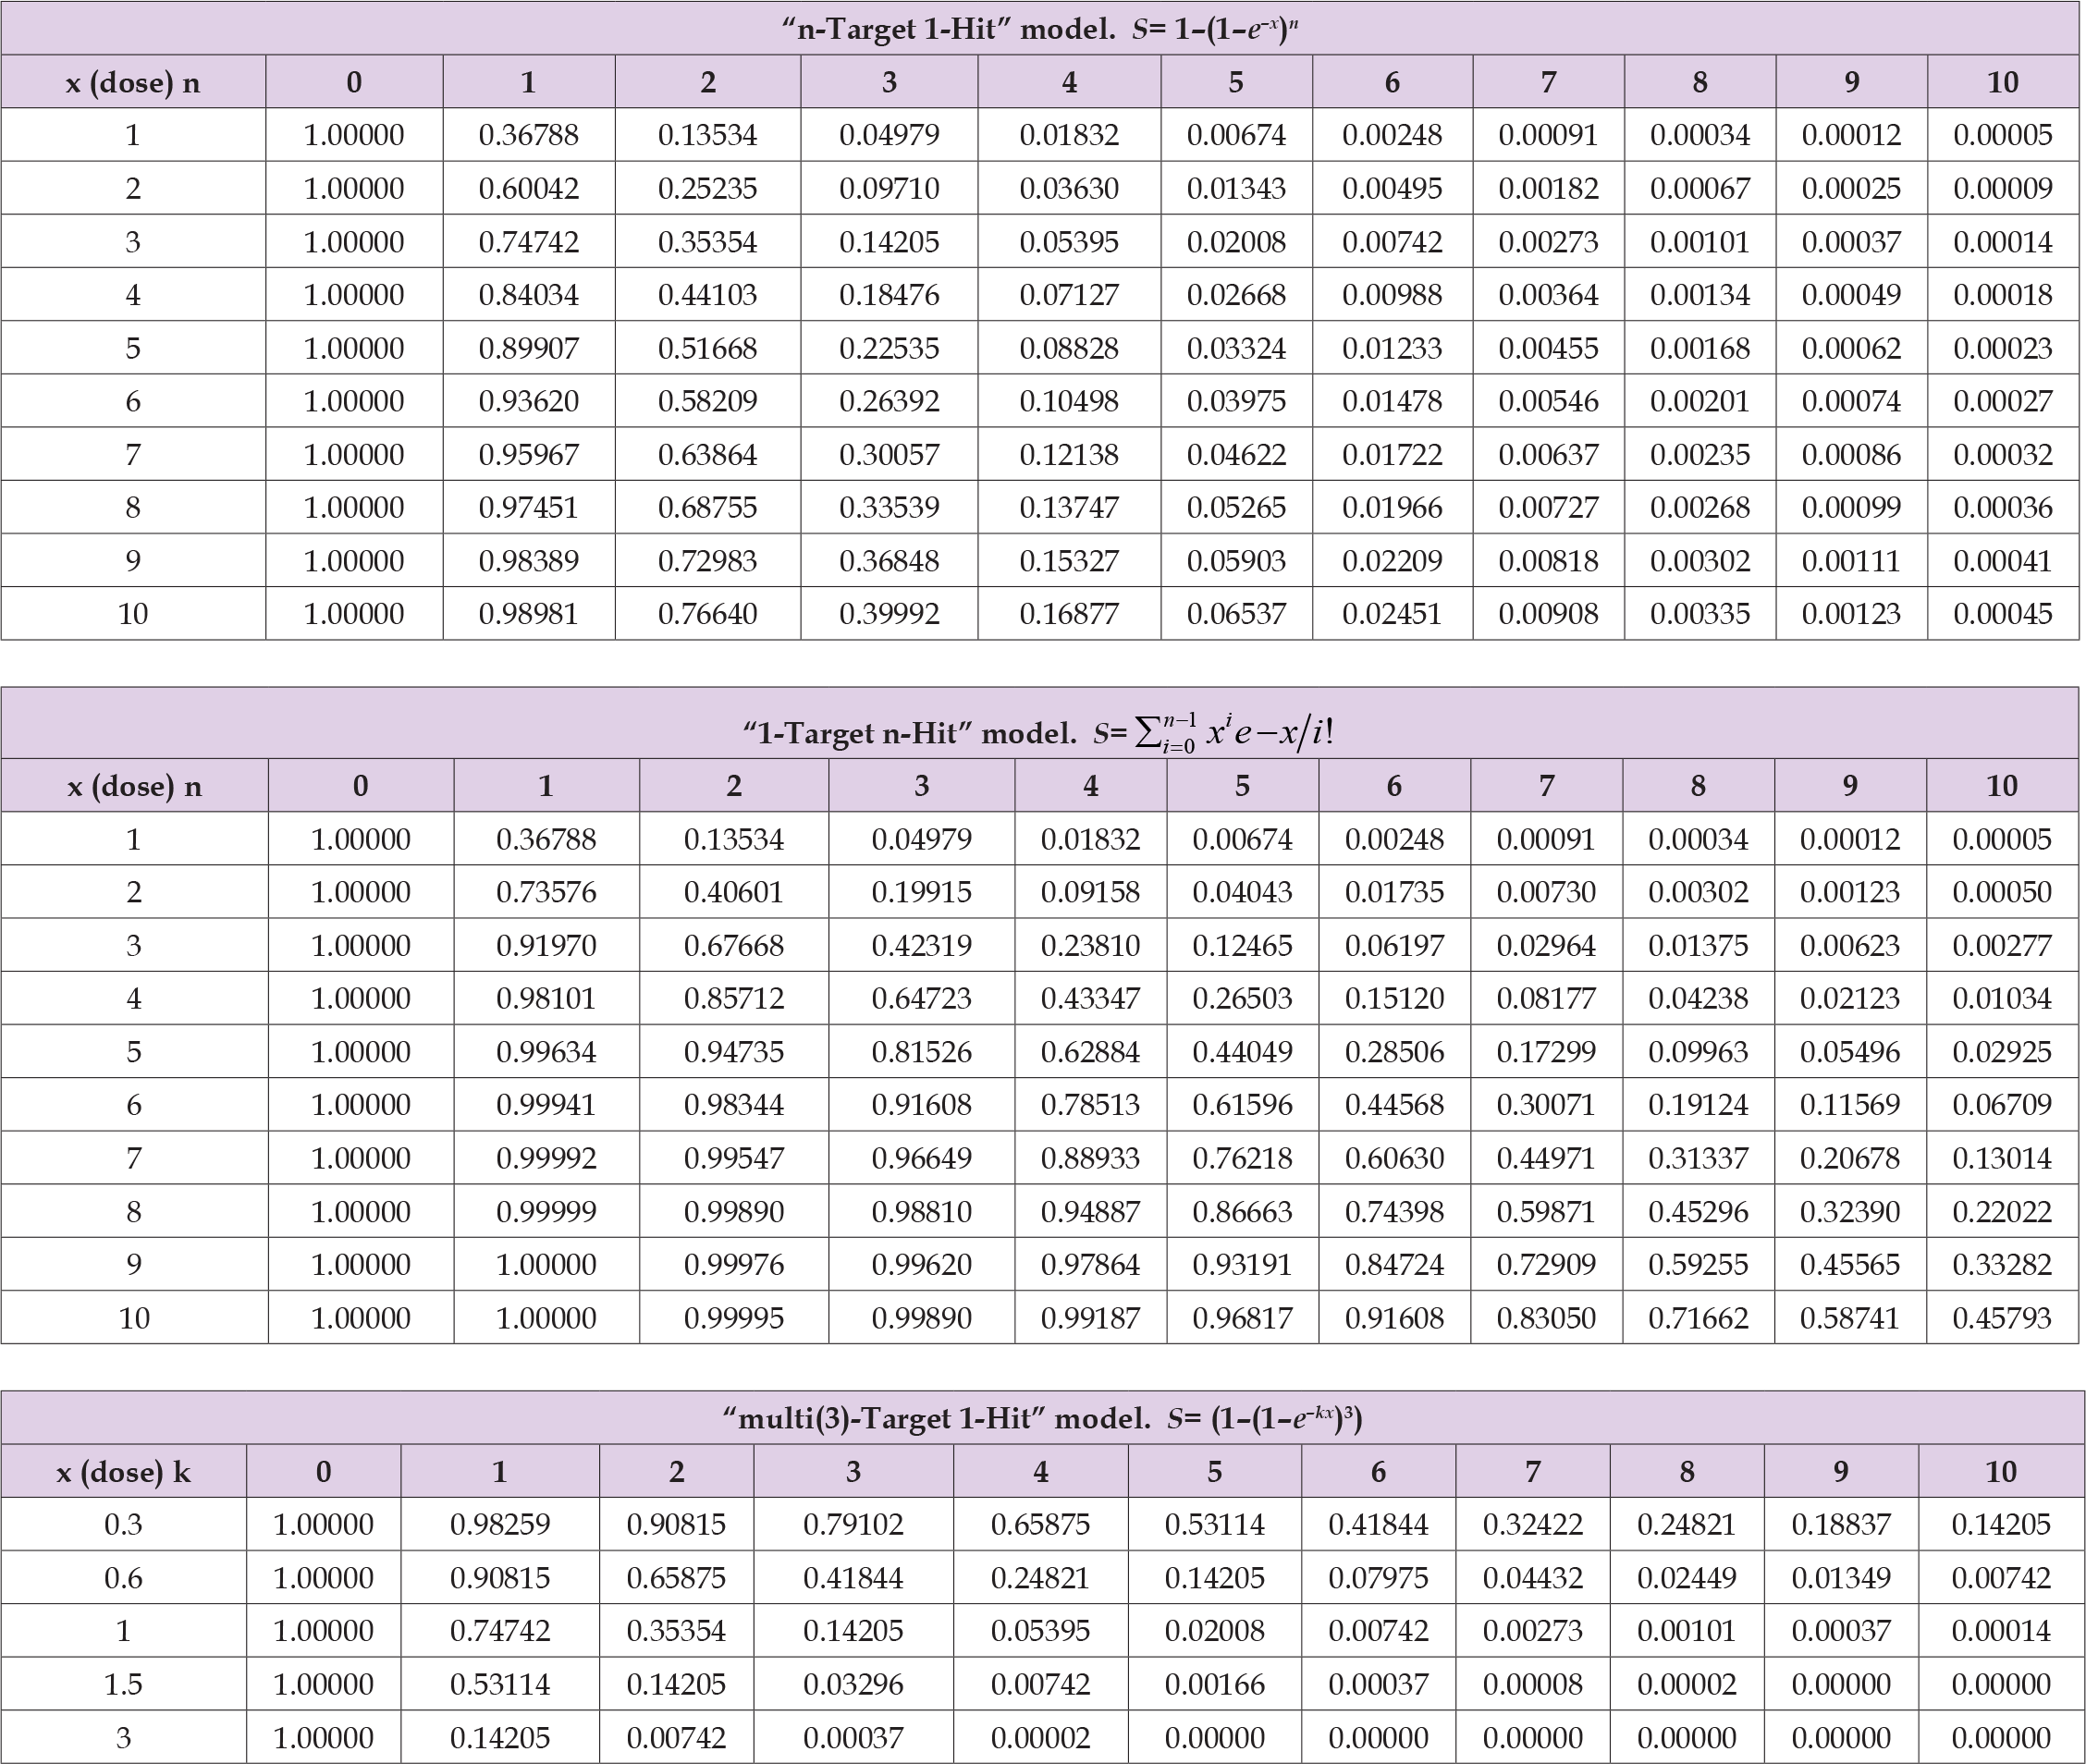
Figure 3
Fitting by Coefficient “K”
As the radiosensitivity differs according to each cell line (bacteria, virus, etc.), the slope of the cell survival curves also differs according to the cell lines. Coefficient “k” is a continuous variable from -∞ to +∞, and was used for fitting the cell survival curves. The equations of the “multi-Target single-Hit” model and the “single-Target multi-Hit” model are described as follows by using coefficient “k”;
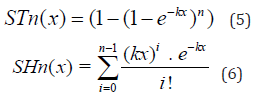
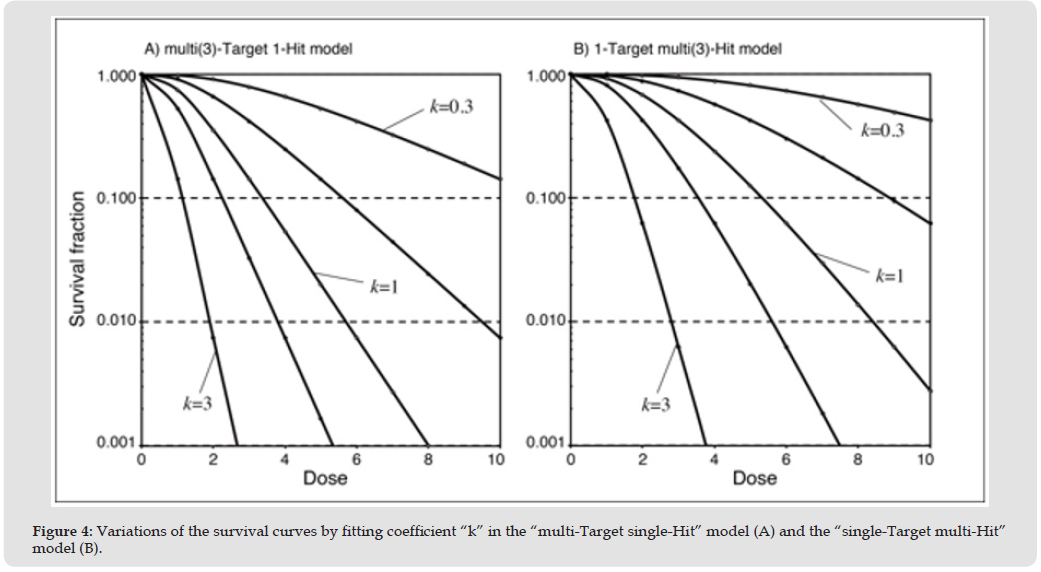
STn: survival rate in “n-Target 1-Hit” model, SHn: survival rate in “1-Target n-Hit” model, x: average number of Hits per cell. Given the number of Targets or the number of Hits “n” = 3 as example, the results in case of “k” = 0.3, 0.5, 1, 1.5, 3 were shown in Table 2 and Figure 4. These graphs have shown that various survival data can be fitted by changing coefficient “k”. And theoretically, any cell survival curves can be fitted by changing the value of “n” and coefficient “k” in both 2 models (Appendix C).
Table 2: Cell survival rate of each model.

Figure 4
Fitting Survival Curves to the Actual Cell Survival Data
The results of survival curve fitting to the actual survival rate data in each model are shown in Table 3. As shown in the Table, the average of the sum of least squares of the 10 cell lines’ survival data in “conventional” model and “new” model were 3.0889 (S.D. 5.669) and 0.7545 (S.D. 1.1331), respectively. The sum of least squares in the “1-Taget multi-Hit (new concept)” model was less than that of the “multi-Target 1-Hit (conventional concept)” model. It means that the survival curves in the “single-Target multi-Hit” model were better fitted to the actual survival data than the “multi-Target single-Hit” model. Because the purpose of the present study is not to find statistically significant difference, statistical analysis has not been performed. With regard to the number of “n”, the survival curves of some radioresistant cell lines were likely to show 20 or larger value in the “multi-Target 1-Hit (conventional concept)” model. On the other hand, the survival curves in the “1-Target multi-Hit (new concept)” model were fitted with generally lower value of “n”, and all survival curves of the 10 cell lines could be fitted with lower valuse of “n” within 20. From the result of sample cell survival data, two sample data which showed similar fitting between the “multi-Target” model and the “multi-Hit” model are shown in Figure 5 (A & B).
Table 3: The results of survival curve fitting in each model
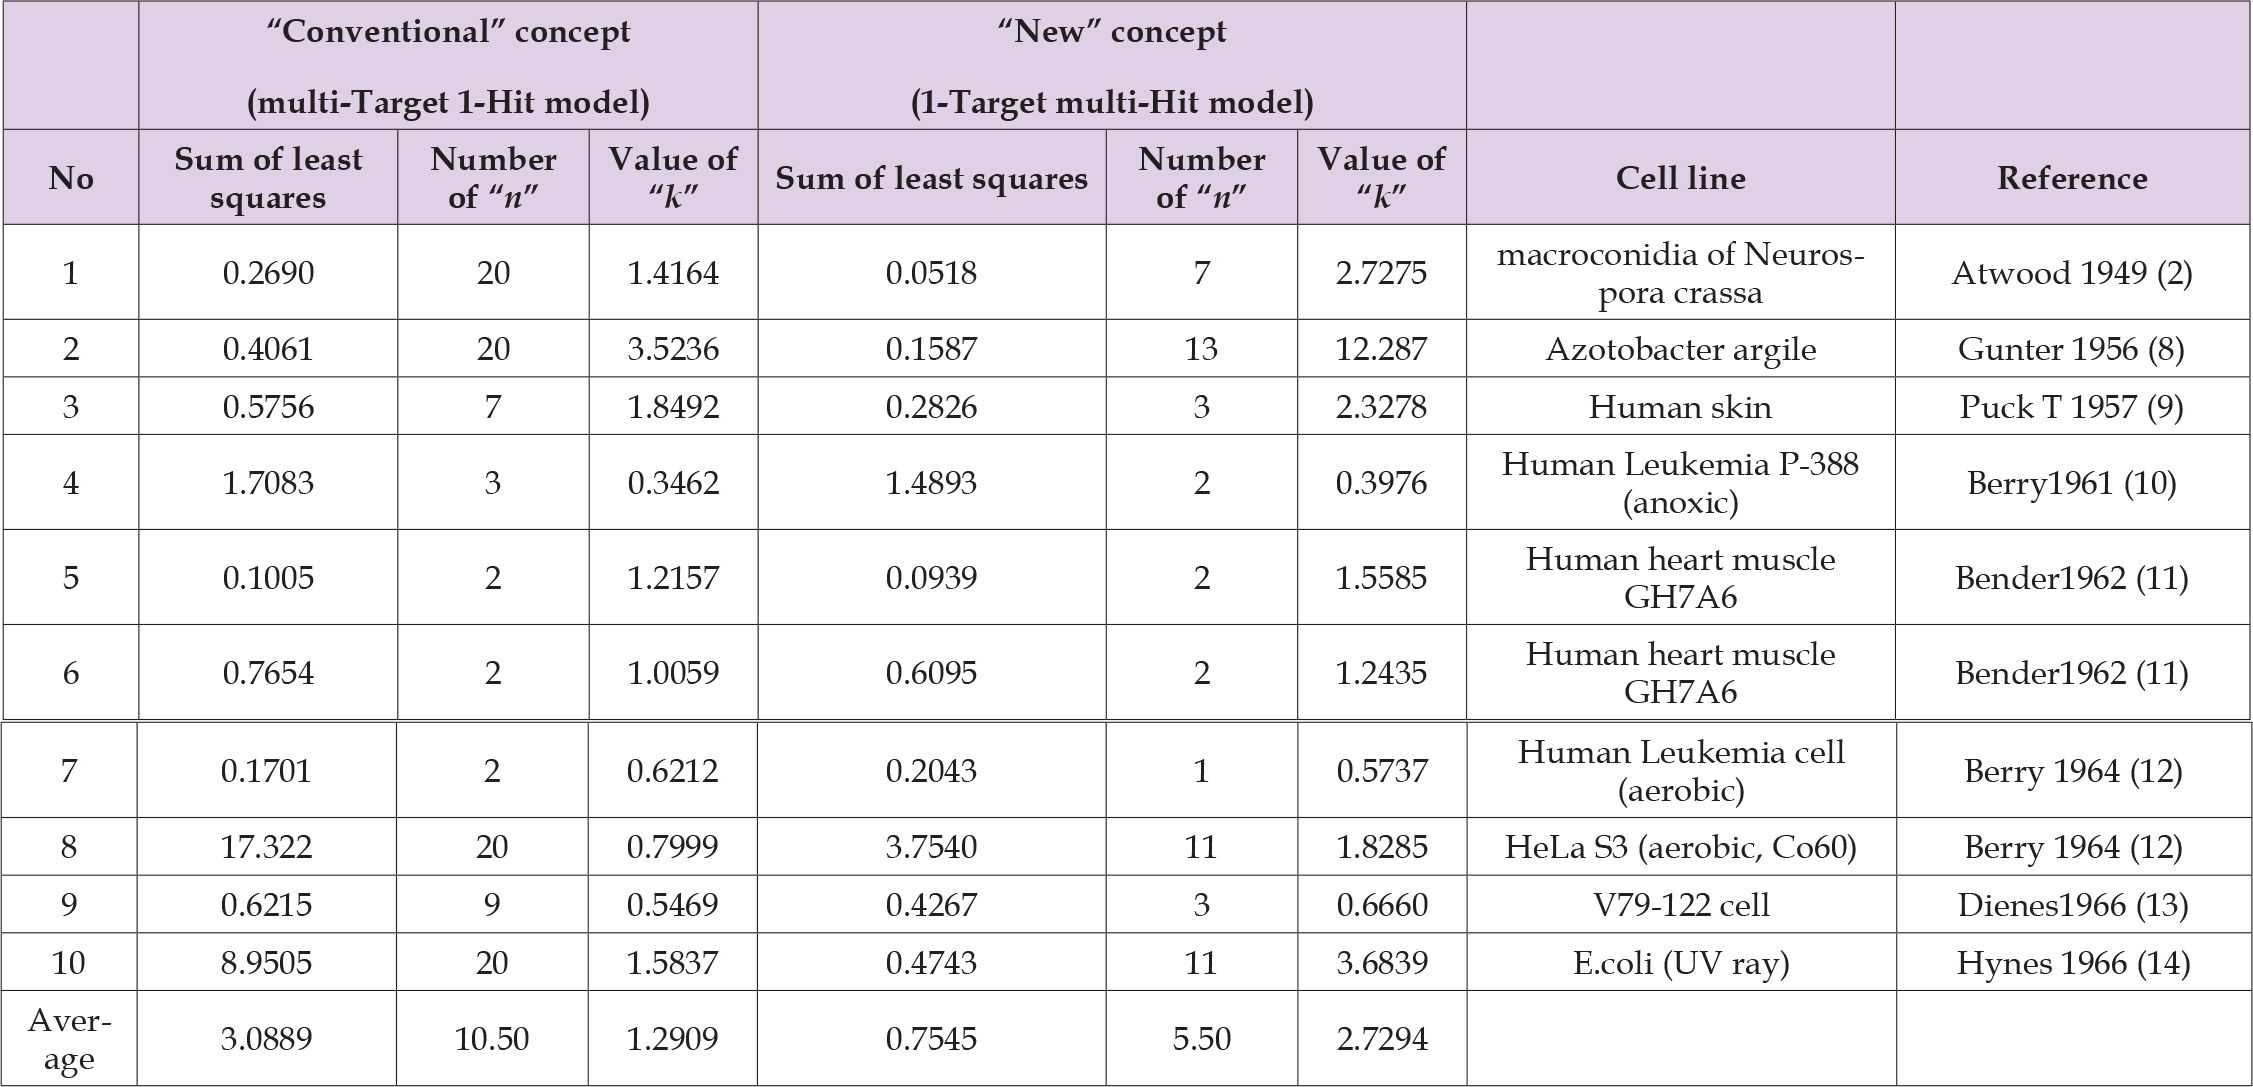
Figure 5
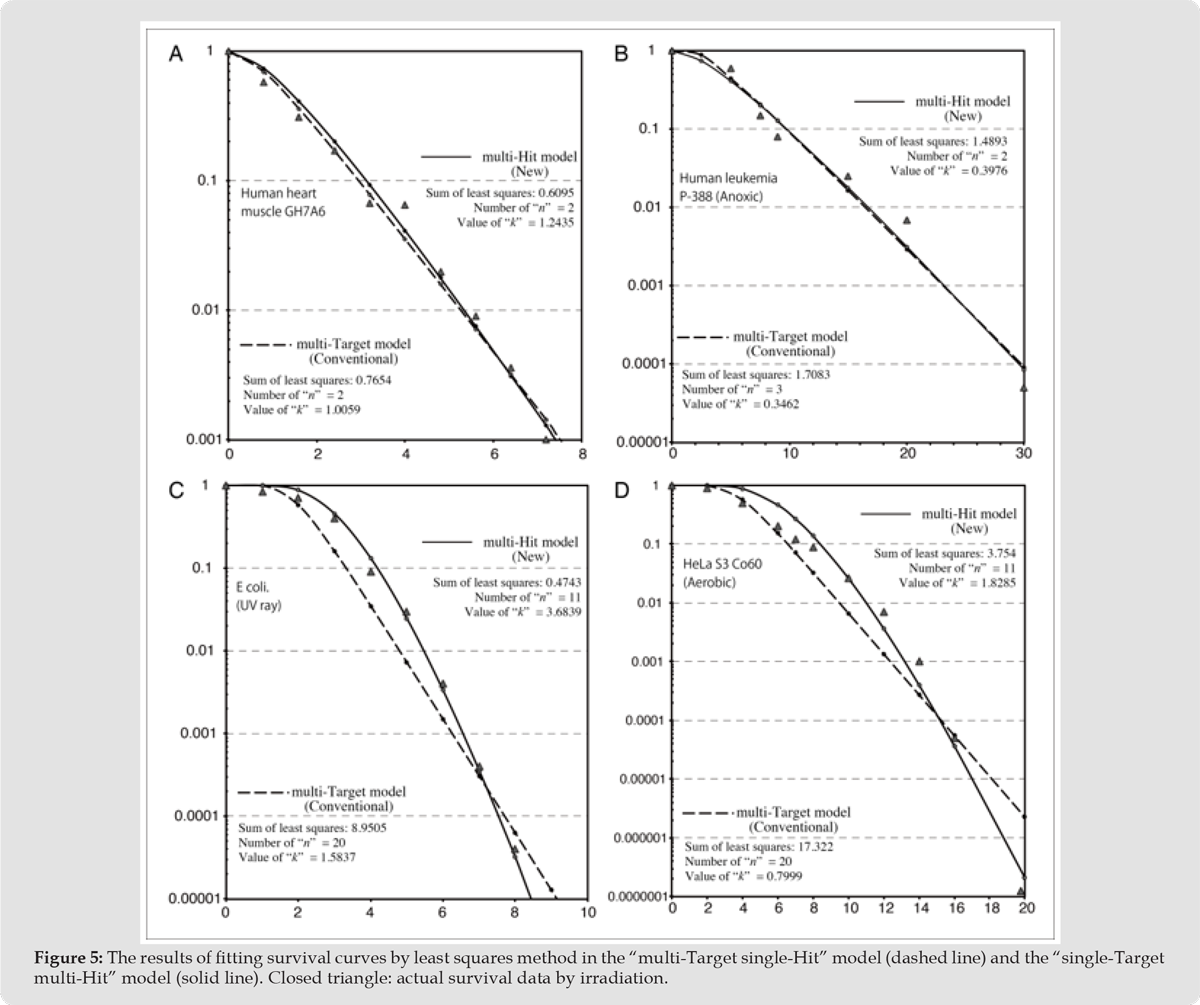
On the contrary, two sample data which showed disagreement in the fitting between the both models are also shown in Figure 5 (C & D). Whereas the survival curves of the “multi-Target” model appear to be linear shape, the survival curves of the “multi-Hit” model appear to be not linear and to show gentle curves. The “multi-Hit (new concept)” model has shown better agreement with actual survival data in middle-dose range to high-dose range than the “multi-Target (conventional)” model.
The Origin of the Model of Radiation Response in Microorganisms
Models of radiation effect to the microorganism have been studied since 1930’s or before [1, 4]. The “Target theory” had been proposed in this era, and it had been suggested that a probability of one Hit in one Target converges to the Poisson distribution which represents the probability that a phenomenon which causes averagely “x” times causes “n” times. Several similar models by irradiation experiments using bacteria have been published after that [18, 19]. With respect to the phenomenon that a probability of one Hit occurs in one Target follows the Poisson distribution, it is proven in both experiments and theory without contradiction (Appendix A). However, in case of other than the “single-Target single-Hit” model (e.g. mammalian cell lines or radioresistant microorganisms), it has not been stated which is better the “multi-Target 1-Hit” model or the “1-Target multi-Hit” model, at that time. Luria et al has proposed a kind of Target model using phage model [20]. In their study, an equation that represents survival probability [S = (1 − (1 − e−γ/n)k)n] of the sample phage has been proposed, and this equation is similar to that of the “multi-Target single-Hit” model (“conventional” target model).
Seeing their model, the sample phage consists of a certain number of specific loci each of them has independent function. When at least one of the same kind of the loci has remained active and a series of the active loci is completed, the phage survives in that model. If the characteristics of each Target and conditions for survival follow the abovementioned rule, the “multi-Target single-Hit (conventional)” model seems to be applicable to the survival data of phages like this type. However, it was not known whether the “multi-Target single-Hit” model could be optimal to survival data of bacteria or mammalian cell lines other than phage at that time.
The Concept of “Multi-Target” or “Multi-Hit” Model in the Early Stage
After the proposal of the Target theory, some cell survival curves that could not be explained by “1-Target 1-Hit” model had been observed, and afterwards, the “multi-Target” or “multi-Hit” models have been developed. The “multi-Target” model and the “multi-Hit” model should have been considered separately strictly. However, it had been proposed that calculated survival rate by the “multi-Target single-Hit (conventional)” model would converge (or be identical) to the calculated survival rate by the Poisson distribution [2]. As mentioned in the present study, the concept of Poisson distribution is applicable to the “single-Target multi-Hit” model, and the equation of the “multi-Target single-Hit” model does not have something in common with the equation of Poisson distribution (except in case of the Target number = 1). Furthermore, a paper which suggested that the “multi-Target single-Hit” model and probability of the Poisson distribution were identical has been published [21]. In the Figure 1 in that paper [21], a compound model of “multi-Target” and “multi-Hit” model was depicted, but it shows clearly separated these “multi-Target” and “multi-Hit” concepts.
However, the authors have stated that the concept of “multi-Target single-Hit” model and the concept of “single-Target multi-Hit” model (equation 1a and 1b in [21]) have been identical. As shown in Figure 3 in the present study, the equations of the two models do not become identical except in case of “n” = 1. Although there were two different concepts (the “multi-Target” and the “multi-Hit” concepts), these two different models has sometimes been confounded with each other or has been regarded as identical. It seems to be one of the reasons that only the “multi-Target single-Hit” model (conventional concept: equation (2) in the present study) has remained until now.
Extrapolation Number, DQ, D0
“Extrapolation number”, “D0” and “DQ” are referred in most of the textbooks, which explains the “Target theory” in radiation biology (Figure 6). “D0” represents the slope of the linear part of the survival curve in the conventional (“multi-Target single-Hit”) model. “Extrapolation number” is an intersecting point of extrapolated straight line of the graph of the “multi-Target” model and y axis. This value correlates with the value of “DQ (shoulder of the curve)”, and it is thought that this parameter represents the number of the Target in a single life unit. The concept of “extrapolation number” has proposed and the term has appeared around 1960 [22]. Several papers along with this concept have been published one after another, and it can be said that “extrapolation number” was a trend of radiation biology at that time [10, 23-27]. It is easy to fit the concept of the “extrapolation number” to the “conventional (multi-Target single-Hit)” target model shown as equation (1) in the present study. As shown in Figure 4A, the oblique linear part of the survival curve in the “conventional” target model is always parallel regardless of the number of “n”. And the survival curves of this conventional model represent the number of Target with “extrapolation number” or “DQ (shoulder)” and represent inherent radiosensitivity with “D0 (required dose to reduce cell population by 37%)”.
Figure 6
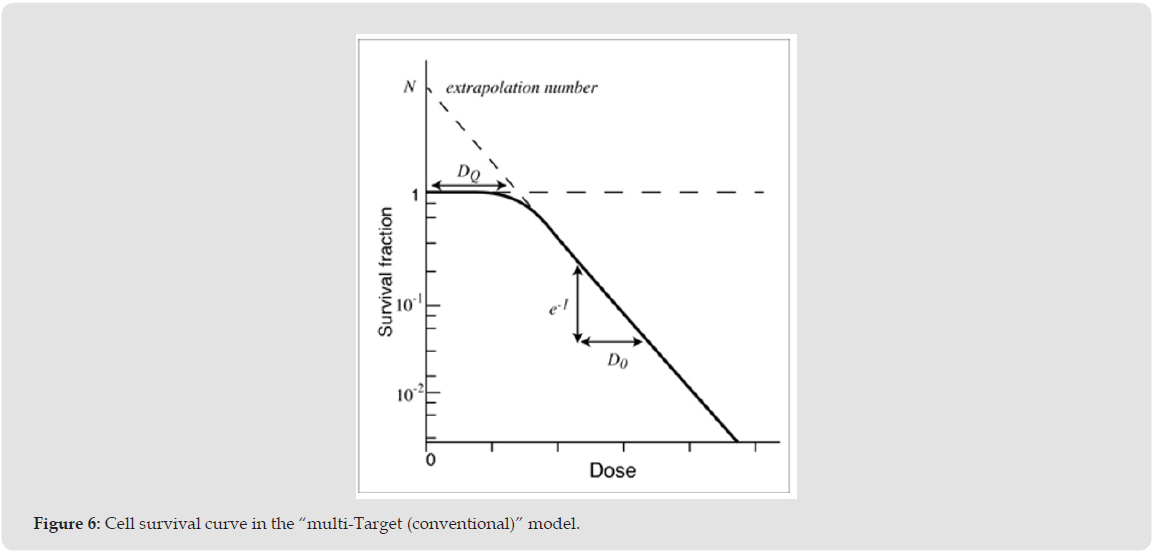
Theoretically, this conventional model can represent any type of cell lines with 2 parameters of “extrapolation number” and “D0” (whether it is optimal or not is a different matter). It can be said that this model was easy to understand the concept of radiosensitivity from these parameters. However, several researchers have suggested that this “conventional (multi-Target single-Hit)” model has not been fit to the actual cell survival data [11, 14]. Bender et al proposed an equation that (1 – (1 – e-kx)n) multiplied by (e-kx) in order to reproduce a gentle curve of the graph [11]. But newly added part of this equation seemed to have been added in order to change the appearance of the graphs, so the basis of the equation is unclear. Another researcher has also suggested that it is difficult to fit the survival curve based on the “multi-Target single-Hit” model to a certain kind of actual cell survival data that show gentle curve [14]. Additionally, the “extrapolation number” cannot be clearly calculated in the “single-Target multi-Hit (new concept)” model, because the survival curves of “multi-Hit” model shows gentle curve, so the tangent line to the graph cannot be limited to one.
From these backgrounds, it is considered that the extrapolation number has no biological significance in the “multi-Hit” model. On the other hand, one of the researchers who proposed the concept of the “extrapolation number” has proposed the concept of “multi-Hit” model [7, 26]. The researcher has suggested that survival curves based on the “multi-Hit” model can be applicable to almost all survival curves [7].
The Reasons Why the “Multi-Hit” Model Has Not Neen Established at That Time:
One of the reasons is that the “multi-Hit” model could not be applied to the concept of the “extrapolation number” that had formed a trend at that time [23-27]. As previously described, survival curves in the “single-Target multi-Hit (n > 1)” model do not show straight line like the “multi-Target single-Hit” model (Figure 3B), so the “extrapolation number” cannot be calculated. Therefore, “using extrapolation number” is equal to “adopting the multi-Target single-Hit model”. The second reason is that the “multi-Target” model and the “multi-Hit” model had been confused each other in the several studies [2, 21, 28]. Some researchers have suggested that the equations of the “multi-Target” model and the “multi-Hit” model are identical or converge to the same equation, and some researchers have cited the equations without deep investigation. Because most of the researchers in this area are a specialist in biology rather than a specialist in mathematics, there might have been less people who had completely understood the meaning of complicated equations. Dr. Fowler might have been one of the few researchers who had deep comprehension on the “multi-Target” model and “multi-Hit” model. The third reason is that the way to use the “multi-Hit” model in the practical work had not been shown. As shown in the results, the probability of each Hit cells follows the Poisson distribution.
However, we have to calculate the sum of each Hit cell fractions to estimate the survival rate in the “multi-Hit” model like equation (4), and it seemed to be a very complicated work without a computer. The present study is the first research that simplified the calculation of survival curves of the “single-Target multi-Hit” model, and is also the first research that represented the various survival curves by using minimal two parameters (“n”: the number of Hit to inactivate one Target, “k”: coefficient that represents inherent radiosensitivity). And auto calculation program with spreadsheet application is available on the internet (Appendix/unfinished). For these reasons, it is considered that the concept of the “multi-Hit” model has not been established, and the concept of the “multi-Target” model with the concepts of “extrapolation number”, “DQ” and “D0” seems to have been established and been generalized. As a point to note, the present study does not mean that the “multi-Hit” model is always more applicable to survival curves of microorganisms than the “multi-Target” model.
There seems to be some kinds of phage or microorganism, for which the “multi-Target” model is more suitable for the calculation of survival curves than the “multi-Hit” model [20, 29]. However, in the general mammalian cell lines or human cancer cell lines, the results of the present study and past studies suggested that the “single-Target multi-Hit (new concept)” model seems to be more suitable for calculating survival curves than the “multi-Target single-Hit (conventional concept)” model [7]. And the construction of a precise biological model seems to lead us to comprehension of intracellular phenomena.
Comparison With the Linear-Quadratic (LQ) Model and the Derivative Models
It is not discussed here with respect to comparison between the “multi-Hit” model and the LQ model. This is to avoid that the discussion is complicated. Similar to the comparison between the “multi-Target” model and the “multi-Hit” model in the present study, it requires to discuss the origin of the LQ model for comparison between the LQ model and the “multi-Hit” model. Due to space limitations, it is not discussed here. However, it is known that there are limits to the LQ model in low-dose (<1 Gy) rage and high-dose range (>10 Gy), hence, most of the researchers do not think that the LQ model is the final and complete model. Theoretically, the “single-Target multi-Hit” model in the present study can precisely reproduce the survival curves from low-dose range to high-dose range, and the comparison with the LQ model would be explained in the subsequent studies.
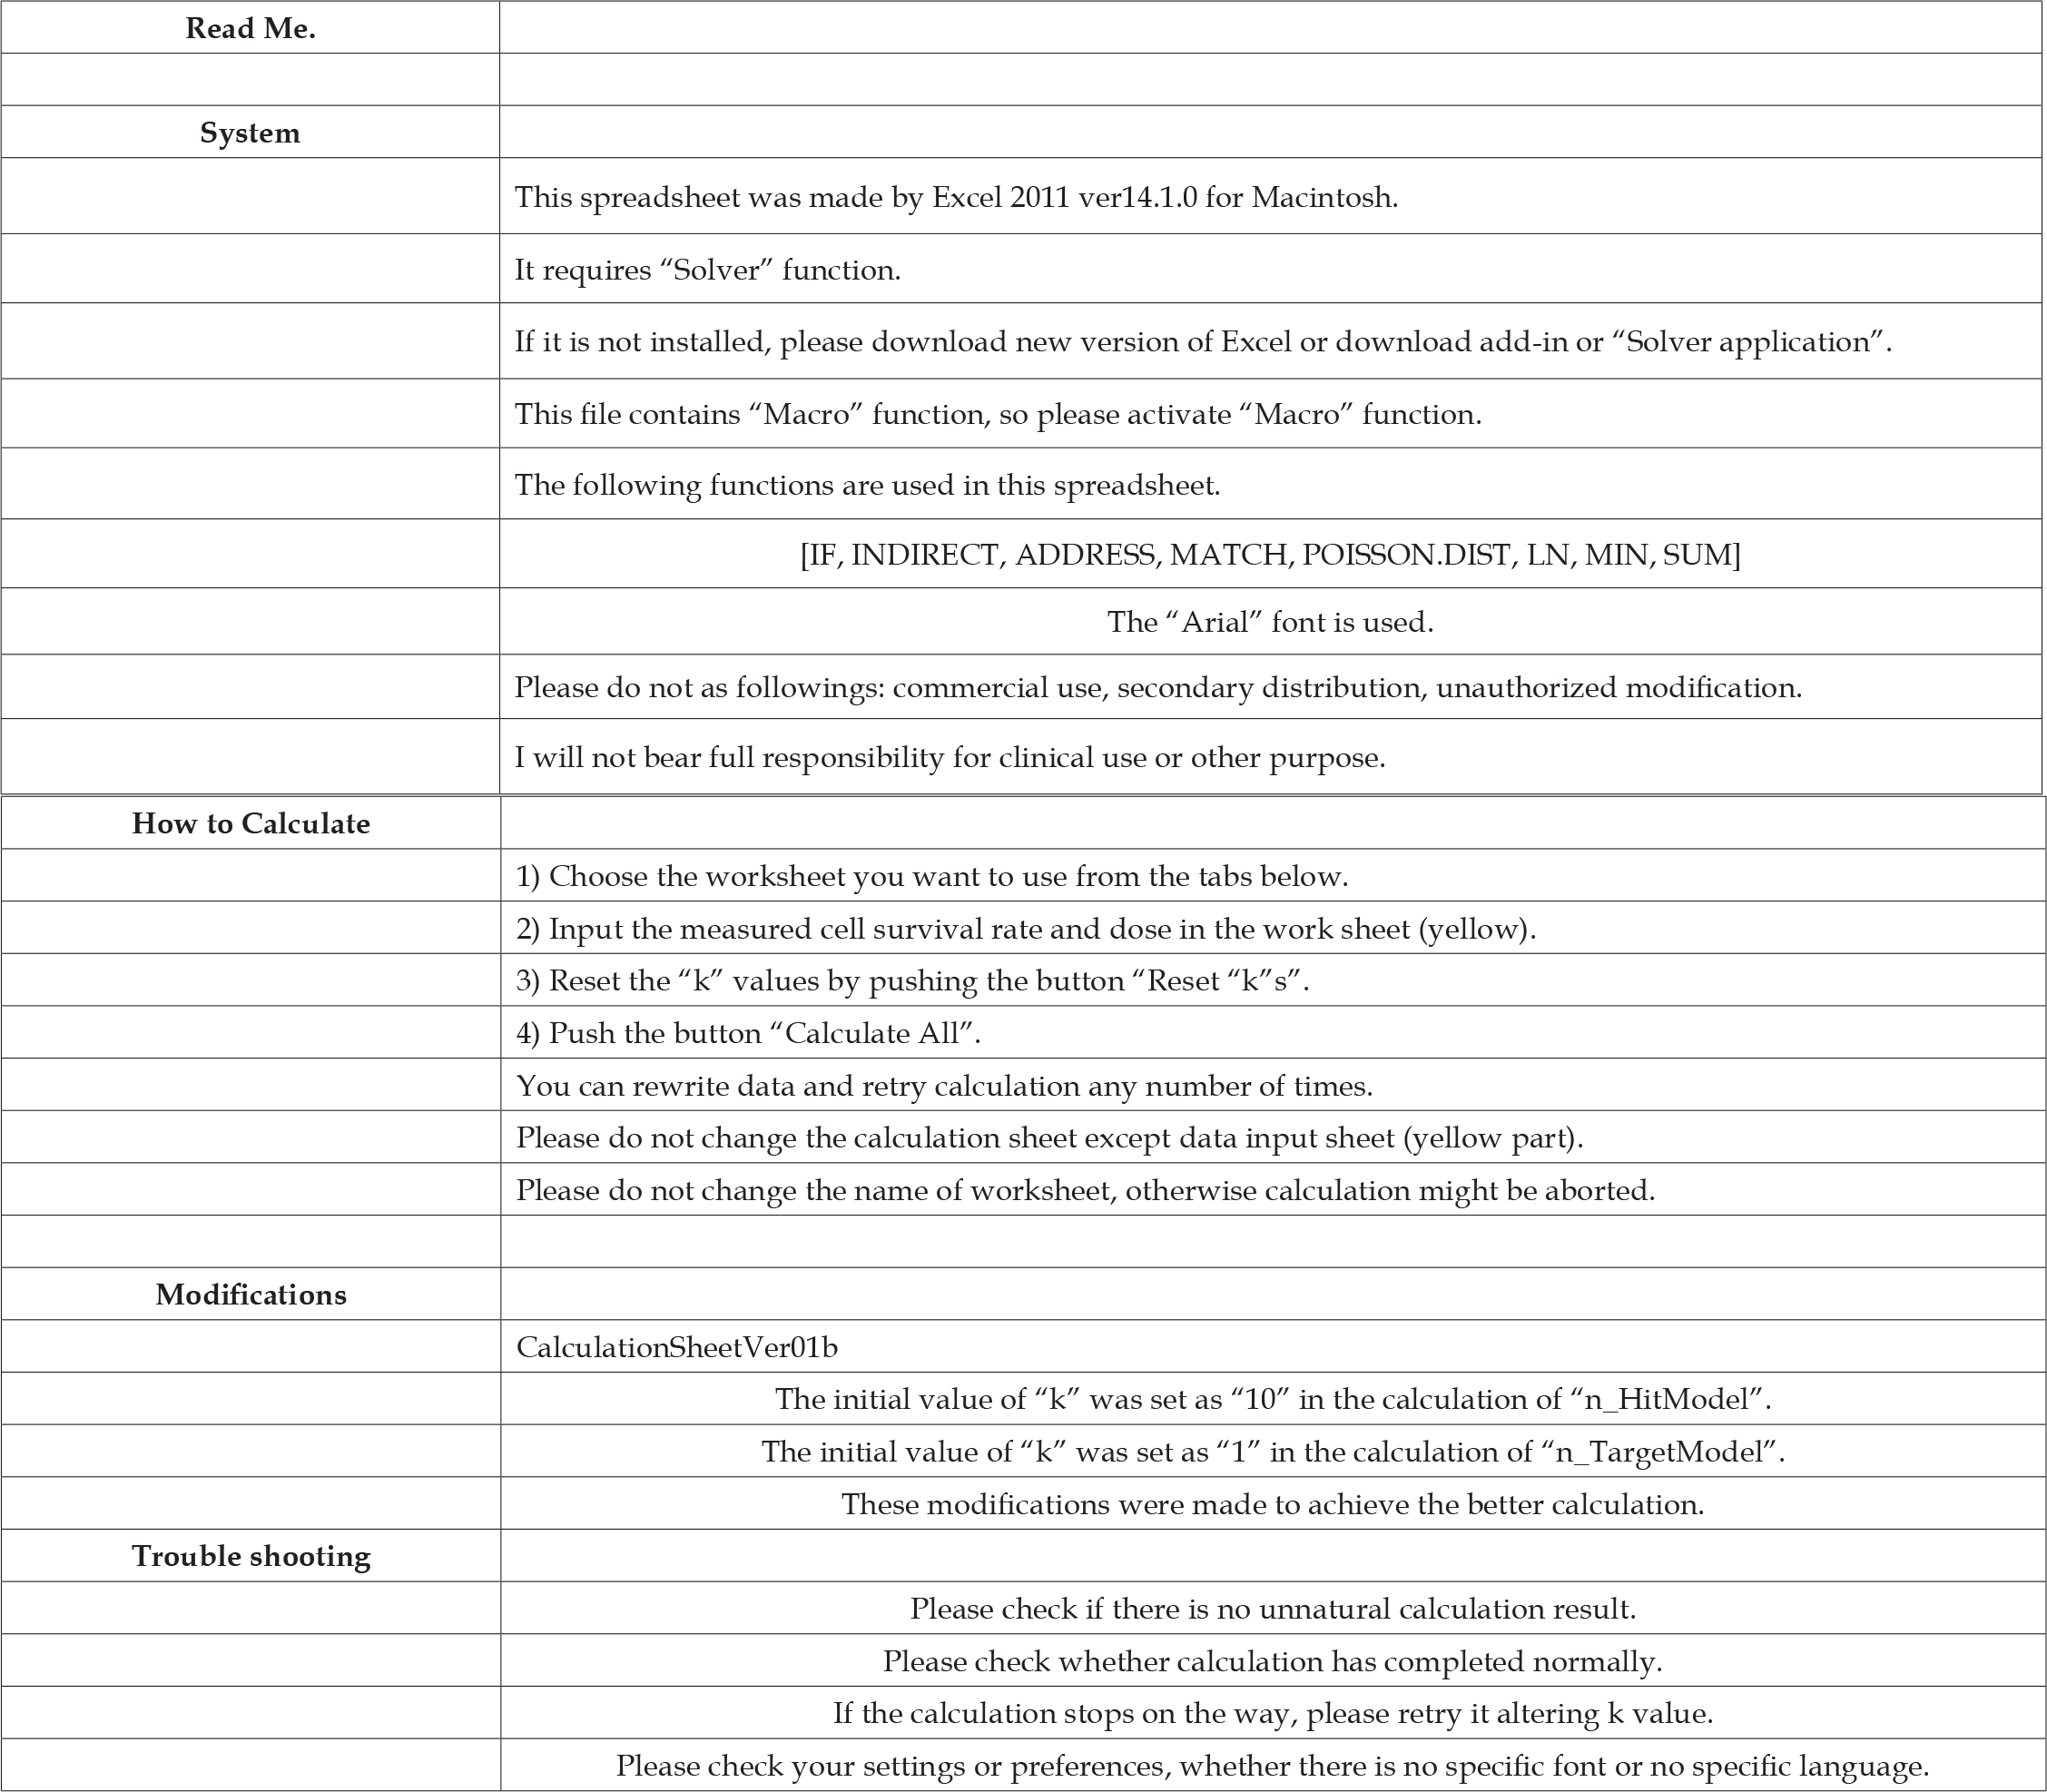
Compared to the “multi-Target” model which has been established until now, the results of this study suggested that the concept of “multi-Hit” model which has appeared once but has not established was better to fit survival curves in various cell lines or bacteria. However, some parameters such as “extrapolation number”, “DQ” and “D0” which are applied to the “multi-Target single-Hit (conventional)” model cannot be applied to the “single-Target multi-Hit (new)” model. Instead of using the parameters of “extrapolation number” or “D0”, cell survival curves were successfully reproduced by using only two variables (number of Hit “n” and coefficent “k”) in the “single-Target multi-Hit” model. This new fitting process has not been proposed in the past. The complex calculation of cell survival curves in the “multi- Hit” model has been one of the causes preventing spread. However, we produce spreadsheet application which performs auto-fitting and auto-calculation of value “n” and coefficient “k” which will enable anyone to calculate cell survival curves with only inputting survival data. Further refined cell survival model is required in the future in order to more accurately predict the effects of radiation.
Single-target n-Hit model
Click Here for Single-target n-Hit model
n-Target single-Hit model
Click Here for n-Target single-Hit model
Single-Target n-Hit model (Detailed version)
Click Here for Single-Target n-Hit model (Detailed version)

International Association of Landscape Archaeology, Czech Glass Society, Czech Republic

Department of Chemistry, Semenov Institute of Chemical Physics, USSR Academy of Sciences, Moscow, Russia

Neurology, LA BioMed Research Institute, USA

Associate Professor at Department of Breast and Thyorid Surgey, Chongqing General Hospital, China

Professor of Nuclear Medicine, Faculty of Medicine and Surgery, University of Milan, Milan, Italy





 Abstract
 PDF