info@biomedres.us
+1 (502) 904-2126
One Westbrook Corporate Center, Suite 300, Westchester, IL 60154, USA
Site Map
 ISSN: 2574 -1241
Received: October 06, 2026; Published: October 13, 2026
*Corresponding author: Amanda Chinkan Nutrition, LLC, New York, NY, USA
DOI: 10.26717/BJSTR.2026.67.010434
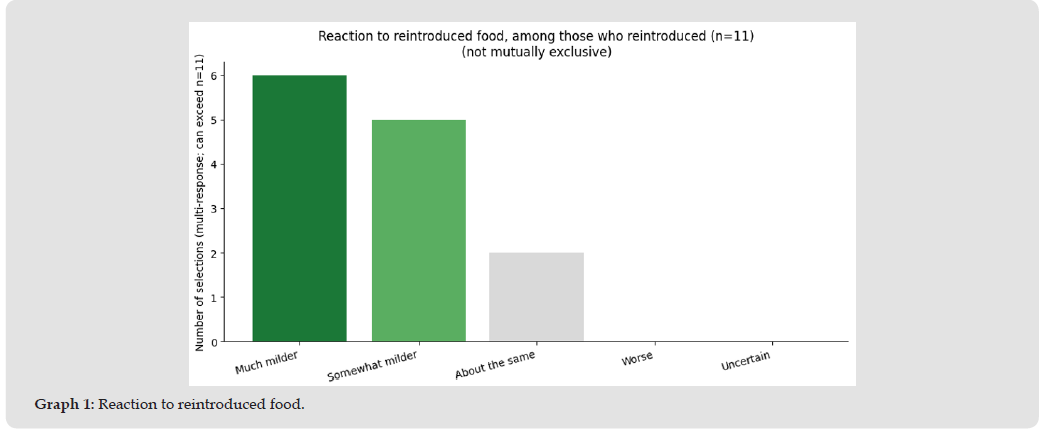
Food sensitivities and intolerances are prevalent conditions that affect 15-20% of the population. Unlike food allergies that are immune-mediated, food sensitivities or intolerances can result from non-immune, metabolic, and systemic mechanisms. Emerging research suggests that the gut microbiome and microbial metabolites such as butyrate may influence intestinal barrier function, microbial carbohydrate metabolism, and mucosal immune regulation. Anaerostipes caccae is a commensal butyrate-producing bacterium, but clinical evaluation of its use in individuals with food-related symptoms is limited. This retrospective case series evaluated 12 clients with self-reported food sensitivities, intolerances, and/or gastrointestinal symptoms despite prior dietary and lifestyle intervention. Participants took A. caccae CLB101™ once daily for 12 weeks while continuing their established nutrition and lifestyle routines. Outcomes were assessed using practitioner-developed questionnaires and participant-reported observations, including food tolerance, gastrointestinal symptoms, bowel patterns, stool consistency, and adverse effects. At the end of the study, all 12 participants completed the exit questionnaire. Eleven of 12 participants (91.7%) reported reintroducing or consuming at least one previously problematic food. Among these participants, 9 of 11 (81.8%) reported at least one milder reaction following reintroduction; 6 (54.5%) selected “much milder” and 5 (45.5%) selected “somewhat milder,” with 2 participants selecting both categories. The remaining 2 participants (18.2%) reported reactions that were about the same. No participant reported worsening reactions. Bristol Stool Form Scale patterns also shifted toward more formed stools, with Types 3–4 reported by 50.0% of participants at baseline compared with 83.3% at exit.
This case series is a retrospective review of 12 clients from Amanda Chinkan Nutrition, New York, with a variety of symptoms and medical conditions. All 12 participants presented with a common denominator – food sensitivities and intolerances and subsequent gut symptoms. In this case series, the terms “food sensitivity” and “food intolerance” are used to describe participant-reported adverse reactions to foods based on symptoms that participants tracked and reported, rather than formally diagnosed food intolerance. The adverse reactions may include gastrointestinal symptoms, skin reactions, mood changes, sleep disturbance, or other participant-specific responses. Because participants did not undergo standardized food allergy testing, oral food challenges, or diagnostic evaluation for specific food intolerances, the underlying causes of these reactions could not be independently confirmed. The study does not evaluate confirmed or formally diagnosed food allergies, but instead, it evaluates changes in self-reported food tolerance, including food-associated symptoms, following Anaerostipes caccae CLB101™ use. Food sensitivities and intolerances are complex issues stemming from multiple pathophysiological mechanisms that include immunological, metabolic, pharmacological, and functional pathways. Adverse food reactions are commonly categorized into two categories: immune-mediated (food allergy) and non-immune-mediated (food intolerance).
Immune-mediated reactions (food allergy) involve food allergy symptoms beginning when IgE antibodies recognize a food allergen and activate mast cells and basophils, causing them to release histamine and other inflammatory chemicals within minutes. Depending on how much allergen is eaten, how well it survives digestion, and how easily it crosses the intestinal barrier, the reaction may stay localized or become systemic and potentially cause anaphylaxis. Some reactions also develop hours or days later through T cells, eosinophils, and other immunological pathways, which can contribute to chronic conditions such as atopic dermatitis or eosinophilic gastrointestinal disease. IgE-mediated food allergies affect about 3% of the population [1]. Non-immune-mediated reactions (food intolerance) are more common and affect about 15-20% of the population. There are several mechanisms that may be contributing: enzyme deficiencies, such as lactase deficiency causing lactose intolerance; GLUT-5 transporter defects that can cause fructose malabsorption; poorly absorbed fermentable carbohydrates (FODMAPs) that undergo colonic fermentation causing distension, gas production and diarrhea. Non-celiac gluten sensitivity/non-celiac wheat sensitivity (NCGS/NCWS) is also relevant, but it is not a single uniform condition. Symptoms attributed to gluten or wheat may be related to fructans or other fermentable carbohydrates rather than gluten itself [2].
Many food allergies and food intolerances are influenced by the close interaction between the gut microbiome, the intestinal epithelial barrier, and the mucosal immune system. Disruption of the microbiota or barrier may impair immune tolerance to food antigens and increase susceptibility to gut reactions [3,4,5]. Similarly, non-immune food intolerance can also be influenced by microbiome and barrier- related mechanisms, for example microbial fermentation, visceral hypersensitivity, secondary mucosal injury, or altered bowel habits in addition to primary enzyme deficiency [6,7]. Xue, et al. [7] suggest that lactose intolerance may involve gut dysbiosis and altered host metabolism in addition to lactase deficiency. Their human multi-omics data and FMT animal experiment linked lactose intolerance with altered microbial composition, distinct fermentation/metabolic pathways, reduced beneficial butyrate-producing bacteria, and increased inflammatory signaling. Another important factor that can contribute to non-immune food intolerance is related to reduced digestive capacity. Pharmacologic acid suppression, such as PPIs, H2 blockers or antacids, is the biggest contributor to low stomach acid; however, any cause of hypochlorhydria, including gastritis and Helicobacter pylori, can directly impact digestive capacity [8,9]. Another factor that can contribute to food sensitivities indirectly is hormonal shift. During menopause, the rapid decline of estrogen disrupts intestinal integrity and mucosal homeostasis [10]. Hormonal decline can also affect the gastrointestinal tract indirectly through changes in the gut microbiome, including the estrobolome.
As estrogen levels fall during menopause, microbial diversity tends to decrease, beneficial bacteria such as Bifidobacterium and Lactobacillus may become less abundant, and systemic inflammation can increase [11,12].
This case series does not establish whether altered barrier function contributed to participant symptoms; however, the microbiome- barrier-immune axis provides a biologically plausible mechanism for evaluating changes in self-reported food tolerance and gastrointestinal symptoms following Designs for Health Anaerostipes Probiotic (Anaerostipes caccae CLB101™) supplementation. A previously published case report described a 47-year-old female with longstanding food intolerances and gastrointestinal symptoms who experienced improvement following 12 weeks of A. caccae CLB101™ supplementation. Her tolerance of previously reactive foods improved, and her stool microbial composition improved [13]. The present case series builds upon this preliminary single-patient observation by evaluating food tolerance, gastrointestinal symptoms, and related outcomes across a larger group of participants.
Anaerostipes caccae (A. caccae) is a spore-forming, gram-variable, rod-shaped anaerobic bacterium that is found in the human gut microbiota, primarily in the lumen of the colon [14]. A. caccae is a butyrate- producing bacterium that ferments dietary carbohydrates. It can also participate in microbial cross-feeding by utilizing lactate and acetate generated by other gut bacteria and converting these metabolites into butyrate [15-17]. Butyrate, in turn, contributes to intestinal homeostasis through its effects on the intestinal epithelium and immune system, including support of epithelial barrier integrity and regulation of immune responses [18-20].
Our current understanding of the cause of food-related symptoms may arise through immune-mediated, non-immune-mediated, or incompletely characterized mechanisms. Consequently, A. caccae may potentially be relevant across several pathways: microbial carbohydrate metabolism, epithelial barrier function, and the regulation of mucosal immune tolerance. A potential non-immune mechanism involves microbial metabolism of poorly absorbed carbohydrates. In an animal model, A. caccae increased butyrate production, which helped restore the colonic epithelial metabolic environment and microbial carbohydrate metabolism. This reduced the accumulation of poorly absorbed sorbitol in the intestinal lumen, resulting in less water being pulled into the intestinal tract, thus reducing gastrointestinal symptoms such as diarrhea.
This suggests a potential non-immune pathway through which microbial metabolism may influence certain food intolerance phenotypes, although this mechanism has not been studied in humans [21]. A. caccae may also participate in metabolic interactions occurring near the intestinal mucus layer. In vitro studies suggest that A. caccae may participate in mucin-associated microbial cross-feeding. A. caccae does not directly degrade intact mucin; however, mucin-degrading bacteria such as Akkermansia muciniphila can release acetate and mucin-derived sugars that support A. caccae growth and subsequent butyrate production [22]. Butyrate may, in turn, support intestinal barrier function by promoting mucin production, thereby contributing to regulation of epithelial permeability to food antigens [23]. This interaction shows how microbial cross-feeding may be relevant in epithelial homeostasis. Lactate utilization is a potentially relevant metabolic function of A. caccae. The bacterium has been described as a lactate-utilizing butyrate producer, capable of converting both Dand L-lactate into butyrate [15]. Excess lactate can impair mucosal barrier function and has been linked to atopic eczema in children. A. caccae can use lactate and acetate as substrates for butyrate production. This metabolic activity may influence the colonic fermentation environment, although its clinical significance for food intolerance has not yet been established [24].
A. caccae also participates in metabolic cross-feeding by utilizing substrates generated by other species of the gut microbiota. Bifidobacterium species can provide monosaccharides, lactate, and acetate that are subsequently utilized by A. caccae. In co-culture, B. infantis supported A. caccae growth and butyrate production through this exchange of metabolites [25]. In addition to these metabolic and epithelial pathways, butyrate may support immune tolerance through several complementary mechanisms [26]. As a histone deacetylase inhibitor, it can enhance acetylation of the Foxp3 locus and promote the expansion of regulatory T cells, which play a role in supporting oral tolerance to food antigens. Light and Nagler [27] further describe how microbial metabolites, together with retinoic acid and antigen presentation, support the development of intestinal regulatory T cell populations and mucosal immune homeostasis [27]. These mechanisms provide a potential link between microbial butyrate production and regulation of immune responses to dietary antigens. A preclinical study by Feehley, et al. [28] further explored the effects of A. caccae with allergic food responses. The study demonstrated that the administration of A. caccae to germ-free mice mimicked the healthy infant microbiota and prevented anaphylactic responses to cow’s milk allergen [28]. A subsequent study showed that combining the butyrate- producing bacterium A. caccae with lactulose promotes bacterial engraftment, increases intestinal butyrate production, and reduces allergic responses in preclinical models of cow’s milk and peanut allergy. This synbiotic approach seems to have an impact on the gut immune system through immune-regulatory mechanisms, including suppression of epithelial alarmin signaling, expansion of regulatory T cell populations, and reduction of IgE-secreting cells [29].
Together, the above-mentioned studies suggest several biologically plausible pathways through which A. caccae could influence food-related symptoms. These include non-immune mechanisms involving microbial carbohydrate metabolism and fermentation, epithelial and mucus-associated mechanisms related to intestinal barrier homeostasis, and immune-mediated pathways involving T cells and oral tolerance. However, these mechanisms have only been studied in vitro or preclinical models and therefore should be considered as proposed mechanisms rather than established clinical findings. Despite growing interest in various nutraceutical interventions including probiotics or butyrate-promoting supplements, case studies describing the supplementation with A. caccae and food intolerance and gastrointestinal outcomes are limited. This case series provides preliminary observational data from a practitioner-led setting and may help initiate future controlled studies examining the clinical relevance of A. caccae across different food reaction phenotypes.
Study design
Participants were clients of a New York-based practitioner. Prior to initiating CLB101™, participants either completed or actively had been completing The Great Reset program (TGR) – a nutritional and behavioral coaching group program designed by the practitioner. Participants followed whole-food dietary principles that focused on lean protein, complex carbohydrates, and healthy fat intake. TGR focused on the interventions similar to an elimination diet, involving the removal of common trigger foods: dairy, grains, beans, nuts, added sugars, highly processed foods, all oils, plus any known foods that are poorly tolerated. Depending on the participants, calorie intake, protein needs, and supplement needs were adjusted during TGR. Foods were gradually reintroduced while monitoring individual symptoms and tolerance, and the goal was to identify personally poorly tolerated foods. Baseline variability was that participants were not following identical diets at study entry. Many participants had already identified their individual food sensitivities through prior participation in TGR. TGR also focused on hydration, sleep, exercise, stress, and other lifestyle factors. Participants tracked their gastrointestinal discomfort, bloating, skin symptoms, mood changes, sleep disturbances, or other participant-specific reactions throughout the program. Despite the improvements of many unwanted symptoms, participants continued to experience food sensitivities to certain foods.
For study purposes, food sensitivity or intolerance was defined by participant-reported recurrence or worsening symptoms following the reintroduction of a food that had previously been eliminated. Symptoms included diarrhea, constipation, bloating, gas, reflux, skin rashes, itching, discomfort, pain, changes in energy levels, and brain fog. Food sensitivities were described as delayed onset of 6-72 hours after exposure to the trigger foods. As no prior clinical evaluation was conducted, the study could not determine whether a reported reaction represented immune-mediated sensitivity, carbohydrate/FODMAP intolerance or another non-immune mechanism. At the time of A. caccae initiation, participants maintained the TGR nutritional plan and did not make additional dietary modifications. Participants did not initiate new probiotics or make supplement changes. All participants were either actively participating in or had previously completed the TGR before the A. caccae intervention. Participants were eligible for inclusion if they used A. caccae CLB101™, completed baseline questionnaire data, and completed at least one follow-up questionnaire. Written informed consent was obtained from all participants prior to inclusion in the case series and for use of de-identified data. Participants were excluded if they did not provide consent, did not initiate the intervention, withdrew consent before manuscript submission, or lacked sufficient pre/post data for analysis.
Therapeutic Interventions
All clients took Anaerostipes Probiotic CLB101™ by Designs for Health at a dose of 1 capsule once daily on an empty stomach every morning over the course of 12 weeks. Participants were instructed to take the product on an empty stomach in the morning with water approximately 30 - 60 minutes before breakfast, after a bowel movement when possible. If participants did not have a bowel movement, they were instructed to take the capsule at least 30 minutes prior to breakfast. CLB101™ was the only new practitioner-directed intervention during the 12-week course. Adherence was monitored through participant self-report on study questionnaires and routine communication with the practitioner. Participants noted missed doses, temporary discontinuation of the probiotic, and subsequent resumption. Pill counts were not performed. Outcomes were assessed using practitioner- developed baseline and post-intervention questionnaires. The questionnaires were developed based upon the established gastrointestinal symptom assessment tools, including the Gastrointestinal Symptom Rating Scale (GSRS) [30], the NIH Patient-Reported Outcomes Measurement Information System (PROMIS) Gastrointestinal Symptom Scales [31], and the Bristol Stool Form Scale [32] as well as the practitioner’s clinical experience. The questionnaires used for this case series are provided as supplementary material below.
The baseline questionnaire collected demographic and clinical characteristics, medication and supplement use, food-specific reactions and avoidance patterns, gastrointestinal and extraintestinal symptoms, bowel symptoms, stool form, dietary and lifestyle factors, and digestion-related quality-of-life measures. Twenty symptom items were rated on a 0–4 severity scale, and six bowel-related items were similarly rated from 0–4. Food-specific sections assessed reported reaction severity and timing for dairy, gluten/wheat, eggs, soy, corn, nuts/seeds, FODMAP-containing foods, high-histamine foods, and other self-identified foods. The post-intervention questionnaire reassessed the same symptom and bowel domains and additionally evaluated whether participants had consumed or reintroduced previously problematic foods, the perceived severity of reactions following reintroduction, overall changes in food tolerance, and foods participants reported being able to tolerate following the intervention. Bristol stool type, dietary and lifestyle factors, and digestion-related quality-of-life measures were also collected. Questionnaire responses were evaluated descriptively by comparing baseline and post-intervention symptom severity, food tolerance, and bowel-function outcomes. Both baseline and exit questionnaires included 20 items in a 0–4 symptom-severity grid. Exploratory summed scores included 19 items grouped post hoc into gastrointestinal, food/systemic, and skin domains based on their clinical content.
The symptom-grid item labeled “overall digestive comfort” was evaluated separately and was not included in these domain scores or the 19-item total. Six bowel-function items were analyzed as a separate domain. Item scores within each domain were summed to examine changes between baseline and exit. Changes in mean domain scores were expressed as absolute differences and percentage reductions relative to baseline. The exit questionnaire also included a separate global digestive-comfort rating on a 1–5 scale, which was not used in the paired 0–4 symptom comparisons. These exploratory domain scores were not prespecified and were not derived from a validated composite scoring system. No predefined responder thresholds were applied, and participants were not classified as responders or non-responders. The analyses were descriptive, and changes were interpreted as participant-reported associations rather than evidence of a causal treatment effect.
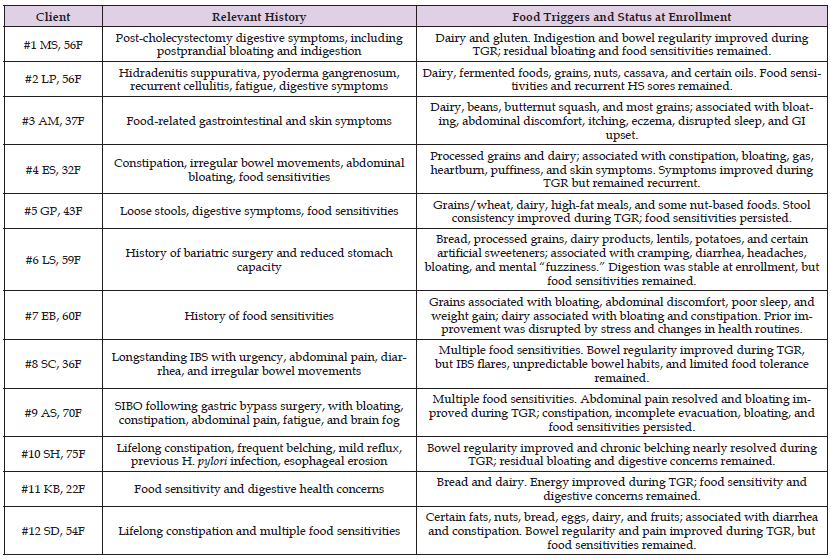
Participant characteristics, baseline food sensitivity patterns, GI symptom outcomes, Bristol stool and bowel movement patterns, adverse events, skin-related cases
Participant Characteristics
Table 1.
Table 1: CT Exam Protocol.
Baseline Food Sensitivity Patterns
Food categories assessed included gluten, dairy, eggs, soy, corn, nuts/seeds, FODMAP foods, histamine-containing foods, and other foods (Table 2). Gluten and dairy were the most frequently reported food sensitivities, each affecting 10 of the 12 participants with completed questionnaires. FODMAP-related symptoms were reported by seven participants, while six reported sensitivities to foods outside the specified categories. Soy, corn, nuts/seeds, and histamine-containing foods each affected five participants. Egg sensitivity was uncommon and was reported by only one participant.
Table 2: CT Exam Protocol.
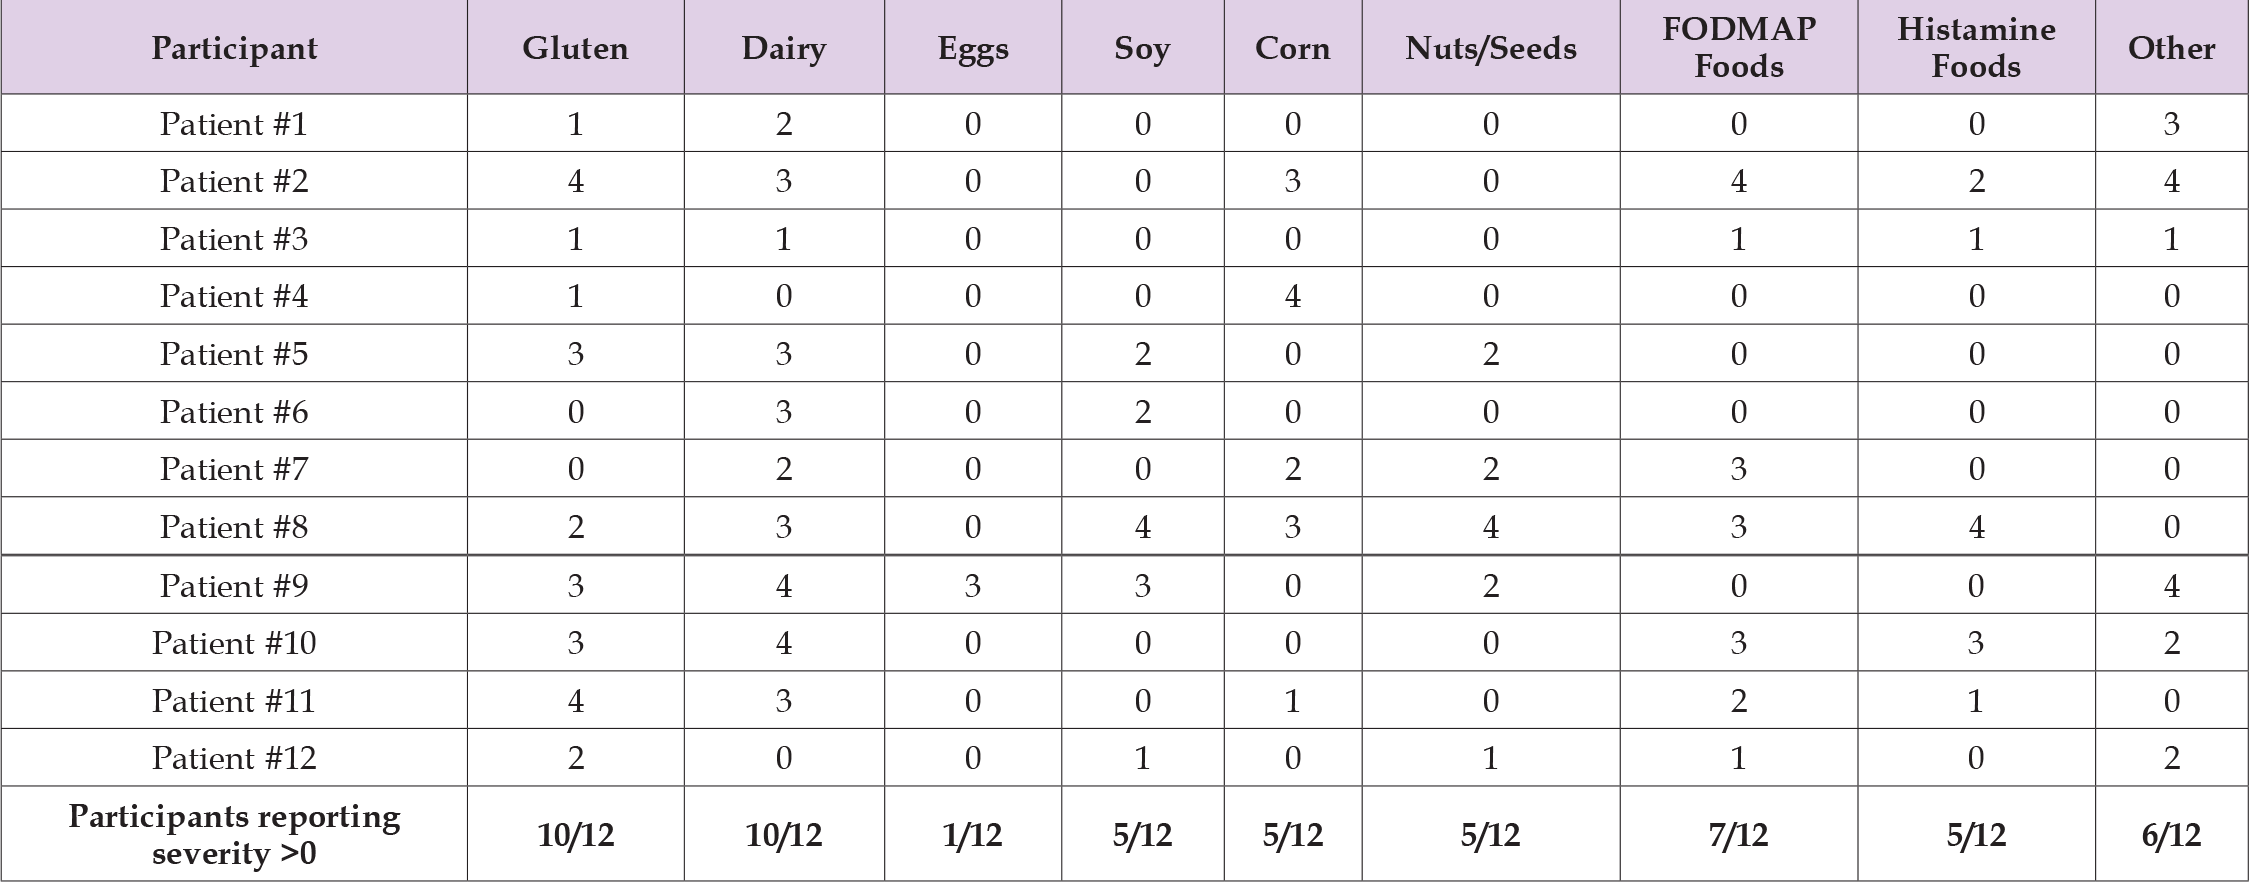
Other foods reported included:
• Client #3: sugar
• Client #5: high-fat foods
• Client #9: garlic, onion, caffeine/coffee, processed foods, high-fat foods, sauces and creams, alcohol, and eggplant
• Client #10: sugar and white-flour desserts
• Client #11: sugar
• Client #12: olive oil, avocado oil, and coconut oil
GI Symptom Outcomes
Post hoc exploratory scoring was performed for descriptive evaluation of symptom changes from baseline to exit. In the paired dataset, 12 participants had matched baseline and exit questionnaire data. Symptom severity was assessed on 0–4 categorical scales, with higher scores indicating greater symptom severity. Individual questionnaire items were grouped post hoc by clinical content into gastrointestinal, food/systemic, skin, and bowel-function domains, and item scores within each domain were summed. The mean gastrointestinal domain score decreased from 6.75 at baseline to 3.92 at exit, representing a 42.0% reduction. Nine of 12 participants had lower scores at exit, 2 were unchanged, and 1 had a higher score. The mean food/systemic domain score decreased from 10.00 to 4.75, a 52.5% reduction, with lower scores in 11 of 12 participants and no change in 1. The mean skin domain score decreased from 2.17 to 0.83, a 61.5% reduction; 7 participants had lower scores, 4 were unchanged, and 1 had a higher score. The mean bowel-function domain score decreased from 3.83 to 2.83, a 26.1% reduction, with lower scores in 6 participants, no change in 5, and a higher score in 1. Within the 0–4 symptom grid, scores for sleep disruption and the item labeled “overall digestive comfort” each decreased by an average of 1.08 points. Skin itching decreased from 1.25 to 0.33 (73.3%), diarrhea from 1.25 to 0.42 (66.7%), joint pain/body aches from 1.58 to 0.75 (52.6%), gas from 1.50 to 0.75 (50.0%), bloating from 1.42 to 0.75 (47.1%), and food-reaction severity from 1.67 to 1.00 (40.0%) Table 3.
Table 3: CT Exam Protocol.

Percentage reduction was calculated as [(baseline mean − exit mean) / baseline mean] × 100. Domain scores were created post hoc for descriptive purposes and were not derived from a validated composite scoring system.
Food Tolerance Outcomes
(Tables 4 & 5) At the end of the case study, 12 participants completed the exit questionnaire. Eleven of 12 participants (91.7%) reported that they had reintroduced or consumed at least one food that had previously been problematic. Among the 11 participants who reintroduced previously problematic foods, 9 (81.8%) reported at least one milder reaction following reintroduction. Specifically, 6 participants (54.5%) selected “much milder,” and 5 (45.5%) selected “somewhat milder.” Two participants selected both categories, resulting in 9 unique individuals reporting milder reactions. An additional 2 participants (18.2%) reported reactions that were “about the same.” Because the questionnaire permitted multiple responses, reaction categories were not mutually exclusive. No participants reported worsening reactions. One participant (8.3% of the total sample) did not reintroduce previously problematic foods and therefore could not assess changes in food tolerance (Graph 1). Counts of how many participants selected each reaction option (“much milder,” “somewhat milder,” “about the same,” “worse,” “uncertain”) after reintroducing a food item. In the free-text response section, participants described reduced bloating, indigestion, gas, and skin flares, as well as improved tolerance of foods including dairy, gluten/wheat, dietary fats, and bread in moderation. Two participants reported no overall change in food tolerance. Because food reintroduction was participant-directed rather than standardized, and participants differed in the foods and quantities reintroduced, food-specific changes should be interpreted descriptively rather than standardized challenge outcomes (Graph 2).
Table 4: CT Exam Protocol.
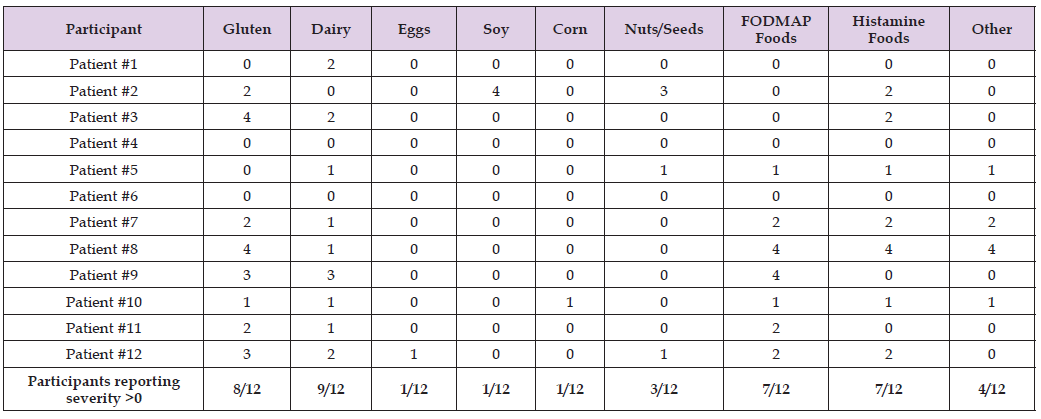
Table 5: CT Exam Protocol.
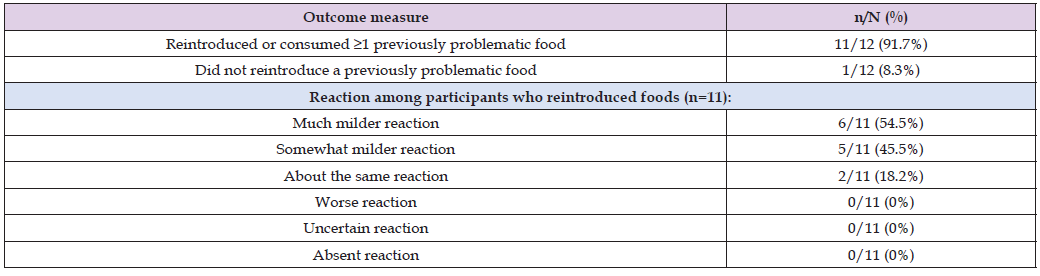
Graph 1
Graph 2
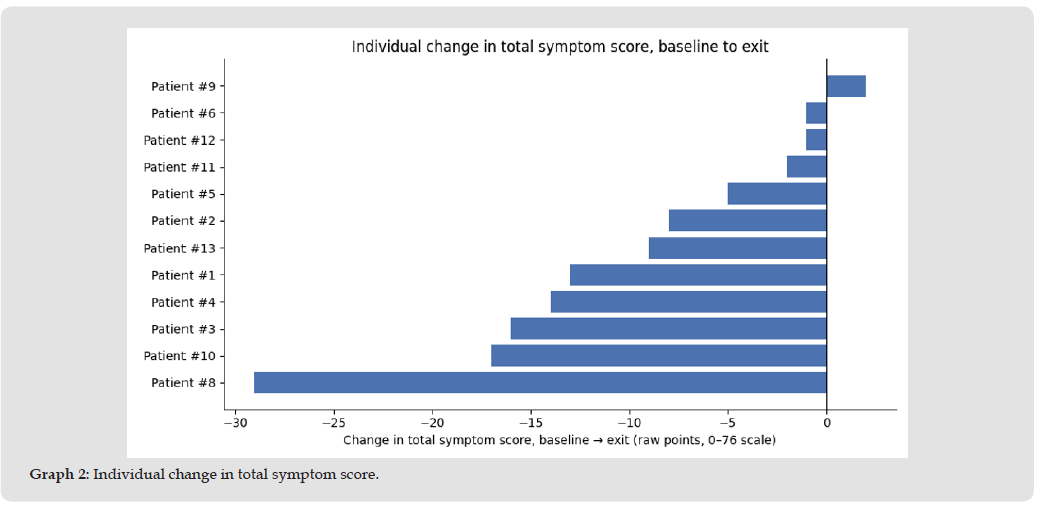
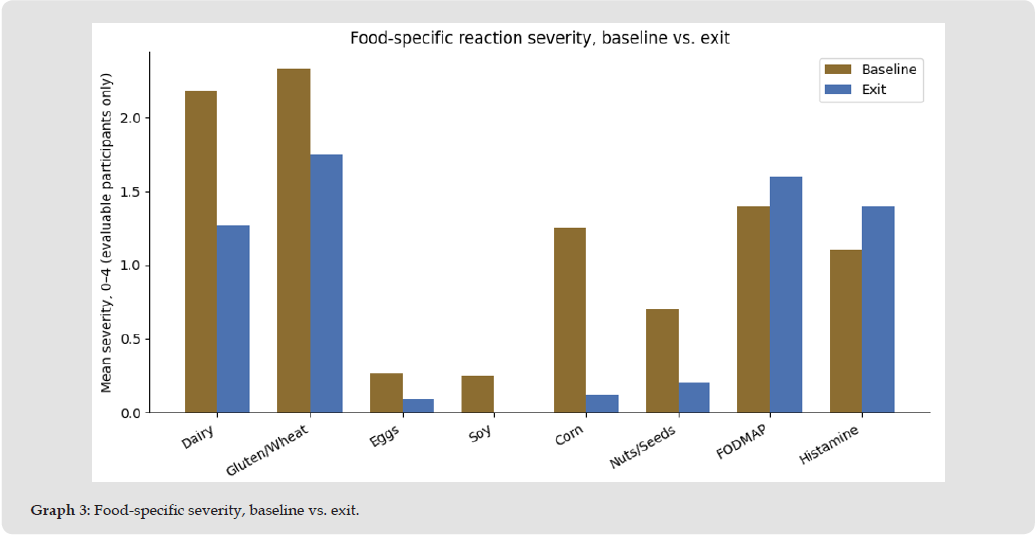
Each bar represents the change in a participant’s 19-item symptom total, calculated as the exit score minus the baseline score. Negative values indicate lower symptom scores at exit, whereas positive values indicate higher scores. No predefined responder threshold was applied (Graph 3). For each food (dairy, gluten/wheat, eggs, soy, corn, nuts/seeds, FODMAP, histamine), average reaction severity baseline vs. exit — but only counting participants who actually ate that food at exit. Anyone who didn’t eat a given food is left out of that food’s bars entirely, so an empty/low bar never gets misread as “improvement” even though it was just non-exposure.
Graph 3
Bristol Stool and Bowel Movement Patterns
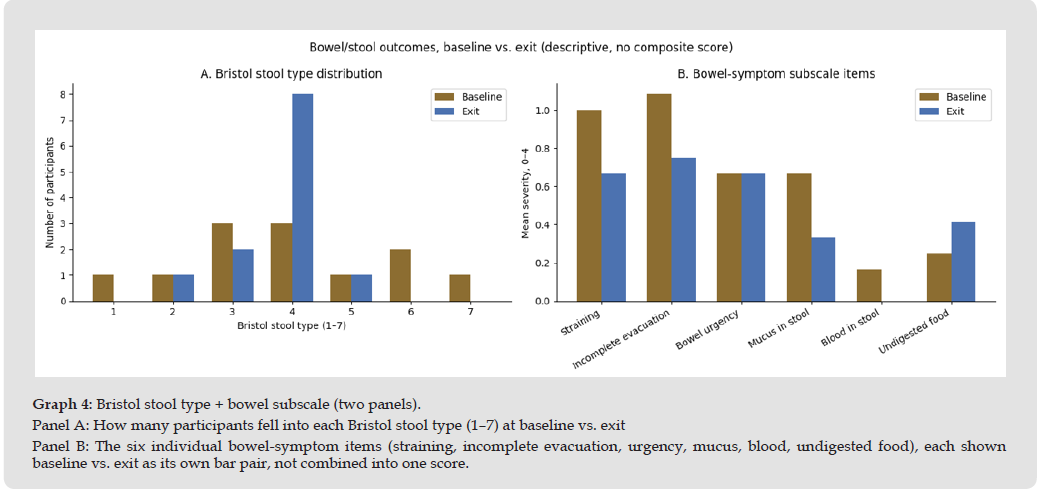
At baseline, stool consistency was variable across participants, presenting both constipation and loose stool patterns (Bristol stool type varied from Type 1 to 7). Among the 12 participants, 6 reported Type 3-4 stools, which are generally considered more formed stool patterns and a representation of good gut health. The remaining participants reported stools outside this range, including 2 with harder Type 1-2 stools and 4 with looser Type 5-7 stools. By the exit questionnaire, stool consistency shifted toward Type 3-4 in most participants. 10 of 12 participants reported Type 3 or 4 stools at exit, while only 1 participant reported Type 2 and 1 participant reported Type 5. This represents an increase from 50% of participants reporting Type 3-4 stools at baseline to 83.3% at exit. Overall, the pattern suggests improvement toward more formed and regulated stool consistency by the end of the 12-week intervention (Graph 4).
Graph 4
Adverse Events
No adverse effects were documented in the questionnaire data.
Highlighted Skin-Related Cases
Client #2 (LP): Client #2 had a history of hidradenitis suppurativa with persistent recurrent lesions. At initiation of A. caccae CLB101™, a mons pubis lesion had remained recurrent for approximately 9 months despite prior interventions. During the 12-week intervention, the client reported progressive improvement, with the lesion becoming nearly healed and no longer painful, swollen, or bleeding by study completion. Because the client continued other treatments, including Tremfya and her established supplement regimen, the observed improvement cannot be attributed solely to CLB101™.
Client #12 (SD): The client entered the study with persistent food-associated itching and rashes. During the 12-week A. caccae CLB101™ intervention, she reported progressive improvement in itching and skin reactions. After discontinuing CLB101™, itching and changes in stool consistency reportedly returned; following resumption, bowel patterns normalized and the itching and rashes again improved. This temporal pattern is hypothesis-generating but does not establish causality.
The current results suggest that 12 weeks of A. caccae supplementation was associated with participant-reported improvements in overall food tolerance in the majority of participants. Participants’ phenotypes were heterogeneous: food reactions and symptoms occurred due to dairy, grains, FODMAP-type foods, fats, nuts, and other foods. Gastrointestinal symptoms included bloating, diarrhea, constipation, and abdominal discomfort; skin reactions included itching and eczema, while sleep disturbance and brain fog were reported, as well. After the intervention, 11 of 12 participants (91.7%) reported reintroducing or consuming at least one food that had previously been problematic. Among these participants, 9 of 11 (81.8%) selected at least one response indicating a milder reaction following reintroduction. Six participants (54.5%) selected “much milder” and 5 (45.5%) selected “somewhat milder,” while 2 (18.2%) reported that reactions were about the same. Because participants could select more than one response category, these percentages were not mutually exclusive. No participant selected “worse,” and 1 participant did not reintroduce a previously problematic food and therefore could not assess a change in tolerance. It is important to note that food reintroduction was participant-directed rather than standardized, and the foods and quantities consumed varied between participants. Along with improvements in symptom scores, Bristol stool chart comparison also showed a positive shift.
The proportion of participants reporting Bristol Stool Form Scale Types 3–4 increased from 50.0% at baseline to 83.3% at exit, suggesting a movement toward more formed stool patterns over the intervention period. In addition, 2 participants with notable pre-existing skin manifestations reported improvement during the intervention; however, these observations remain exploratory because of concurrent treatments and the observational nature of the case series. Because food-reaction phenotypes were heterogeneous, and no chemical biomarkers were used as a baseline, microbial metabolism, epithelial and barrier integrity, and immune-regulatory pathways should be considered as biologically plausible hypotheses rather than established evidence. Microbial metabolism is probably the plausible mechanism to be relevant to the participants whose symptoms were predominantly gastrointestinal. One possible explanation is A. caccae-mediated changes in microbial carbohydrate metabolism and butyrate production, which might influence the amount and type of substrates available in the colon and thereby alter the metabolic environment.
This is particularly relevant to participants reporting reactions to FODMAP-type foods, grains, sugars, or other carbohydrates. Another plausible mechanism is that A. caccae could potentially influence barrier integrity indirectly by supporting butyrate production. Butyrate is involved in mucus and barrier homeostasis, which in turn, can contribute to a more stable intestinal environment and altered sensitivity to potentially triggering foods. Lastly, the participants with skin manifestations may have involved an immune component. In a preclinical model, A. caccae has been shown to prevent anaphylactic responses to cow’s milk allergen. In addition, combining the butyrate-producing bacterium A. caccae with lactulose promoted bacterial engraftment, increased intestinal butyrate production, and reduced allergic responses in preclinical models of cow milk and peanut allergy. This approach plausibly modulates immune regulatory mechanisms, including suppression of epithelial alarmin signaling, expansion of regulatory T-cell populations, and reduction of IgE-secreting cells.
This case study is a retrospective observational case series. The study has a small sample size and no control group presented. No validated or standardized objective markers were used in the assessment. Because TGR recommendations were individualized and participants entered the intervention at different stages of the program, dietary and lifestyle exposures were not standardized, which should be acknowledged when interpreting changes during A. caccae supplementation. Participants also completed TGR before CLB101™, so CLB101™ was not tested as a stand-alone intervention. The case series also relies on self-reported food tolerance and symptoms. Placebo and expectancy effects cannot be excluded without a blinded, placebo-controlled study.
Food sensitivities and intolerances involve intricate physiological processes that encompass both immune-mediated and non-immune- mediated responses. Potential mechanisms include alterations in digestive function, microbial carbohydrate metabolism, intestinal barrier integrity, and immune regulation. This case series investigated the use of A. caccae in individuals with food sensitivities and intolerances. Among the 12 participants who took the probiotic, improvements were reported in several gastrointestinal symptoms, with skin-related improvements also reported in some participants. The case series has several limitations, as discussed above, and these observations do not establish causality or clinical efficacy. However, the reported improvements warrant further investigation and controlled studies to evaluate the potential role of A. caccae in improving food tolerance and gastrointestinal symptoms.
All participants provided written informed consent prior to inclusion in this retrospective case series, including consent for the use of their de-identified data and publication of the case-series findings.
Conflict of Interest
Anastasia Dosov and Amber Reed are Clinical Education Interns at Designs for Health, Inc. Oscar Coetzee serves as Vice President of Clinical Education and Practitioner Support at Designs for Health, Inc.
Funding and Product Support
This case series received no external grant funding. The investigational product, Anaerostipes caccae CLB101™, was provided by Designs for Health, Inc., representing in-kind product support.
Data Availability
The datasets analyzed in this case series, such as deidentified questionnaire responses, are available from the corresponding author on reasonable request.
Acknowledgment
Special thanks to Sahana Prakash for data analytics and statistical evaluations.
Baseline and Exit Questionnaires for CLB101™ Case Series
Reformatted from Google Forms for manuscript submission; participant responses removed.
Copyright pending. Reproduced with permission from Amanda Chinkan Nutrition.
Common response scales used in the questionnaires
Table 1:
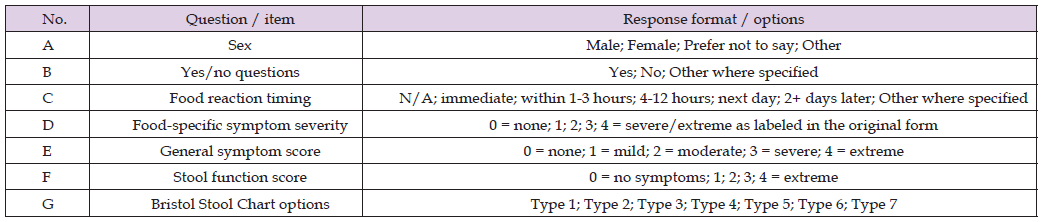
Supplementary Material 1. Baseline Questionnaire
Copyright pending. Reproduced with permission from Amanda Chinkan Nutrition.
Original instruction: Use this form to track your changes over the next 3 months. Asterisks in the original form indicated required questions
(Table 2).
Table 2:
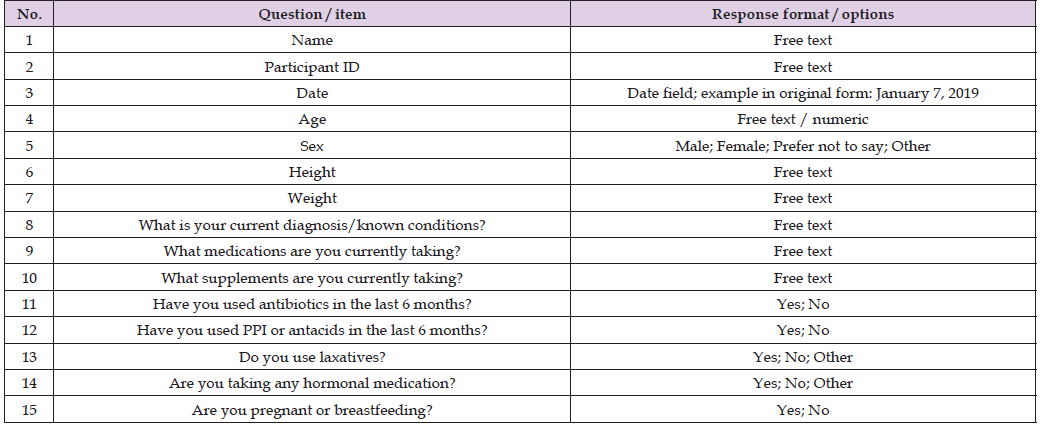
Section 2. Why are you Trying Anaerostipes?
Table 3:

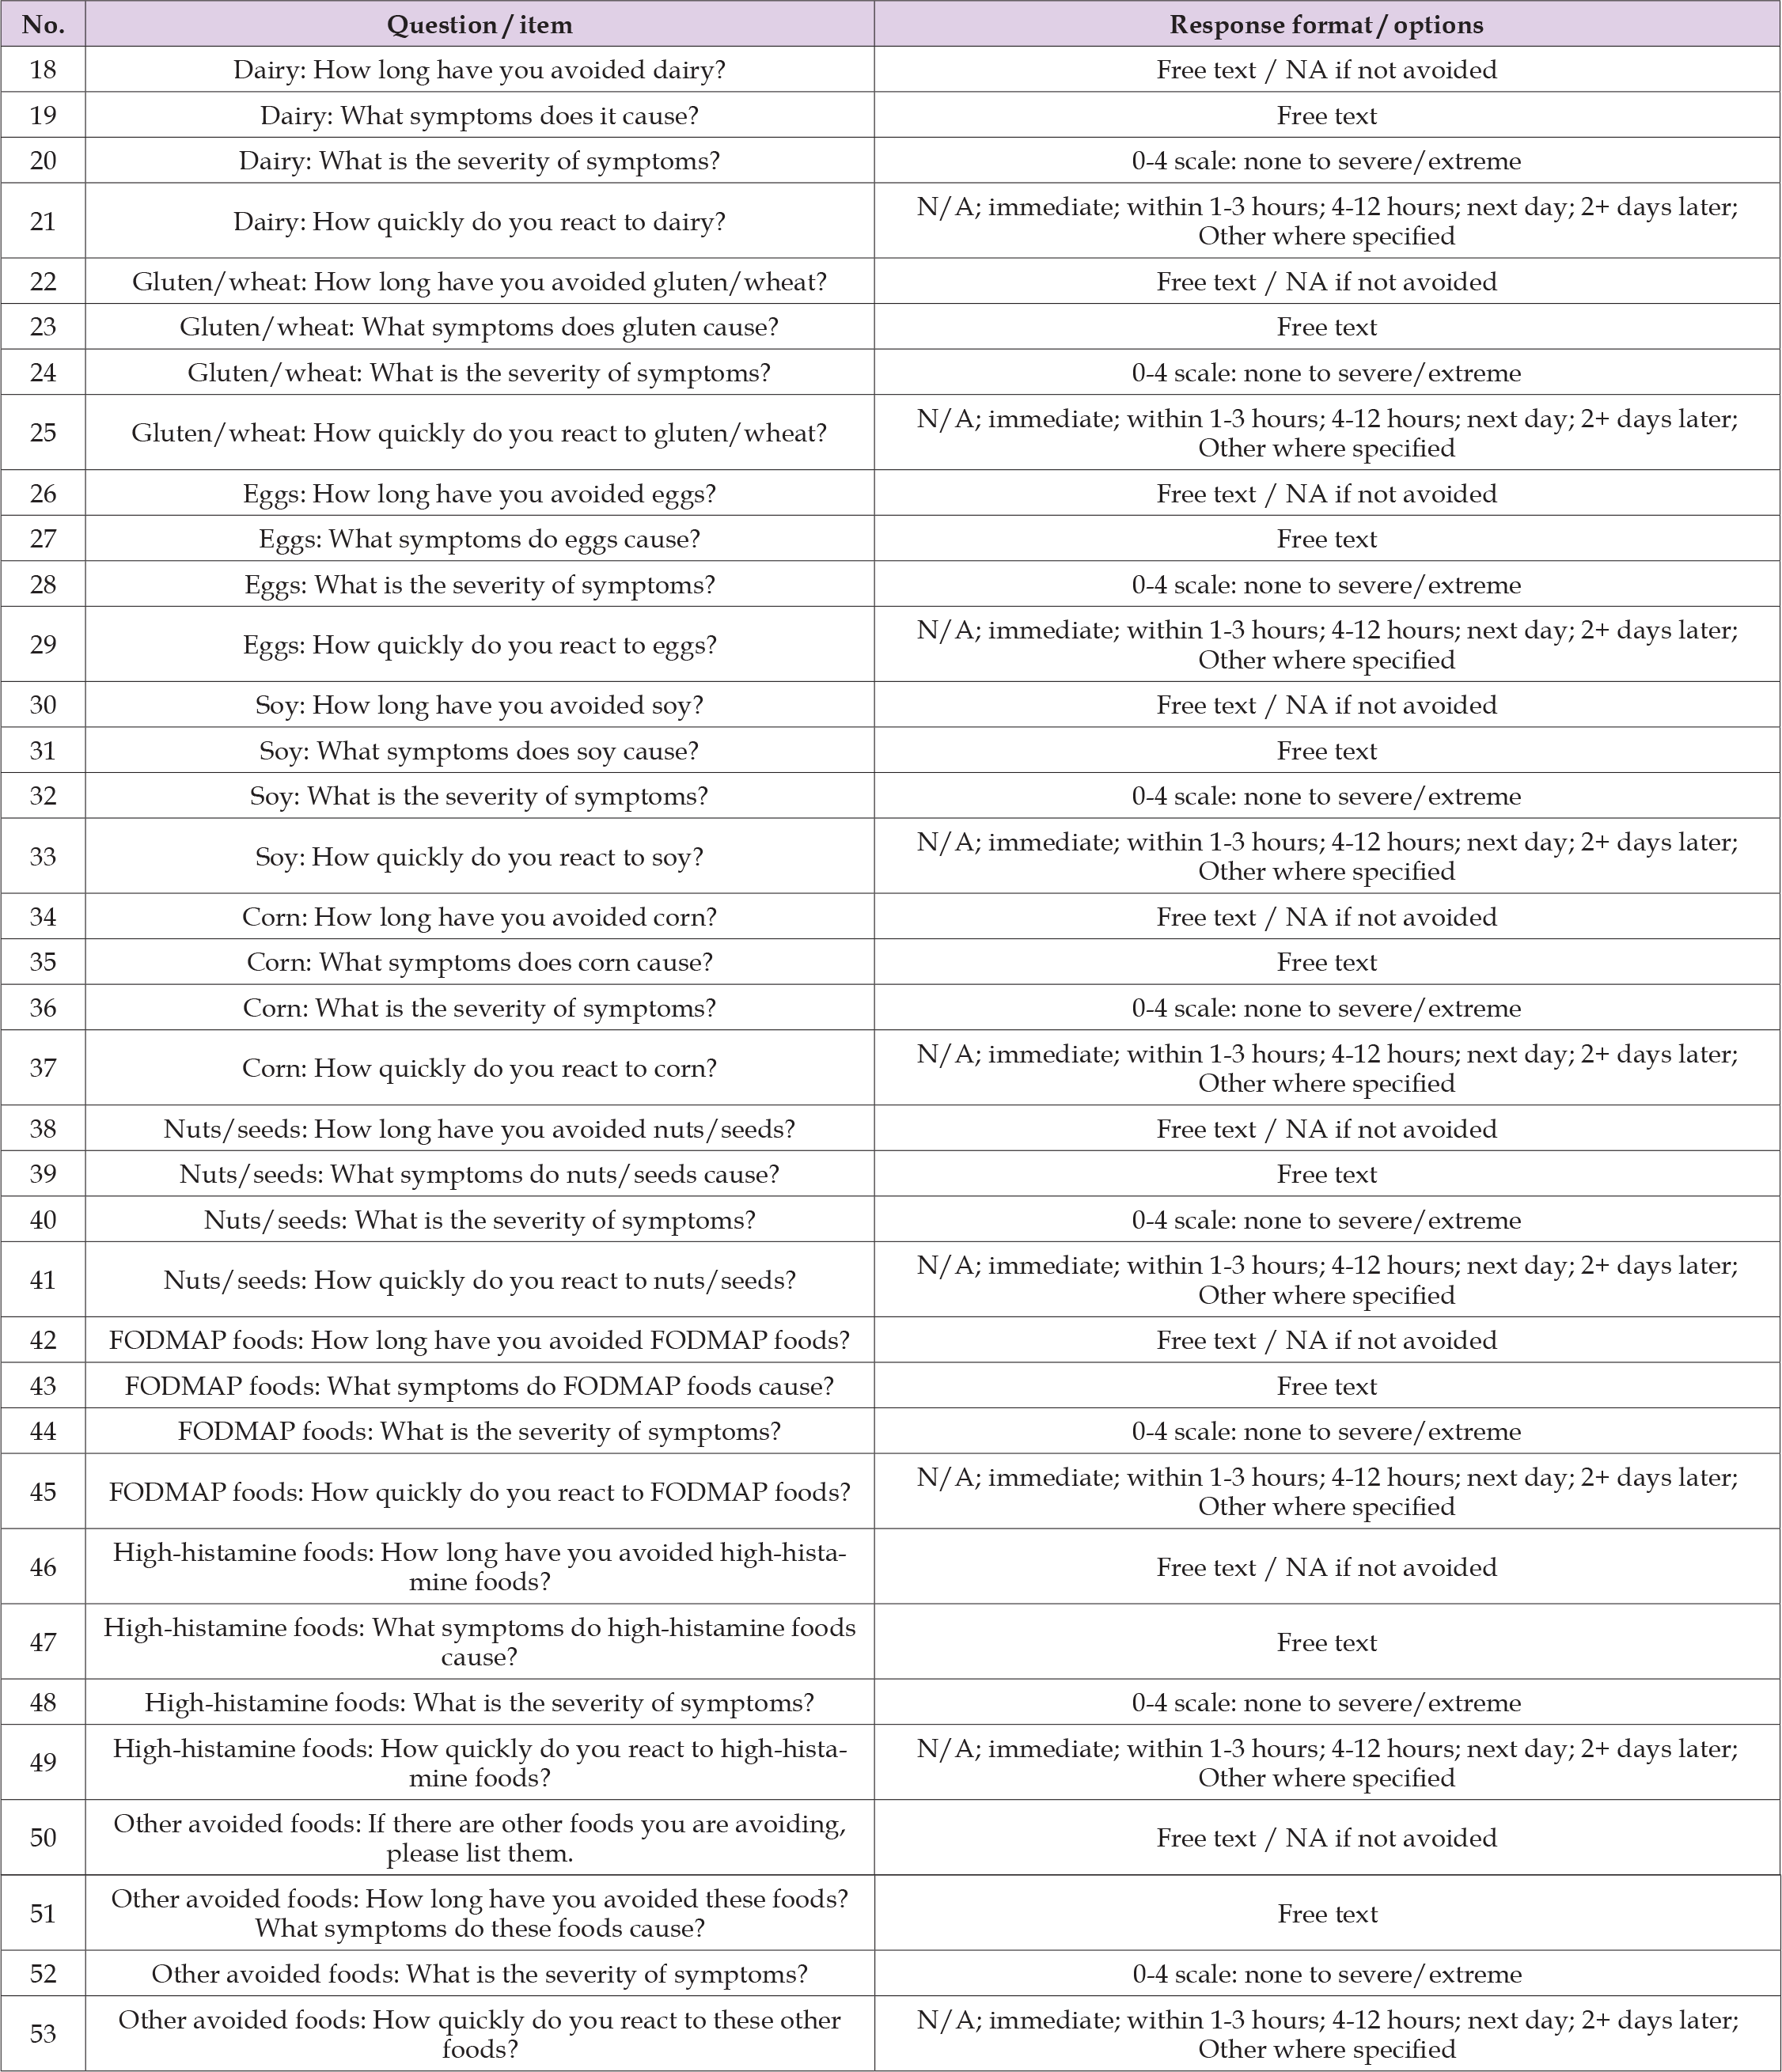
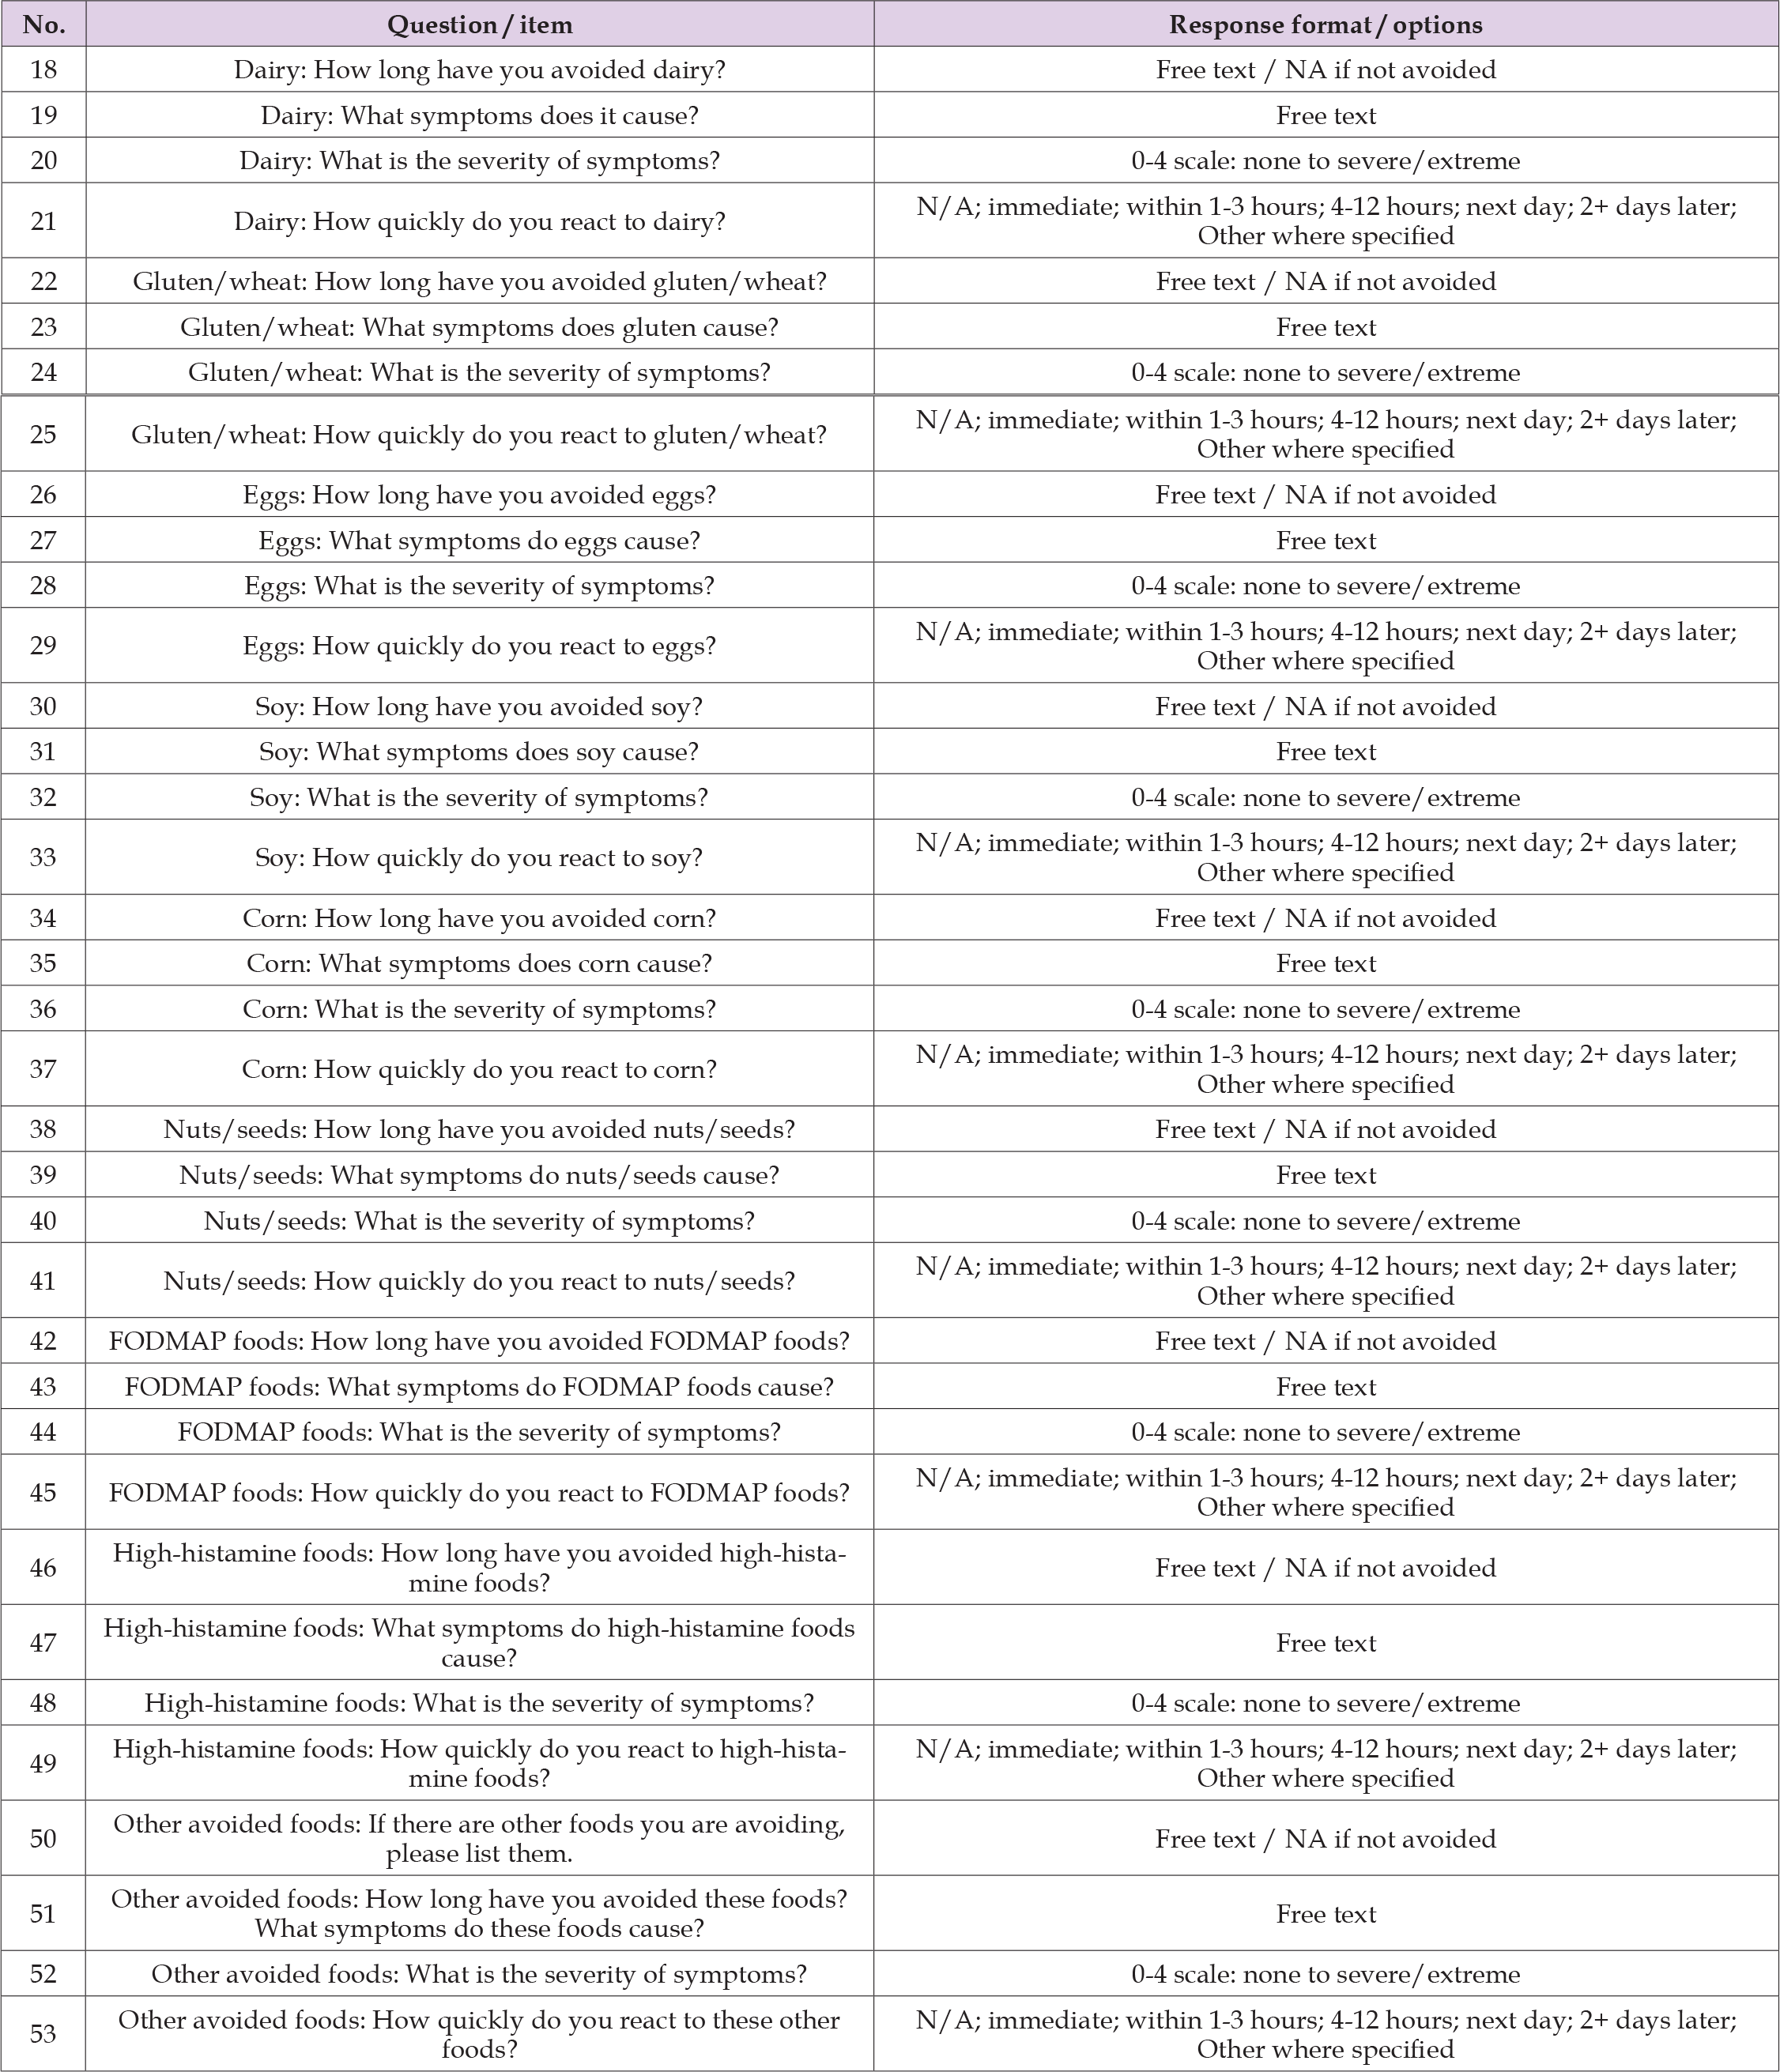
Section 3. Food intolerance profile
Original instruction: If you do not avoid a particular food please write NA. Reference charts for FODMAP foods and high-histamine foods were included in the original Google Form Table 4.
Table 4:
Section 4. Symptom Score - Past 7 Days
Table 5:

Section 5. Stool Function
Table 6:

Section 6. Diet and Confounders
Table 7:
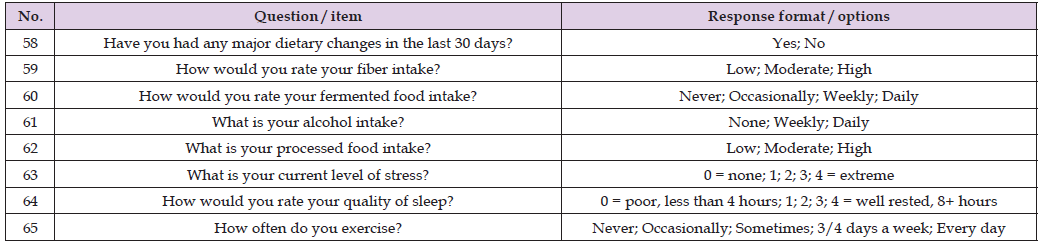
Section 7. Quality of Life
Table 8:
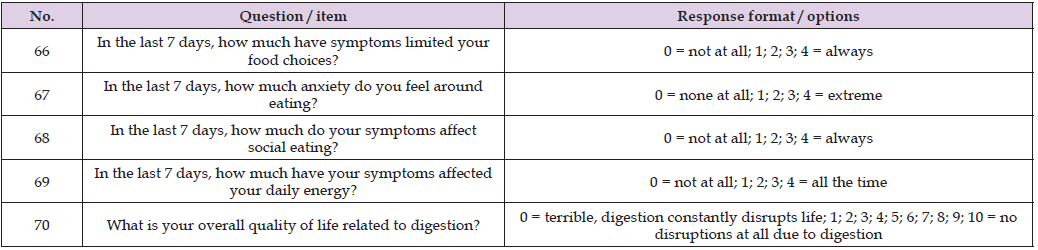
Copyright pending. Reproduced with permission from Amanda Chinkan Nutrition.
Original instruction: Use this form to track your changes over the next 3 months. Asterisks in the original form indicated required questions.
Section 1. Participant Information and Recent Medication/Supplement Context
Table 9:
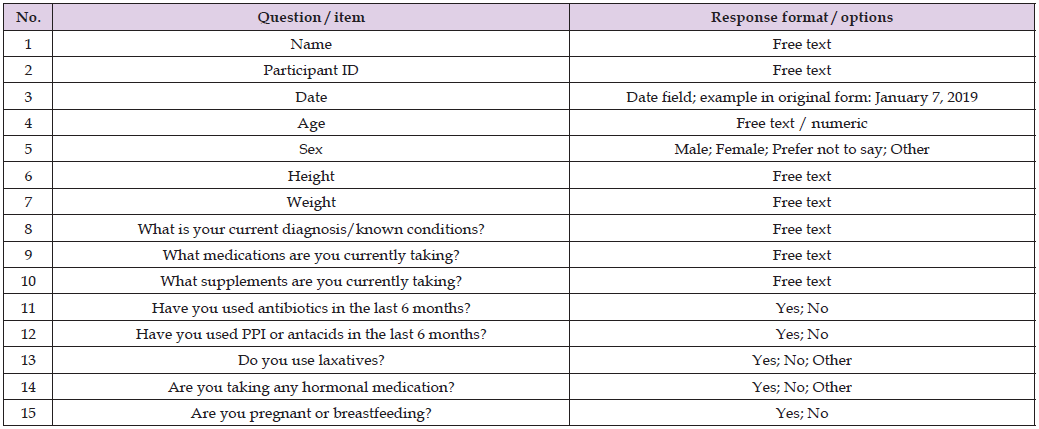
Section 2. Overall Health After Completing the Anaerostipes Intervention
Table 10:

Section 3. Food Intolerance Profile After the Intervention
Original instruction: If you do not avoid a particular food please write NA. Reference charts for FODMAP foods and high-histamine foods were included in the original Google Form Table 11.
Table 11:
Section 4. Symptom Score - Since Completing the Anaerostipes Study
Table 12:

Section 5. Stool Function - Since Completing the Anaerostipes Study
Table 13:

Section 6. Diet and Confounders
Table 14:
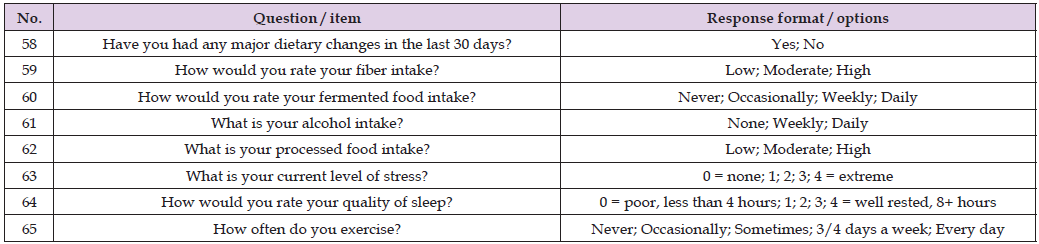
Section 7. Food Reintroduction and Digestive Comfort Outcomes
Table 15:
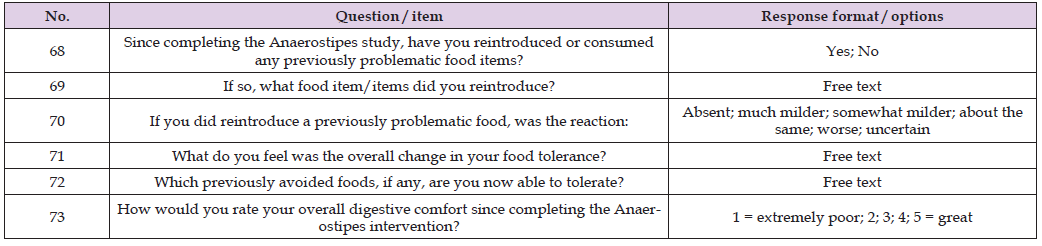
Section 8. Quality of Life
Table 16:


International Association of Landscape Archaeology, Czech Glass Society, Czech Republic

Department of Chemistry, Semenov Institute of Chemical Physics, USSR Academy of Sciences, Moscow, Russia

Neurology, LA BioMed Research Institute, USA

Associate Professor at Department of Breast and Thyorid Surgey, Chongqing General Hospital, China

Professor of Nuclear Medicine, Faculty of Medicine and Surgery, University of Milan, Milan, Italy





 Abstract
 PDF