info@biomedres.us
+1 (502) 904-2126
One Westbrook Corporate Center, Suite 300, Westchester, IL 60154, USA
Site Map
 ISSN: 2574 -1241
Received: September 08, 2026; Published: September 24, 2026
*Corresponding author: Kübra YILMAZ, Product Development Senior Specialist, Research and Development Center, World Medicine İlaç San. ve Tic. A.Ş., İstanbul, Türkiye
DOI: 10.26717/BJSTR.2026.66.010401
Regorafenib monohydrate is a poorly water-soluble multikinase inhibitor whose tablet performance may be influenced by formulation composition and manufacturing history. This descriptive industrial case study compared five polyvinylpyrrolidone-based formulation-process combinations prepared by spray drying (three trials) or hot-melt extrusion (two trials). Initial dissolution was assessed in pH 4.5 acetate buffer containing 0.1% sodium dodecyl sulfate at 10, 15, 20, 30, and 45 min. Dissolution efficiency over 0-45 min (DE₀–₄₅) and the interpolated time to 85% release (t₈₅) were calculated from the reported mean profiles. One lead candidate from each route was evaluated during six months of accelerated storage at 40 ± 2°C/75 ± 5% relative humidity at laboratory and pilot-production levels. Spray-dried Trial 3 showed the fastest initial release, reaching 96.05% at 30 min, with a DE₀–₄₅ of 60.27% and an estimated t₈₅ of 26.7 min. Hot-melt-extruded Trial 5 was the best extrusion candidate, reaching 89.50% at 30 min, with a DE₀–₄₅ of 54.97% and an estimated t₈₅ of 28.7 min. At month 6, the selected spray-dried candidate retained higher absolute 30-min dissolution and showed lower water content and lower measured total related substances in both laboratory and pilot-production batches. Its proportional dissolution loss was not consistently smaller, indicating that initial performance margin and storage-related change should be interpreted separately. Apparent assay values decreased during storage, but the magnitude of the decrease was not quantitatively reconciled with measured related substances; assay trends were therefore interpreted descriptively and were not used as sole evidence of chemical degradation. Within the evaluated systems, the spray-dried candidate showed the more favourable integrated descriptive profile. The results do not establish a general superiority of spray drying or an amorphous mechanism, but support an integrated candidate- selection strategy combining dissolution profile shape, moisture behaviour, measured related substances, assay interpretation, and pilot-production consistency.
Keywords: Regorafenib Monohydrate; Spray Drying; Hot-Melt Extrusion; Drug–Polymer Dispersion; Dissolution Efficiency; Accelerated Stability
Regorafenib is an orally administered multikinase inhibitor that targets angiogenic, stromal, and oncogenic signalling pathways [1]. Its clinical value was established in metastatic colorectal cancer, gastrointestinal stromal tumours, and hepatocellular carcinoma through the CORRECT, GRID, and RESORCE phase 3 programmes [2-4]. The marketed product contains 40 mg regorafenib per film-coated tablet and is administered with a light meal, reflecting the practical importance of controlling oral exposure for a low-solubility compound [5,6]. The active substance is used as a defined monohydrate, and the originator patent landscape describes both the solid-state form and a coated composition intended to improve product performance [7,8]. These disclosures indicate that the physical form of regorafenib and the architecture of the drug-polymer system are integral to product design. Amorphous solid dispersions are frequently used to generate supersaturation for poorly soluble drugs, although dissolution is only one step in the biopharmaceutical sequence. Regorafenib-specific work has shown that precipitation from povidone- or hypromellose acetate succinate-based dispersions may generate different crystalline or amorphous phases depending on the medium and polymer [9]. Povidone also altered one amorphous co-precipitation pathway, illustrating that polymer selection may influence both initial release and the phases formed after dissolution.
The enabling effect of a polymeric dispersion is better understood as a sequence of events than as a single increase in equilibrium solubility. Rapid liberation of a high-energy drug phase may create a transient supersaturated “spring”, whereas the polymer and surfactant influence whether this state is maintained, undergoes liquid–liquid phase separation, or collapses through nucleation and crystal growth. Consequently, the clinically relevant attribute is not necessarily the highest early percentage dissolved, but the concentration–time history available to drive absorption [10,11]. Broader evaluations of amorphous solid dispersions have similarly shown that dissolution medium, sink status, polymer dissolution, particle size, gastrointestinal physiology, and the selected reference material can materially change the relationship between in vitro release and systemic exposure [12]. Moisture represents a second critical variable. Spray-dried regorafenib- povidone dispersions have been reported to develop drug enrichment at the particle surface after humidity exposure, together with weakening of drug-polymer interactions at high relative humidity [13]. More broadly, surface-sensitive and water-assisted phase-behaviour studies have demonstrated that drying trajectory, surface heterogeneity, and water uptake may alter dissolution and storage behaviour even when bulk tests suggest a single amorphous phase [14,15]. These findings make water content and surface composition relevant considerations when interpreting finished-tablet stability.
Povidone is attractive as a dispersion polymer because of its rapid hydration and potential for drug–polymer interactions, but its hygroscopic character also creates a stability trade-off. Sorbed water can reduce the effective glass-transition temperature, increase molecular mobility, and permit local phase rearrangement before bulk crystallinity becomes evident. In spray-dried systems, these changes may be concentrated at high-energy particle surfaces, where modest changes in composition can alter wetting, nucleation, and chemical microenvironment. Water content, surface composition, physical state, and dissolution should therefore be interpreted together rather than as independent quality attributes [13-15]. Spray drying and hot-melt extrusion can produce broadly similar drug-polymer systems through fundamentally different physical histories. Spray drying removes solvent rapidly from atomised droplets, whereas hot-melt extrusion combines heat, shear, pressure, residence time, and subsequent milling. Comparative studies have reported both comparable molecular interactions and product performance [16] and route-dependent differences in morphology, flow, compression, dissolution, or physical stability [17-20]. In vitro and in vivo comparisons also indicate that a technology switch between the two routes should not be assumed to preserve product performance without direct comparability testing [19].
A 2025 model-system study reported higher intrinsic dissolution after spray drying but greater resistance to recrystallisation after hotmelt extrusion, further showing that neither route is universally superior [20]. Each manufacturing route also creates distinct particle-level and downstream-processing attributes. Spray drying can generate porous, high-surface-area particles with rapid wetting, but product performance may depend strongly on solvent selection, feed-solids concentration, droplet drying kinetics, collection efficiency, and residual solvent. Hot-melt extrusion avoids a solvent-removal step and may promote intensive drug–polymer mixing; however, thermal and shear exposure, residence-time distribution, die cooling, and post-extrusion milling can influence degradation risk, density, particle-size distribution, flow, and compactability. Comparative studies indicate that similar bulk solid-state signatures do not necessarily produce equivalent powder, tablet, dissolution, or stability behaviour [16-20]. Surfactants may further modify this process signature by improving wetting, increasing apparent solubilisation, altering drug-polymer- surfactant interactions, and affecting component distribution during drying or extrusion. Their effect cannot be interpreted independently of concentration, polymer grade, drug loading, particle morphology, and dissolution conditions. A surfactant-containing quality-control medium may be useful for discriminatory formulation screening, but it may also reduce the visibility of precipitation, supersaturation loss, or permeability-limited behaviour that becomes important under gastrointestinal conditions.
These considerations create an industrial decision problem with several dimensions. A candidate may provide a high initial release value but show a narrow stability margin; another may release more slowly yet display a smaller proportional loss during storage. Likewise, lower water content may be favourable, but its mechanistic meaning depends on the analytical method, packaging system, polymer moisture, and physical state of the intermediate. Candidate selection should therefore distinguish absolute performance, change from baseline, analytical uncertainty, and reproducibility of the process response. The present work therefore did not ask whether one platform is categorically superior. It examined whether the evaluated formulation- process combinations generated distinguishable performance patterns during tableting, accelerated storage, and pilot production. Recent bioequivalence studies show that generic regorafenib tablets can achieve comparable systemic exposure under fasting and fed conditions [21,22]; however, those findings do not establish equivalence for the formulations studied here. The working hypothesis was that manufacturing history would influence the balance among release rate, moisture uptake, assay behaviour, measured impurity formation, and pilot-production response.
The specific objectives were: (i) To compare the initial mean dissolution profiles of five formulation- process combinations;
(ii) To calculate DE₀–₄₅ and t₈₅ as complementary profile metrics;
(iii) To compare six-month water content, apparent assay, 30- min dissolution, and total related substances for the selected spray-dried and hot-melt-extruded candidates;
(iv) To examine whether the laboratory ranking was maintained during pilot production; and
(v) To define the analytical and experimental work required before causal process or bioavailability conclusions could be made.
Study Design and Data Provenance
This study was conducted as a retrospective, descriptive analysis of archived industrial formulation-development and stability records generated during routine research and development. The dataset included formulation compositions, selected process windows, batch-level mean dissolution values, and summary stability results. Individual-unit analytical results and replicate-batch variance estimates were not available for the present analysis. Assay and related substances were determined using internally validated, stability-indicating chromatographic procedures. Detailed chromatographic conditions and validation documentation are proprietary and are therefore not reproduced. Measured findings were separated from mechanistic hypotheses, and only transparently calculable descriptive metrics were derived.
Materials
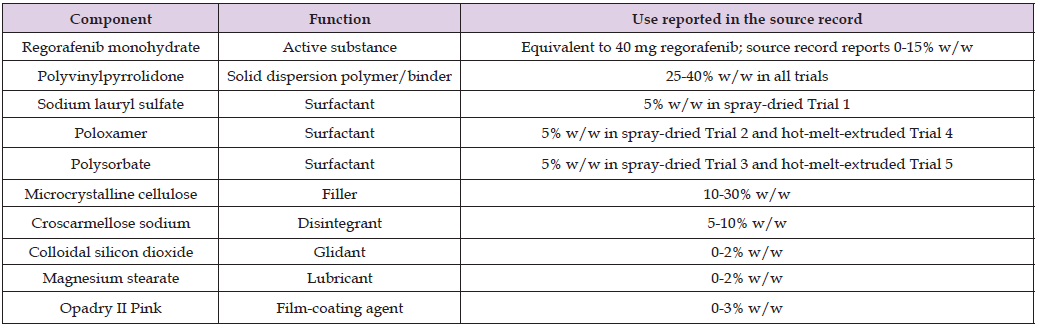
Regorafenib monohydrate was obtained from MSN. PVP and poloxamer were supplied by BASF; polysorbate by Croda; SLS by Huntsman; microcrystalline cellulose and croscarmellose sodium by DuPont; colloidal silicon dioxide by Evonik; magnesium stearate by Peter Greven; Opadry II Pink 85F240091 by Colorcon; and acetone by Merck. Materials complied with the applicable European Pharmacopoeia requirements. Commercial excipient grades were selected according to approved internal material specifications (Table 1).
Table 1: Formulation components and use in the development programme.
Formulation Design
Five development trials were evaluated. The three spray-dried trials contained sodium lauryl sulfate, poloxamer, or polysorbate, whereas the two hot-melt-extruded trials contained poloxamer or polysorbate. PVP was the common drug–polymer matrix former. Because surfactant identity and manufacturing route varied together in parts of the screening design, the study compares integrated formulation- process combinations and does not claim an isolated causal effect of manufacturing route or surfactant identity. For the stability comparison, Trial 3 and Trial 5 were designated as the lead spraydried and hot-melt-extruded candidates, respectively, because each produced the highest reported 30-min dissolution within its manufacturing- route group. This selection was performance-led within the archived screening dataset rather than the result of a prospective factorial design. The choice does not establish that surfactant identity or process route was the sole cause of the observed ranking (Table 2).
Table 2: Manufacturing route and surfactant screening design.

Spray-Drying Process
The laboratory batch size was 0.460 kg per 1,000 tablets. Regorafenib monohydrate, PVP, and the selected surfactant were dissolved in acetone and purified water at a reported ratio of 70:30. The feed was filtered through a 0.45 μm membrane and spray-dried using an inlet-temperature range of 100–120°C, an outlet-temperature range of 50–60°C, full aspirator setting, a pump setting of 5–10% (approximately 3–6 mL/min), a 0.7 mm twin-fluid nozzle, and an atomisation- gas flow of 400–600 L/h. Intermediate moisture content was targeted at not more than 2%. Additional equipment-specific operating details and manufacturing yields are proprietary and are not reproduced. The reported operating ranges represent the process window used during development. Feed-solids concentration, droplet-drying kinetics, product temperature, atomisation conditions, and collection behaviour may influence particle porosity, residual solvent, surface composition, and the physical state of the drug–polymer intermediate.
Hot-Melt Extrusion Process
The laboratory batch size was 0.460 kg per 1,000 tablets. Hotmelt extrusion was performed at a screw-speed range of 100–150 rpm and a feed-rate range of 2–5 kg/h, with sequential barrel-zone ranges of 60–80, 90–110, 110–130, and 130–150°C. The recorded processing time was 2–3 min, and the extrudate was milled or sieved through a 0.5–1.0 mm aperture. Equipment-specific screw geometry, torque, die pressure, specific mechanical energy, and manufacturing yield are proprietary and are not reproduced. The extrusion process window defines the combined thermal and mechanical history of the material. Screw configuration, fill level, residence-time distribution, actual melt temperature, cooling conditions, and milling energy may influence mixing, thermal exposure, particle architecture, and the degree of drug–polymer contact.
Final Blending, Compression, and Film Coating
The spray-dried or extruded intermediate was sieved and blended with microcrystalline cellulose, croscarmellose sodium, and colloidal silicon dioxide, followed by lubrication with magnesium stearate. Tablets were compressed at a reported target weight of 300-500 mg and compression force of 8-20 kN. Friability was targeted below 1%, and weight deviation was targeted within ± 5%. Core tablets were film-coated with Opadry II Pink using an inlet temperature of 55- 65°C, a tablet-bed temperature of 40-45°C, and an atomisation pressure of 1.5-2.5 bar.
Powder Flow
Final blends were evaluated using Carr index and Hausner ratio calculated from bulk and tapped densities. Approximately 15% Carr index and 1.18 Hausner ratio were observed for both process groups. These values were used as descriptive indicators of blend flow.
Dissolution Testing and Profile Metrics
Dissolution was evaluated using an internally qualified development procedure in pH 4.5 acetate buffer containing 0.1% sodium dodecyl sulfate (SDS; also referred to as sodium lauryl sulfate, SLS) at 10, 15, 20, 30, and 45 min. The archived specification identified Q = 80% at 30 min. Candidate screening additionally considered the margin above 85% at 30 min. The same procedure was applied to all comparative batches. Detailed operational parameters of the internal procedure are proprietary and are not reproduced; the reported values are batch-level mean profiles and are not presented as formal pharmacopoeial stage-compliance data. The surfactant-containing medium was used as a discriminatory development screen. The resulting profiles were interpreted comparatively under identical internal test conditions. Because individual-unit results and variance estimates were not available, the profiles were not used for formal similarity-factor analysis or inferential statistical testing. Dissolution efficiency from 0 to 45 min (DE₀–₄₅) was calculated by trapezoidal integration of the mean release-time profile. The area under the observed curve was divided by the theoretical rectangular area corresponding to 100% release throughout the same 45-min interval and expressed as a percentage. DE₀–₄₅ therefore reflects both early release and the overall profile level.

The time to 85% release (t₈₅) was estimated by linear interpolation between the two adjacent sampling times that bracketed 85%. When 85% release was not reached by 45 min, t₈₅ was reported as not reached. These calculations were descriptive and were not used as substitutes for individual-unit acceptance testing.
Accelerated Stability and Pilot Production
The lead spray-dried formulation (Trial 3) and the lead hot-melt-extruded formulation (Trial 5) were stored for six months at 40 ± 2°C/75 ± 5% RH. Appearance, identification, water content, assay, 30-min dissolution, and related substances were evaluated at baseline, month 3, and month 6. The accelerated condition was consistent with general ICH stability principles, and related-substance results were considered within the framework of ICH Q3B [23,24]. Pilot- production batches of both selected processes were manufactured at 4.60 kg per 10,000 tablets and followed using the same accelerated- storage programme. Assay and related substances were measured using internally validated, stability-indicating chromatographic procedures. Because the apparent assay decline was not quantitatively reconciled with measured total related substances, assay changes were interpreted descriptively rather than as direct quantitative measures of chemical degradation. Packaging configuration and the analytical basis of water content were not available in the dataset used for this retrospective analysis. These factors were therefore treated as limitations when interpreting moisture-related differences.
Data Analysis
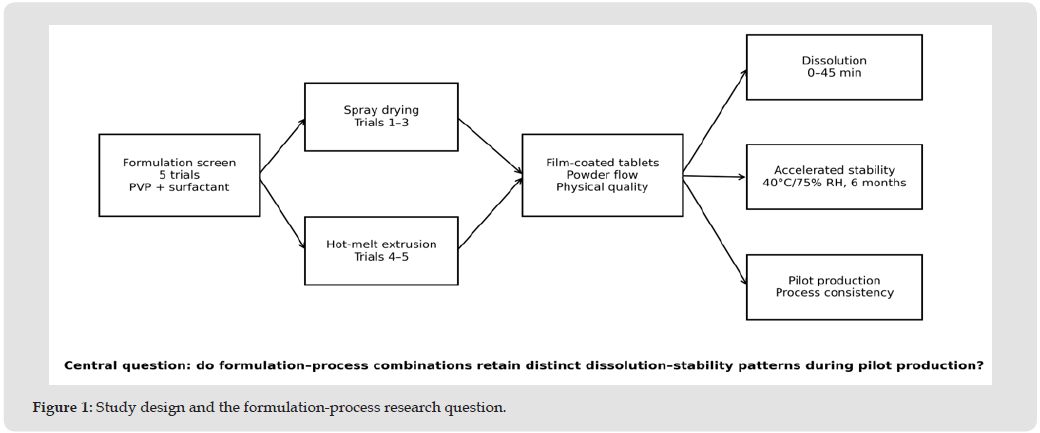
The analysis was descriptive. Reported batch-level means, sixmonth absolute values, baseline-to-month-6 absolute changes, relative retention, and consistency between laboratory and pilot-production batches were compared. Assay retention and dissolution retention were calculated as the month-6 value divided by the corresponding baseline value and multiplied by 100. The margin above the reported 85% development threshold was calculated as month-6 dissolution minus 85 percentage points. These derived quantities support transparent interpretation of absolute performance and change from baseline, but they do not establish statistical significance or pharmacopoeial compliance. Inferential statistics, confidence intervals, similarity-factor calculations, and process-capability analyses were not applied because individual-unit data, replicate counts, and variance estimates were unavailable (Figure 1).
Figure 1
Initial Dissolution Performance
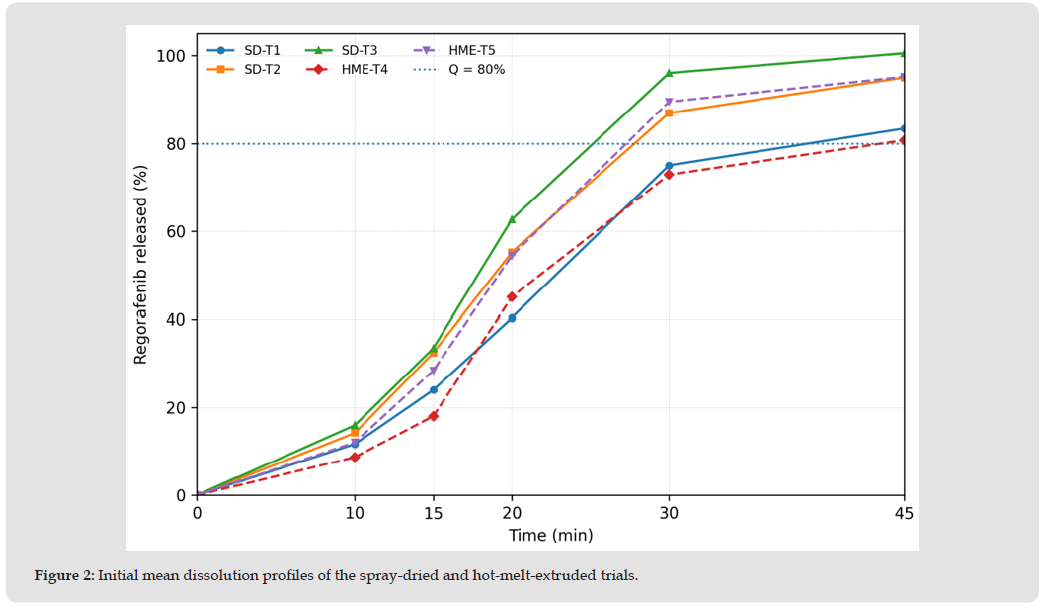
The five reported mean dissolution profiles began to separate during the first 20 min. Spray-dried Trial 3 showed the highest release at every measured time point from 10 to 45 min and reached 62.70% at 20 min and 96.05% at 30 min. It consequently produced the highest DE₀–₄₅ (60.27%) and the shortest estimated t₈₅ (26.7 min). Hot-melt-extruded Trial 5 was the best extrusion candidate, reaching 89.50% at 30 min, with a DE₀–₄₅ of 54.97% and a t₈₅ of 28.7 min. The 30-min difference between the two route-specific leads was 6.55 percentage points, while the DE₀–₄₅ difference was 5.30 percentage points. Spray-dried Trial 2 and hot-melt-extruded Trial 5 showed similar overall profile performance despite different process routes: their DE₀–₄₅ values were 55.17% and 54.97%, respectively, and both exceeded 85% release at 30 min. By contrast, spray-dried Trial 1 and hot-melt-extruded Trial 4 did not reach 85% by 45 min. The ranking therefore cannot be explained by manufacturing route alone; surfactant identity, undisclosed composition differences, and process-dependent particle attributes are plausible contributors (Table 3 & Figure 2).
Table 3: Initial dissolution profiles and derived descriptive metrics.

Figure 2
Laboratory-Scale Accelerated Stability
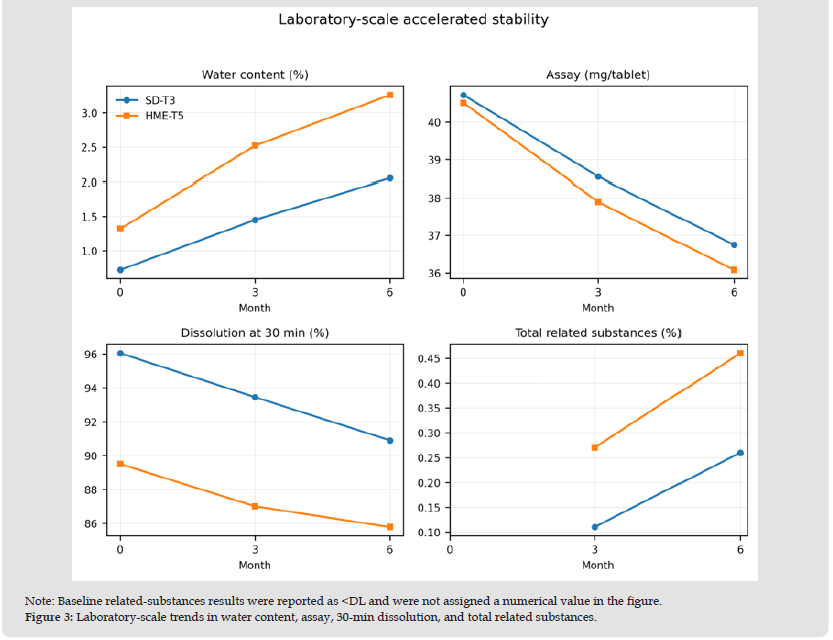
At month 6, spray-dried Trial 3 retained higher absolute 30-min dissolution than hot-melt-extruded Trial 5 (90.90% versus 85.77%), a difference of 5.13 percentage points. It also showed lower water content (2.05% versus 3.26%; difference, -1.21 percentage points) and lower measured total related substances (0.26% versus 0.46%; difference, -0.20 percentage points). Assay at month 6 was 36.75 mg/tablet for the spray-dried candidate and 36.08 mg/tablet for the extruded candidate. The interpretation of change from baseline differed from the absolute month-6 ranking. Dissolution decreased by 5.15 percentage points for spray-dried Trial 3 and by 3.73 percentage points for hot-melt-extruded Trial 5, corresponding to approximate retentions of 94.64% and 95.83%, respectively. The spray-dried candidate therefore retained the larger absolute release margin, but the extruded candidate showed the smaller proportional loss. Water content increased by 1.33 percentage points for the spray-dried candidate and 1.94 percentage points for the extruded candidate. Assay decreased by 3.97 mg/tablet in the spray-dried batch and 4.43 mg/ tablet in the extruded batch. Relative to baseline, these changes correspond to approximate apparent losses of 9.75% and 10.94%. Month-6 total related substances were 0.26% and 0.46%, respectively. Related-substances results do not necessarily correspond one-toone with assay loss because degradation products may differ in molecular weight and detector response, and the two procedures may use different quantitation approaches. Nevertheless, the magnitude of the apparent assay decrease was not quantitatively reconciled with the measured total related substances. The assay trend was therefore treated as a descriptive observation and was not used as sole evidence of chemical degradation (Table 4 & Figure 3).
Table 4: Six-month accelerated-stability results at laboratory scale.

Note: Assay changes are reported descriptively. The apparent assay decline was not quantitatively reconciled with measured total related substances or water-content change. This does not invalidate either analytical result; it limits interpretation of assay loss as a direct measure of chemical degradation without internal analytical reconciliation.
Figure 3
Pilot Production
At month 6, the spray-dried pilot-production batch showed higher 30-min dissolution than the hot-melt-extruded pilot-production batch (92.08% versus 86.00%), a difference of 6.08 percentage points. It also showed lower water content (2.18% versus 3.86%; difference, -1.68 percentage points) and lower measured total related substances (0.25% versus 0.49%; difference, -0.24 percentage points). Month-6 assay values were 37.15 and 36.10 mg/tablet for the spraydried and extruded batches, respectively. Dissolution declined by 6.17 percentage points for the spray-dried pilot-production batch and by 4.04 percentage points for the hot-melt-extruded batch, corresponding to retentions of approximately 93.72% and 95.51%. Water content increased by 1.33 and 2.31 percentage points, respectively. Assay decreased by 2.87 mg/tablet in the spray-dried batch and 3.88 mg/ tablet in the extruded batch, equivalent to approximate relative losses of 7.17% and 9.70%. As at laboratory scale, the selected spray-dried candidate retained a larger absolute dissolution margin and a lower measured moisture and related-substances burden, whereas the extruded candidate showed a smaller proportional loss of dissolution. The route-specific rank order was maintained in the pilot-production dataset for month-6 absolute dissolution, water content, assay, and total related substances. However, only one reported pilot-production batch per route was available. Maintenance of rank order is evidence of consistency within this dataset, not proof of process robustness, reproducibility, or a validated operating range (Table 5 & Figure 4).
Figure 4
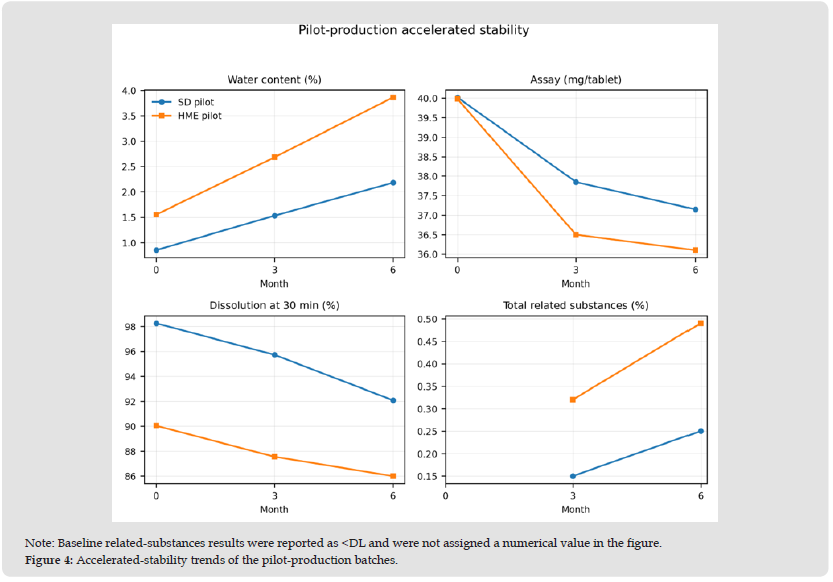
Table 5: Six-month accelerated-stability results for the pilot-production batches. Assay changes are presented descriptively because the apparent assay decline was not quantitatively reconciled with measured total related substances.

Integrated Laboratory and Pilot-Production Comparison
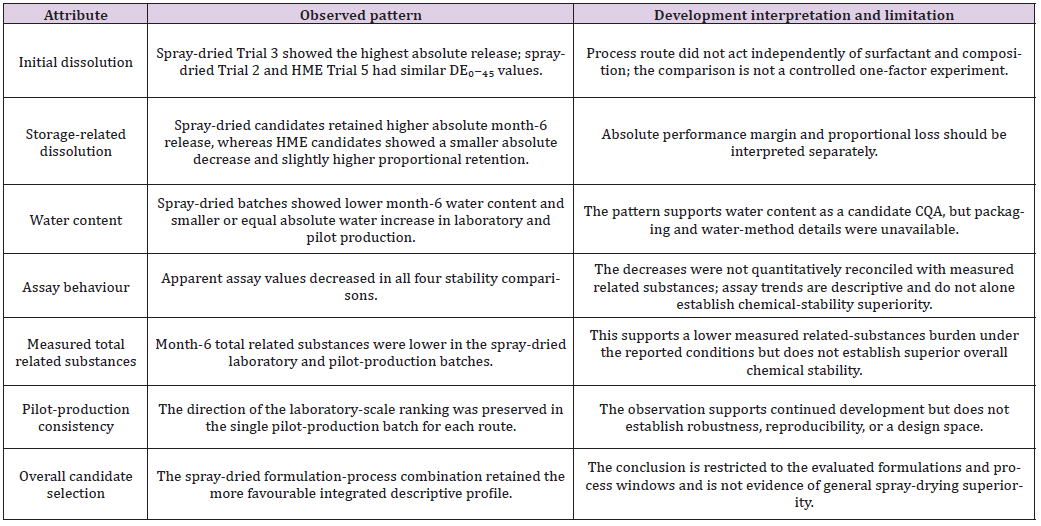
To avoid conflating absolute product performance with proportional change, the laboratory and pilot-production results were re-expressed using derived retention and margin metrics. Table 6 shows that the hot-melt-extruded batches had slightly higher proportional dissolution retention, whereas the spray-dried batches retained substantially larger absolute margins above the reported 85% development threshold. The spray-dried laboratory and pilot batches also showed lower month-6 water content and total related substances and higher month-6 assay values. Across laboratory and pilot production, the month-6 dissolution margins above 85% were +5.90 and +7.08 percentage points for the spray-dried candidate, compared with +0.77 and +1.00 percentage points for the extruded candidate. These margins illustrate formulation reserve but are not equivalent to compendial Q compliance because individual-unit results and stage-specific acceptance data are not presented (Table 6 & Figure 5). The integrated interpretation and its principal limitations are summarised in (Table 7). This format preserves the decision logic without assigning artificial numerical weights to attributes with different units and scientific meaning.
Figure 5
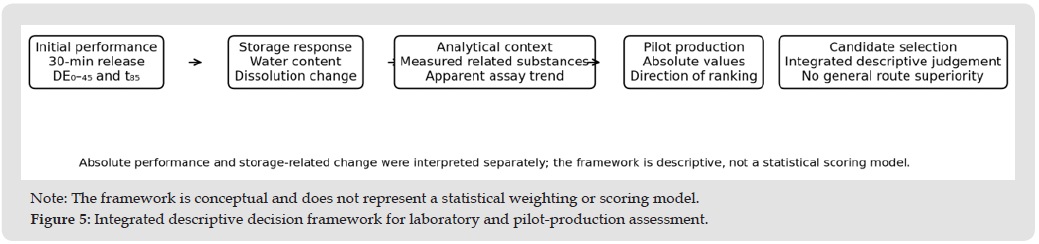
Table 6: Derived comparison of laboratory and pilot-production stability results.
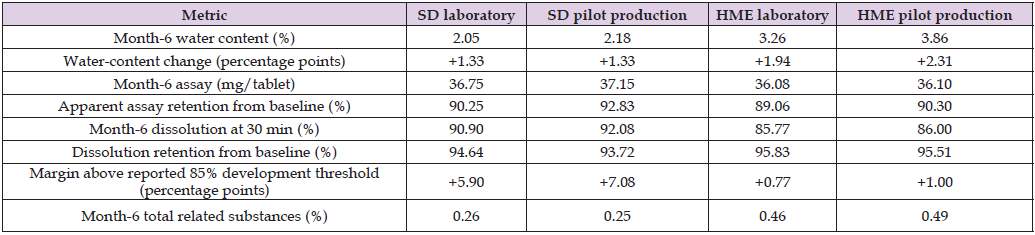
Note: Retention values were calculated from reported batch-level means. The margin above 85% is a descriptive development metric and does not establish pharmacopoeial stage compliance, which requires individual-unit data.
Table 7: Integrated descriptive interpretation and limitations of the formulation-process comparison.
Overall Interpretation of The Formulation-Process Comparison
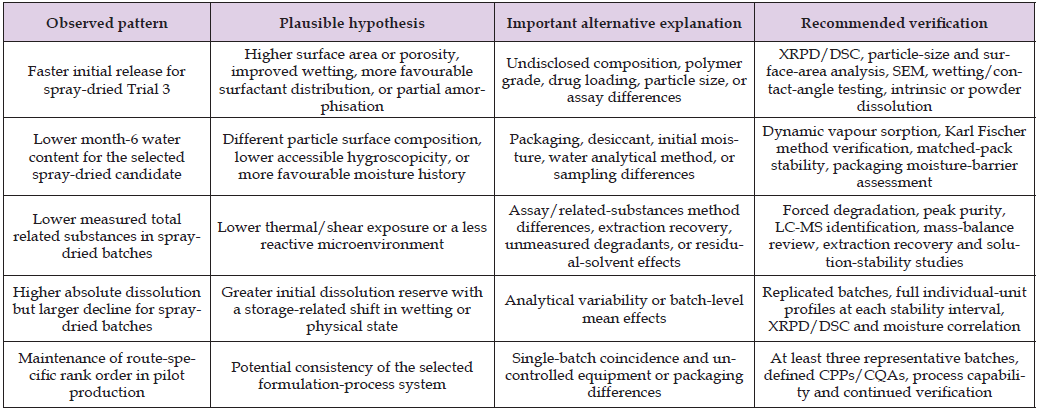
The central observation is not simply that one selected candidate released more drug at 30 min. The evaluated formulation-process combinations generated different patterns of initial release, dissolution reserve, water uptake, assay behaviour, impurity growth, and pilot-production consistency. This multidimensional pattern is consistent with the concept of process history: formulation composition defines the materials present, whereas manufacturing determines how those materials are spatially distributed, physically organised, thermally exposed, dried or cooled, and converted into particles that subsequently undergo blending, compression, coating, storage, and dissolution. The selected spray-dried candidate showed the more favourable absolute month-6 profile in the available dataset, but this conclusion is conditional. The spray-dried and extruded formulations were not fully composition-matched, the process and surfactant variables were partially confounded, and only batch-level means were available. The results therefore support a candidate-selection decision within this development programme rather than a universal hierarchy between spray drying and hot-melt extrusion. The study does not establish that the intermediates were amorphous. Powder X-ray diffraction, differential scanning calorimetry, glass-transition temperature, spectroscopic interaction data, and microscopy were not included in the dataset.
The term drug-polymer dispersion is therefore used descriptively, and amorphous mechanisms are discussed only as literature-supported hypotheses. A higher dissolution profile could instead arise from reduced particle size, altered porosity, improved wetting, surfactant distribution, partial amorphisation, or a combination of these effects.
Dissolution Profile, Supersaturation, and Performance Margin
Spray-dried Trial 3 showed the fastest initial release, but the highest release in a surfactant-containing quality-control medium is not automatically the most appropriate generic-development target. Regorafenib may precipitate into different solid states during biorelevant dissolution, and the polymer can influence the identity and kinetics of the precipitating phase [9]. The present medium may rank candidates during screening, but it cannot establish maintenance of supersaturation under gastrointestinal conditions, equivalence to the reference-product concentration-time profile, or in vivo bioequivalence. The present results should therefore be interpreted within the “spring–parachute” framework. Trial 3 generated the strongest early release in the selected quality-control medium, but the available dataset does not establish whether dissolved regorafenib remained molecularly dispersed, entered a drug-rich colloidal phase, or precipitated during the test. For a low-solubility compound, a rapid increase in apparent dissolved concentration is beneficial only when the supersaturated state persists long enough to maintain a concentration gradient for membrane transport. Conversely, a formulation with slightly lower initial release may produce similar or better biopharmaceutical performance if it sustains supersaturation more effectively [10,11]. Non-sink, two-stage, biorelevant, and dissolution–permeation experiments would therefore provide more mechanistic discrimination than a single surfactant-containing endpoint.
In this framework, the initial profile can be viewed as a measure of the rate at which the dosage form creates a dissolved or colloidally dispersed drug concentration, whereas later behaviour depends on the persistence of supersaturation and the kinetics of precipitation. The current quality-control profile captures the first component more clearly than the second. Without non-sink or biorelevant testing, the higher early release of Trial 3 cannot be distinguished from a transient concentration peak that may subsequently precipitate. The derived metrics provide information beyond the 30-min value. DE₀–₄₅ distinguishes mean profiles with similar endpoints but different early release, whereas t₈₅ describes how rapidly a reported mean profile crosses the 85% level. The similarity between the DE₀–₄₅ values of spray-dried Trial 2 and hot-melt-extruded Trial 5 is particularly informative: route did not act independently of surfactant and overall formulation composition. These metrics remain exploratory because individual-unit and variance data were unavailable. The use of DE₀–₄₅ is consistent with the original concept of dissolution efficiency, which expresses the area under the dissolution curve as a percentage of the area representing complete dissolution over the same time interval [25]. In the present study, DE₀–₄₅ is useful because it captures early- profile separation that is not fully represented by the 30- or 45- min values alone. Nevertheless, DE remains a descriptive summary: it does not identify the release mechanism, does not replace individual- unit acceptance criteria, and may assign similar values to profiles with different local shapes.
It should therefore be interpreted together with the complete profile, t₈₅, unit-level variability, and evidence that the dissolution method is discriminatory. DE₀–₄₅ is particularly useful in the present dataset because several profiles approached similar values by 45 min but differed substantially at 10–30 min. It therefore provides a single descriptive summary of profile shape. Nevertheless, DE₀–₄₅ depends on the selected sampling schedule and terminal time, and it has no universal acceptance limit. It should be interpreted alongside the complete profile, individual-unit variability, and clinically or regulatorily relevant specifications.
Moisture Behaviour and Physical-Stability Implications
The consistently lower water content of the selected spray-dried candidate may be mechanistically relevant. Moisture can plasticise povidone matrices, increase molecular mobility, weaken drug-polymer interactions, and promote phase separation or surface redistribution [13-15]. Humidity-driven surface enrichment has been demonstrated in regorafenib-povidone systems [13]. Nevertheless, packaging configuration, water-determination method, residual solvent, particle size, and initial solid state were not available in the present dataset; the observed water-content difference cannot therefore be attributed solely to manufacturing route. The repeated lower water content of the selected spray-dried candidate at laboratory and pilot production suggests a reproducible difference in the tested systems. However, the origin of this difference is unresolved. It may reflect polymer and surfactant distribution, initial intermediate moisture, residual solvent, particle surface area, porosity, coating behaviour, or packaging exposure. Because the storage configuration and water analytical method were unavailable, the observed values should be treated as product-level indicators rather than direct measurements of intrinsic hygroscopicity.
Interpretation of Assay and Related-Substances Results
Across the four laboratory and pilot-production stability comparisons, apparent assay values decreased by approximately 7.17-10.94% relative to baseline, whereas measured total related substances at month 6 were 0.25-0.49%. Related-substances percentages are not expected to reproduce assay loss on a one-to-one basis because degradation products may have different molecular weights and detector responses, and assay and related-substances procedures may use different quantitation principles. However, the numerical difference is sufficiently large that the apparent assay decline should not be interpreted as a direct quantitative measure of degradation without internal analytical reconciliation. Potential contributors include the calculation basis, potency or hydrate correction, extraction recovery, sample preparation, unit-weight normalisation, relative response factors, matrix effects, and the analytical coverage of the related-substances procedure. These are possible explanations rather than demonstrated causes. The chromatographic procedures are proprietary and are not reproduced in this article. Internal scientific reconciliation should consider the calculation basis, potency and hydrate corrections, sample preparation and extraction recovery, unit-weight normalisation, relative response factors, and analytical coverage. This review does not require disclosure of proprietary chromatographic parameters; its purpose is to ensure that assay and related-substances trends are interpreted within the validated scope of each procedure.
Accordingly, the lower total-related-substances values observed for the spray-dried candidate support a lower measured related- substances burden under the reported conditions, but do not by themselves establish superior overall chemical stability. Assay and related-substances trends should be reported as complementary descriptive observations, with conclusions restricted to the direct output of each analytical test.
Process-Route Interpretation and Causal Limitations
The literature does not support a universal ranking of spray drying over hot-melt extrusion. Some studies have reported comparable structure and performance between the routes [16], whereas others have shown route-dependent differences in powder flow, compression, dissolution, and stability [17-20]. Martynek and colleagues reported higher intrinsic dissolution after spray drying but greater recrystallisation resistance after hot-melt extrusion in model systems [20]. The optimal route therefore depends on drug-polymer miscibility, thermal and shear tolerance, solvent pathway, drug loading, desired particle attributes, and downstream dosage-form requirements. The broader amorphous-dispersion literature supports this balanced interpretation. Improved dissolution does not uniformly translate into improved bioavailability because the outcome depends on the reference material, gastrointestinal conditions, polymer dissolution, precipitation kinetics, particle size, and the degree to which the formulation maintains a driving force for absorption [10-12]. Route selection should therefore be based on a linked set of critical quality attributes—including physical state, particle properties, water sorption, residual solvent, degradation products, dissolution behaviour, and, where feasible, permeation or flux—rather than on a single release value. For the present regorafenib programme, the selected spray-dried formulation-process combination showed the more favourable overall descriptive profile. This conclusion is restricted to the evaluated PVP/surfactant combinations and process windows.
The observed differences cannot be attributed solely to thermal exposure; residence time, shear, moisture history, milling, particle architecture, and surfactant distribution remain plausible contributors. A stronger causal comparison would use composition-matched formulations in which polymer grade, drug loading, surfactant identity and level, external-phase composition, tablet weight, coating level, and packaging are held constant while the manufacturing route is varied. Multiple independent batches would then permit separation of route effects from batch-to-batch variability. Until such a design is performed, the present findings are best described as a comparison of integrated formulation-process systems (Table 8).
Table 8: Mechanistic hypotheses, alternative explanations, and verification plan derived from the observed formulation-process patterns.
Pilot-Production Relevance
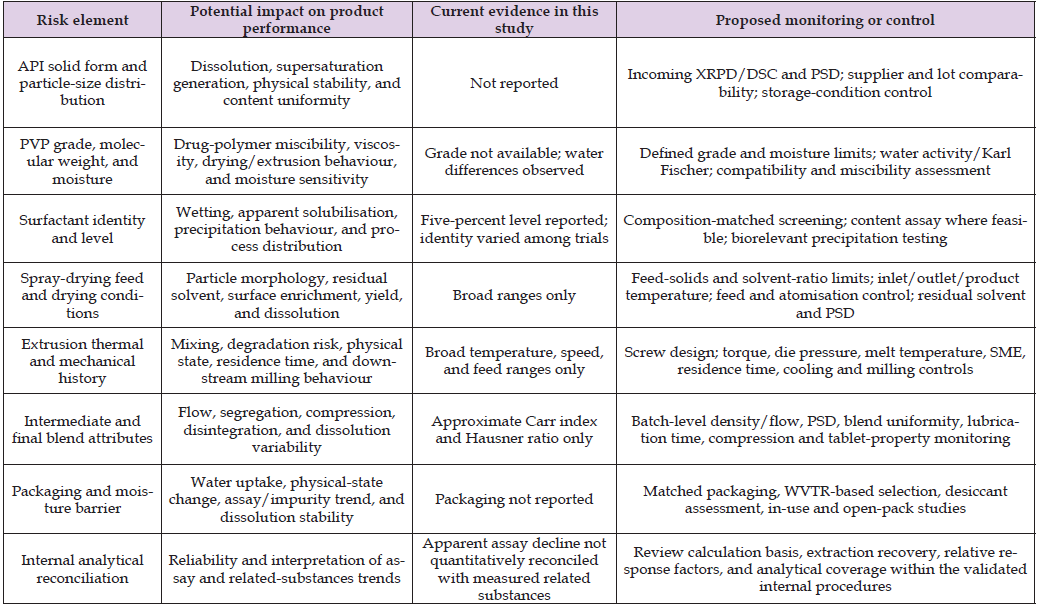
Pilot production adds practical value because it challenges heat and mass transfer, atomisation, residence time, collection, milling, blending, and compression behaviour. However, one pilot-production batch per route is insufficient to establish process robustness or a design space. Publication-grade conclusions regarding pilot-production consistency require actual set points rather than broad ranges, equipment geometry, product yield, residual-solvent data, particle-size distribution, bulk and tapped density by batch, compression speed, in-process variability, and preferably multiple independent batches. For spray drying, pilot-production confirmation should include actual feed-solids concentration, inlet and outlet temperatures, product temperature, feed rate, atomisation conditions, drying-gas humidity, collection yield, residual solvent, and particle-size distribution. For hot-melt extrusion, reporting should include screw geometry, zone set points and actual melt temperature, torque, die pressure, specific mechanical energy, residence-time distribution, cooling, milling conditions, and yield. Linking these parameters to intermediate and tablet CQAs would permit assessment of scale sensitivity and process capability. From an industrial perspective, literature comparisons are most informative when process variables and particle attributes are reported at sufficient resolution. Studies comparing spray drying and hot-melt extrusion have attributed performance differences not only to molecular miscibility but also to morphology, surface area, powder density, milling history, and particle-size distribution [16-20]. This supports the present emphasis on integrated formulation– process combinations and explains why subsequent pilot-production work should preserve actual set points, yields, in-process trends, and intermediate-material attributes rather than only broad operating ranges.
Quality-By-Design and Control-Strategy Implications
From a quality-by-design perspective, likely critical material attributes include active-substance solid form and particle size, polymer grade and moisture, surfactant identity and level, and feed-solution solids content. Candidate critical process parameters include inlet and outlet temperatures, atomisation gas, feed rate, aspirator setting, screw configuration, screw speed, barrel temperatures, specific mechanical energy, residence time, and milling conditions. A replicated design of experiments linking these variables to dissolution, water content, measured impurities, assay recovery, and physical state would convert the present descriptive dataset into a more defensible development model [26,27]. The practical objective of a control strategy would be to maintain a defined intermediate physical state and particle architecture while controlling moisture, residual solvent, flow, compressibility, tablet tensile properties, disintegration, dissolution profile, assay, and degradation products. Risk ranking should be updated as experimental evidence is generated. Variables that are currently plausible but unverified should remain hypotheses rather than being assigned fixed criticality solely from the present retrospective dataset (Table 9).
Table 9: Proposed quality-by-design risk map and control-strategy priorities for future development.
Biopharmaceutical Relevance for Generic Development
Given its low-solubility profile, regorafenib is not considered a suitable candidate for a solubility-based Biopharmaceutics Classification System biowaiver; in vivo bioequivalence remains central to generic development. Published studies show that test formulations can achieve bioequivalence to Stivarga under fasting and fed conditions [21,22], but these outcomes cannot be extrapolated to the present formulations. The current study supports the use of profile metrics and stability margins during candidate screening, whereas ICH M13A provides the harmonised framework for definitive immediate-release bioequivalence studies [28]. For generic development, the quality- control method should discriminate meaningful formulation or process changes, while biorelevant methods should explore precipitation and concentration maintenance under physiologically relevant conditions. Reference-product comparison across multiple media, non-sink testing, two-stage gastric-to-intestinal transfer, and dissolution- permeation or flux experiments would provide a stronger bridge between formulation screening and bioequivalence risk assessment. These experiments would not replace an in vivo bioequivalence study, but they could support candidate selection and explain unexpected clinical outcomes.
Study Limitations and Priority Follow-Up Work
The study is limited by the absence of individual-unit dissolution values, replicate-batch variance estimates, reference-product profile data, complete packaging details, residual-solvent results, particle-size data, process yields, executed set points, and solid-state characterisation. Detailed chromatographic parameters were intentionally not disclosed because the internally validated assay and related- substances procedures are proprietary. The relevant analytical limitation is therefore not the absence of validated methods, but the lack of quantitative reconciliation between the apparent assay decline and measured total related substances. Process route and surfactant identity were partially confounded, and the selected leads were identified retrospectively from the screening dataset. These limitations prevent formal statistical inference, similarity-factor analysis, process-capability assessment, and definitive attribution of the observed effects to manufacturing route. Priority follow-up work includes internal reconciliation of the apparent assay decline with the measured related-substances results; confirmation of dissolution apparatus, volume, agitation, sampling, filtration, and individual-unit results; powder X-ray diffraction and modulated differential scanning calorimetry at baseline and during stability; residual-solvent testing; dynamic vapour sorption; particle-size distribution, specific surface area, and microscopy; surface-composition analysis where available; non-sink and biorelevant dissolution with precipitation monitoring; dissolution-permeation or flux testing; matched packaging studies; and replicated laboratory and pilot-production batches designed using factorial or response-surface methods.
These studies would help determine whether the observed pattern reflects physical state, surface composition, wetting, moisture sensitivity, chemical degradation, process variability, or a combination of mechanisms.
Within the evaluated formulation-process combinations, the selected spray-dried regorafenib monohydrate tablet showed faster initial mean dissolution and retained higher absolute 30-min dissolution, lower water content, a higher measured assay value, and lower measured total related substances than the selected hot-melt-extruded tablet after six months of accelerated storage at laboratory and pilot-production levels. The advantage was primarily an absolute performance margin rather than a uniformly smaller storage-related decline: the extruded candidate showed slightly higher proportional dissolution retention, whereas the spray-dried candidate maintained a wider margin above the reported 85% development threshold. The results support an integrated candidate-selection approach in which dissolution profile shape, moisture uptake, assay interpretation, measured related-substances burden, and pilot-production consistency are considered together. They do not establish a general superiority of spray drying, an amorphous mechanism, or enhanced bioavailability. Before definitive chemical-stability conclusions are made, the apparent assay decline should be internally reconciled with the measured related-substances results. The overall findings should be confirmed using composition-matched replicated batches, solid-state and particle characterisation, matched packaging, reference-product comparison, and biorelevant or in vivo evaluation.
The authors thank the analytical development, formulation development, and manufacturing teams of World Medicine İlaç San. ve Tic. A.Ş. for their technical contributions and institutional support. The authors also acknowledge Ruşen Kalender for supporting the research programme.
This study was funded by World Medicine İlaç San. ve Tic. A.Ş.
All authors are employees of World Medicine İlaç San. ve Tic. A.Ş. The authors declare no other competing interests.
The data evaluated in this study are proprietary industrial development records. The reported summary data are included in the article; access to additional raw records is subject to company approval and confidentiality requirements.
Not applicable. The study did not involve human participants, human biological samples, or animals.

International Association of Landscape Archaeology, Czech Glass Society, Czech Republic

Department of Chemistry, Semenov Institute of Chemical Physics, USSR Academy of Sciences, Moscow, Russia

Department of Educational Sciences, Research Centre Qualities of Teachers, School of Education – HAN, Nijmegen, Netherlands

Associate Professor at Department of Breast and Thyorid Surgey, Chongqing General Hospital, China

Neurology, LA BioMed Research Institute, USA





 Abstract
 PDF