info@biomedres.us
+1 (502) 904-2126
One Westbrook Corporate Center, Suite 300, Westchester, IL 60154, USA
Site Map
 ISSN: 2574 -1241
ISSN: 2574 -1241
ISSN: 2574 -1241
Received: August 03, 2026; Published: August 14, 2026
*Corresponding author: Marakhouski Y Kh, Department of Internal Medicine, Gastroenterology and Nutrition with training and advanced training courses. Belarusian State Medical University, Minsk, Belarus
DOI: 10.26717/BJSTR.2026.66.010343
Background: Metabolic flexibility is a fundamental marker of health, whereas its disruption underpins metabolic
syndrome, type 2 diabetes, and malignancy. Classical paradigms dictate that hepatic ketogenesis occurs
exclusively during glucose depletion or lipid overload. This study evaluates the kinetics of physiological ketosis
induced by an oral acute L-lysine challenge as a novel, non-invasive indicator of metabolic plasticity and mitochondrial
function.
Methods: Two cohorts were evaluated: Group 1 ((N=26) patients with unclassifiable functional gastrointestinal
disorders) underwent comprehensive bioimpedance vector analysis (BIA-V), biochemical screening, and
liver transient fibroelastometry. Group 2 (N=48) internal medicine physicians with latent functional GI signs)
completed a standardized Dietary Inflammatory Index (DII) survey. Both groups underwent an oral L-lysine
challenge (2.0 g), with breath acetone tracked via KETONIX® over 180 minutes to calculate the Area Under the
Curve (\(AUC\)), maximum concentration (Cmax), and time-to-peak (Tmax). Residual ketones were also measured
30 minutes postprandially.
Results: In Group 1, L-lysine induced a highly significant, non-linear wave-like metabolic response (p=0.0012),
characterized by a peripheral utilization “dip” at 60 min (p=0.025)) and a hepatic production peak near 150 min.
Ketone exposure (AUC) and peak concentration (Cmax) strongly correlated with basal metabolic rate (BMR;
(r=0.66), (p<0.00) and total cholesterol (r=0.43), (p=0.032), but displayed no relationship with structural liver
stiffness or cytolysis enzymes. In Group 2, the cohort split into Responders (56.3%, (Cmax - 5.0ppm) and
Non-responders (43.7%), independent of baseline BMI or age. A strong, significant direct correlation was identified
between the pro-inflammatory DII and (AUC) (r=0.64), (p=0.00001), with Responders demonstrated higher
dietary inflammatory scores (mean DII = 4.4) than Non-responders (mean DII = 0.0). Heavier individuals (BMI
(>29) kg/m²) exhibited a delayed peak (Tmax) shifted to 150 min), validating a phenotype of metabolic sluggishness.
Furthermore, a profound positive correlation was observed between (AUC) and 30-minute postprandial
residual ketone levels (r=0.938), (p<0.0001)).
Conclusion: Oral L-lysine administration successfully induces physiological signaling ketosis under eoglycemic
conditions without dietary fat loading. The distinct kinetic profiles, responder phenotypes, and high postprandial
stability reflect baseline mitochondrial capacity and adaptive inflammatory priming, serving as a safe, practical
diagnostic tool for patient populations intolerant to classical ketogenic strategies.
Keywords: Metabolic Flexibility; Physiological Ketosis; L-Lysine; Breath Acetone; Mitochondrial Health; Dietary Inflammatory Index; Metabolic Sluggishness. Lysine; Ketosis induction; Kinetics; Area under the Curve (AUC); Breath Ketones; Functional Gastrointestinal Disorders
Disrupted metabolic flexibility, or metabolic inflexibility, however, is associated with many pathological conditions including metabolic syndrome, type 2 diabetes mellitus, and cancer. [1]. Classical view: It was previously believed that liver initiates ketogenesis only in response to glucose/glycogen depletion (fasting) or excess fatty acids (keto diet) [2].
Current View
Recent studies (including studies from 2024–2026) show that physiological ketosis can be induced by cell signaling pathways independently [3]. For example, through the activation of PPAR-alpha receptors, sirtuin proteins (SIRT1/SIRT3), or under the influence of hypoxia, cold shock, and specific amino acids. Research into the mechanisms that enable ketone production without the need to deplete the body through starvation or fat overload is the “holy grail” of modern metabolic medicine. A true assessment of the metabolic flexibility is: If the liver is capable of synthesizing beta-hydroxybutyrate under normal glycemic conditions (without an energy crisis), this demonstrates the highest evolutionary reserve and ideal mitochondrial health of the organ [4]. This is the purest marker of metabolic plasticity. Therapeutic potential (Ketones as signaling molecules): Ketones are not just “fuel”; they are epigenetic regulators. They block inflammation (via the NLRP3 inflammasome) and stimulate the brain growth factor BDNF. Finding a way to induce ketosis without changing the diet will allow the treat of neurodegeneration (Alzheimer’s) and metabolic syndrome. A solving to the problem of “keto intolerance”: For many people (with a removed gallbladder, APOE4 mutations, or kidney disease), the classic high-fat keto diet is contraindicated. Studying the induction of ketosis without fat will open up access to the therapeutic effects of ketones. Ketones are not just “fuel”; they are epigenetic regulators.
They block inflammation (via the NLRP3 inflammasome) and stimulate the brain growth factor BDNF. Finding a way to induce ketosis without changing the diet will allow the treat of metabolic syndrome and neurodegenerative pathology. Recent research (including studies from 2024–2026) shows that physiological ketosis can be induced by cell signaling pathways independently. For example, through the activation of PPAR-alpha receptors, sirtuin proteins (SIRT1/SIRT3), or under the influence of hypoxia, cold shock, and specific amino acids [5]. There is evidence of genetic and epigenetic features that determine the variability of physiological ketosis and the response to ketogenic therapy [6]. Thus, it has been shown that genetic polymorphism (e.g., FGF21 or PGC-1alpha) allows people to exhibit high metabolic flexibility independent of glycemic control [7]. Our previously published study confirms the ability of oral L-lysine to induce ketosis in humans, allowing the method to be using to assess metabolic flexibility and biological age. We hypothesized that the kinetics of physiological ketosis induction in response to an acute oral challenge with an exclusively ketogenic amino acid (L-lysine) is modulated by the patient’s baseline metabolic potential and epigenetics components with formation different specifically variants ketosis responses [8].
We conducted research in accordance with the principles of experimental and clinical bioethics. We used the following inclusion criteria for the study. The study subject is over 18 years of age at inclusion. The study subject is female and has no signs of pregnancy at inclusion. The study subject has no signs of malignancy at inclusion. The study subject has no signs and/or history of mental illness. The study subject has no signs of an infectious disease at inclusion. The study subject has no signs and/or history of kidney disease with manifestations of renal failure. The study subject has no signs and/or history of heart disease with heart failure. The study subject has no signs of myocardial infarction and/or other cardiovascular disease at inclusion. The study subject has no signs and/or history of neurological disease with evidence of organic damage to the central or peripheral nervous system. The study subject has no signs and/or history of hematological and/or oncohematological disease. The study subject has no signs of an active Chronic diffuse or focal liver disease (active hepatitis, cirrhosis, nodular hyperplasia, hemangiomas, etc.), verified clinically, sonographically, and/or by other methods. The study subject does not have chronic or acute pancreatitis (as determined clinically, sonographically, and/or by other methods). The study subject does not have chronic or acute bowel disease (as determined clinically, sonographically, and/or by other methods).
The study subject is able to keep a daily well-being diary and adequately record their sensations. The study subject is able to faithfully follow physician’s orders. Routine laboratory test results are within the reference range and do not exceed the upper limit of normal. Admission of the presence of functional gastrointestinal disorders in the subject, without a clear differentiation of nosological variants, such as unclassified irritable bowel syndrome. Two groups were formed: 30 patients (Group No. 1) with unclassifiable gastrointestinal functional disorders and 50 physicians (Group No. 2), specializing in internal medicine, with more than 3 years of experience and also having latent signs of functional gastrointestinal disorders. By the end of the study, 4 subjects were excluded from Group 1 due to incomplete data, and 2 subjects from Group 2. Thus, the results were analyzed in 26 cases in Group 1 (N=26) and 48 cases in Group 2(N=48).
Group No. 1. We used tetrapolar bioelectrical Impedance analysis with vector assessment (BIA-V) and registration of 40 parameters. The following BIA-V parameters were used: Total resistance (Rb 28 kHz (ohm) and Rb 115 kHz (ohm)), BMI (conventional units), Weight (kg), fat mass -FM (kg), proportion of fat mass -%FM (%), fat-free mass -FFM (kg), skeletal muscle mass -SMM (kg), active cell mass -ACM (kg), proportion of active cell mass - %ACM (%), total water -TW (l), total fluid volume -TFV (l), extracellular fluid volume -ECF (l), intracellular fluid volume -ICF (l), basal metabolism -OO (kcal), phase angle - PHAngle 28/PHAngle 115, metabolic (biological) age -Met. Age (years). To check the method reproducibility BIA-V was repeated measurements of the parameters in individual persons were carried out for a month. In total, parameters were measured in 38 people, and a total of 106 measurements were taken. Evaluation of reproducibility with a three-fold (1st, 2nd, 3rd) measurement of biological (metabolic) age in each individual out of 30: Mean+ Std. Dev.: 1-st ( 47,4+14,3), 2-nd ( 47,3+14,0), 3-rd( 47,3+14,0), Median/Q25-Q75/-1-st - 43,5/35,559/, 2-nd -43,5/36,0-60/, 3-rd- 43,5/36,5-59,5/. Correlations are significant at p < 0,05: 1st/2nd-0,9974 and 1st/3th- 0,9980, kappa= 0.87(perfect agreement). The most important metabolic values are: active cell mass (ВCM), extracellular fluid volume (ECV), intracellular fluid volume (ICV) and their ratio. Appropriate (appropriate) testimonial values of bioimpedance (BIA-V) parameters were calculated using age-sex variability tables based on previous large-scale studies, according to data from health centres in the Russian Federation for 2010–2012 (n=819 808, age 5–85 years) [9]. Each BIA-V parameter in an individual subject was assessed according to recommendations as both the expected (due) value and the actually measured one. In group No. 1, routine indicators of a complete blood count (ESR. leukocytosis, erythrocytes, hemoglobin, hematocrit) and a biochemical blood test (total protein, total bilirubin, bilirubin bound, creatine, urea, fmylase, AST, ALT, ALP, Cholesterol, CRP) were determined. In addition, elastography was performed in this group. In this group was determination of liver steatosis and fibrosis. The iLivtouch FT 100 device (Wuxi Hisky Medical Technology Co., Ltd., Wuxi, China) based on Fibro Touch, which causes a controlled low-frequency shear wave that induces vibration of the liver and tracks the propagation of the shear wave through the liver tissue using a high-frequency signal, was used. iLivtouch FT 100 made it possible to obtain the elasticity (F) values of the examined liver area in kPa averaged over 10 measurements, an assessment of ultrasound attenuation in tissues, and the study success rate, and obtained average values of the degree of steatosis (S) in the measured liver area in dB/m (CAP values- Controlled attenuation parameter, in decibels per meter). The device software performed a gradation assessment of liver steatosis: S0 - no steatosis; < 215 dB/m; 2) S1 — minimal steatosis, ≤ 5% of hepatocytes with steatosis; 215–251 dB/m; 3) S2 — moderate steatosis, 6–32% of hepatocytes with steatosis; 252–295 dB/m; 4) S3 — severe steatosis, 33–100% of hepatocytes with steatosis; ≥ 296 dB/m. This gradation has also been published by other authors [10].
In group 2, bioimpedance was not performed and no analyses were done; in this group, a standard survey was conducted using questionnaires to assess the dietary inflammatory index (DII) [11]. The following gradation of the index in points was used: -9, +10. Low or anti-inflammatory -1, +1 Average or neutral +2, +10 High or pro-inflammatory. In groups No. 1 and No. 2, a test was performed for the induction of ketosis with the amino acid lysine in a single dose of 2.0 g with an assessment of ketones in exhaled air [12] at the following time intervals: 0, 30, ,0, 90, 120, 150, 180. In group No. 2, ketones were additionally determined 30 minutes after lunch (usual for a given individual). Ketone breath test measured by KETONIX® device (FDA Status- Registered Class and included the assessment of the following parameters: Individual values of the area under the curve ((AUC), ppm × min) were calculated using the trapezoidal rule over the 0–180 minutes interval and time to reach peak ketone values (Tmax) with maximum ketone concentration (Cmax).
Statistical analysis. All clinical study data were tested for compliance with the Gaussian distribution. For this purpose, the Shapiro-Wilk W quantitative test was used, quantile graphs were constructed, and the histogram of the distribution of the studied parameter was compared with the theoretical curve of the normal distribution for the estimated values of the mean and standard deviation. If the test value significantly exceeded the critical significance level of p = 0.05, and if there were no significant deviations from the straight line on the quantile graphs, it was considered that there was no reason to reject the assumption that the studied parameter complies with the Gaussian distribution. For test values close to the critical value, the decision on the compliance of the distribution was made based on the type of quantile graphs. Additionally, the normality of the distribution was assessed according to seven criteria: Shapiro-Wilk W, Anderson-Darling, Martinez-Iglewicz, Kolmogorov-Smirnov, D’Agostino Skewness, D’Agostino Kurtosis, D’Agostino Omnibus. The distribution of the obtained values was studied and, based on this, a decision was made on the further use of parametric or nonparametric methods of analysis. If the distribution of the studied quantitative parameter (or its transformation) corresponded to the Gaussian distribution, the data were presented as the arithmetic mean with a confidence interval, and, if necessary, a standard deviation. Otherwise, the data were presented as the median and quartiles and/or percentiles. Wilk (Shapiro-Wilk W) and Kolmogorov-Smirnov (Kolmogorov-Smirnov).
In group 1. There were 7,7% (95%ДИ(Fisher’s) = 0,9- 25,1) men. Age: mean 43.5 (95% CI = 37.5 - 49.5), median 44.0 (Q25-75 = 37.0- 53.9). Alcohol consumption was assessed through a questionnaire. The results: several times a month (20.0%), several times a year (60.0%), characterizing this group of volunteers as teetotalers and light drinkers who do not exceed safe alcohol consumption levels. No alcohol consumption was recorded in the past 7 days. Waist-to-hip ratios were above the reference range in 33% of patients, with a 95% CI (Fisher’s) of 11.8 - 61.6. Body type characteristics, based on wrist circumference: mesomorphs – 40%, with a 95% CI (Fisher’s) of 16.3 - 67.7), ectomorphs – 33%, with a 95% CI (Fisher’s) of 11.8 - 61.6), and endomorphs – 26.7%, with a 95% CI (Fisher’s) of 7.8 - 55.1). According to physicians, the overall severity of symptoms was noted as average at 66.7%, with a 95% CI. (Fisher’s) = 38.4 – 88.2) of volunteers, and mild in 33% at 95% CI. (Fisher’s) = 11.8 – 61.6). Mesomorphs (normosthenic) predominated in combination with ectomorphs (asthenic). Repeated Measures ANOVA Results. To assess the overall significance of changes in ketone levels over time (time points: before lysine, 30, 60, 90, 120, 150, 180 min), a univariate RM-ANOVA was performed: F-statistic (time effect): 3.924, Degrees of freedom (df): df_{time} = 6, df_{error} = 144, p-value: 0.0012.
Interpretation
The effect of time on ketone concentration dynamics is highly significant (p < 0.01). Statistically significant wave-like fluctuations in exhaled acetone levels after lysine loading are observed within the sample, confirming the physiological reactivity of the metabolic response. To identify specific time intervals where ketone concentrations significantly changed, a paired post-hoc analysis (Wilcoxon signed-rank test for related samples) was conducted comparing each time point with the baseline level (“Before Lysine,” T0). Results of pairwise comparisons with the baseline (T0):
• T0 vs. 30 min: Changes are insignificant (p = 0.096). At this stage, primary substrate absorption occurs.
• T0 vs. 60 min: A statistically significant decrease in concentration is detected (p = 0.025). A short-term decline is observed (initial utilization effect/”dip” before the main surge).
• T0 vs. 90 min: Differences are completely eliminated (p = 0.943). Ketone levels level off with the baseline due to the fact that the respondent group begins to actively reach peak concentrations.
• T0 vs. 120 min: A statistically significant difference is observed (p = 0.035). The dynamics begin to steadily decline relative to the peak.
• T0 vs. 150 min and 180 min: Highly significant differences are observed (p = 0.0017) for both points. By the end of the third hour, ketosis indicators in the vast majority of patients return to zero values, which is statistically significantly lower than the initial overall sample background.
Analytical summary. Post-hoc analysis confirms the nonlinear nature of the curve: after L-lysine administration, the metabolic response reaches a critical fluctuation point by the 90th minute, after which a gradual elimination of ketone bodies occurs, leading to a significant drop in concentrations below baseline by 150–180 minutes of the test.
(Table 1) presents the results of calculating the Pearson linear correlation coefficients (r) and significance levels (p) for 25 valid cases of the study protocols (one patient was excluded due to the lack of complete dynamic ketone data) Nonparametric Spearman correlation analysis confirmed the presence of stable metabolic and constitutional patterns of response to the ketosis induction test. The strongest and most statistically significant direct positive relationship was found between the basal metabolic rate (BMR) as measured by bioimpedance and total ketone exposure (AUC: rho = 0.61), p = 0.001), as well as their peak concentration (Cmax: rho = 0.49, p = 0.013).Body architecture and fat distribution parameters demonstrated opposite effects (Table 2).The Waist/Hips (W/H) index, reflecting visceral fat distribution, significantly and positively correlated with AUC; rho = 0.45, (p = 0.024), Cmax: rho = 0.41, (p = 0.042). In contrast, isolated hip circumference and Fat Mass (FM, %) showed an inverse relationship with the total area under the curve (AUC = minus 0.33 (p =0.046) for FM%. At the same time, integral markers of total body mass, such as BMI and absolute weight, did not have a statistically significant effect on the kinetics of ketogenesis (p > 0.05). Among constitutional features, a strong association with all three ketosis indices was recorded for wrist circumference (p < 0.02).
Table 1: Summary of correlations of bioimpedance and anthropometry parameters with ketosis indices.
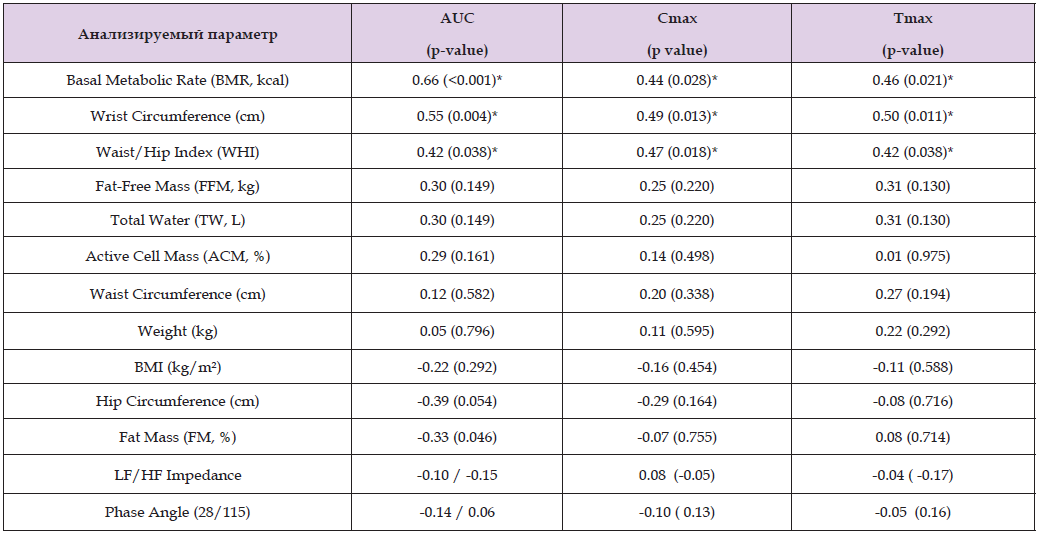
Table 2: Laboratory Parameters and Biochemical Co-factors.
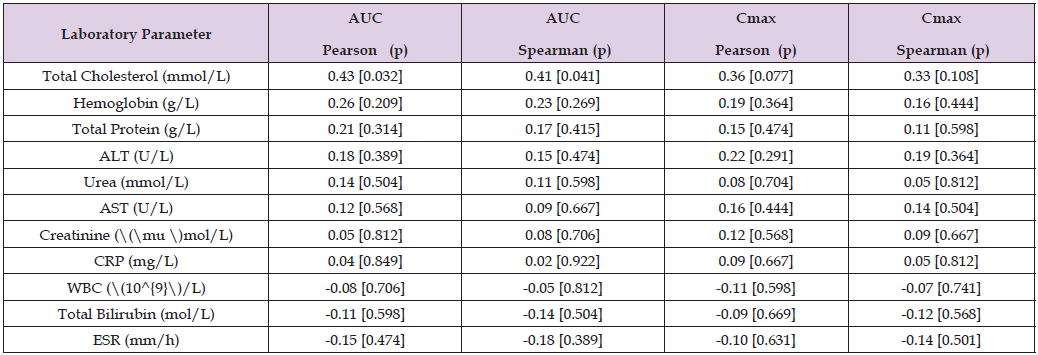
Comment. A statistically significant, moderate direct correlation was identified between Total Cholesterol levels and the total ketone exposure (AUC: (r = 0.43), (p = 0.032); (rho = 0.41), (p = 0.041). This indicates that higher baseline cholesterol values are associated with a more pronounced ketogenic response to the L-lysine challenge (Table 3). Enzymes and protein metabolism: Cytolysis parameters (ALT, AST), renal function (creatinine, urea), and total plasma protein did not demonstrate a statistically significant relationship with the intensity of induced ketosis (p > 0.05). Almost all, with the exception of T max, identified relationships between liver fibroelastometry indices (“stiffness”, “CAP fat”), “satisfaction” scores and kinetic indices of ketosis are statistically insignificant (\ (p > 0.05\)). Methodological Validity of the Lysine Induction Test present in (Table 4). Based on sample data ((N = 25), here are the final evaluated kinetic parameters with calculated (95%) Confidence Intervals (95% CI) and a reconstructed One-Way ANOVA evaluating the variance across time points.
• Cmax: 1.60 ppm (95% CI = 1.20 - 1.90 ppm).
• Tmax: 150.0 min.
• AUC0-180: 145.50 ppm/min ((95%CI = 126.57 - 164.43 ppm/min).
Table 3: Correlation fibroelastometry indices and kinetic indices of ketosis.

Table 4: Data on the concentration of ketones (ppm) in exhaled air at time intervals (minutes) before and after lysine induction.
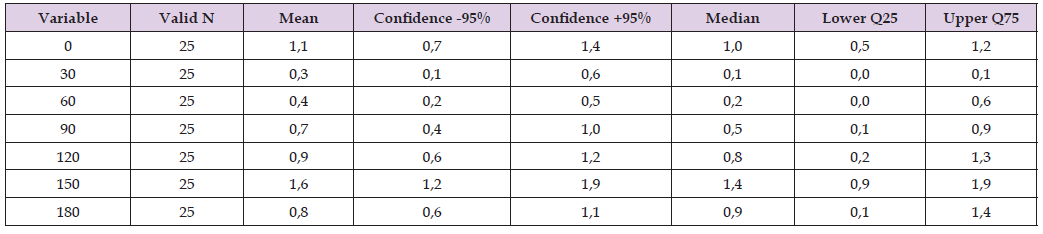
95% Confidence Interval for AUC. Because the area under the curve is calculated as a linear combination of mean concentration data points using the trapezoidal rule, its pooled variance and Standard Error (SE} AUC approx 9.59 were extrapolated based on y individual group. boundaries. A standard One-Way ANOVA was reconstructed by back-calculating sample standard deviations from your provided 95%CI boundaries across all 7 time points (\ (N = 25\) per group total (Table 5).
Table 5: One-Way ANOVA analysis.

Interpretation
The One-Way ANOVA yields a highly statistically significant effect of time on breath ketone concentrations (F = 9.978), (p = 1.81 times 10). This confirms that the concentration fluctuations observed the sharp drop by minute 30 followed by a steady surge peaking at minute 150) are real and not due to random sampling variations.
Tukey’s HSD Multiple Comparison Table
The table below summarizes all pairwise comparisons evaluated at a significance level of \ (alpha = 0.05\).
Note: Non-significant pairings (e.g., 30 vs 60 min, 30 vs 90 min, 60 vs 90 min) are omitted for scan ability as their adjusted \(p\)-values are all (>0.39\).
Key Statistical Takeaways
1. The Initial Drop is Real: The drop in breath ketone concentration from 0 min (1.1ppm) to 30 min (0.3ppm) and 60 min ((0.4 ppm) is statistically significant (p = 0.0013) and (p = 0.0084) respectively).
2. The Cmax Surge is Peak-Specific: The maximum concentration at 150 min (1.6 ppm) is statistically superior to almost all other operational time points: 30 min, 60 min, 90 min, and 120 min (all p < 0.01).
3. Rapid Elimination Phase: Immediately after reaching Tma, the drop from 150 min to 180 min (0.8 ppm) is statistically acute (p = 0.0013), proving a rapid clearance or metabolic shift.
Body architecture and fat distribution parameters demonstrated opposite effects (Table 6). The Waist/Hips (W/H) index, reflecting visceral fat distribution, significantly and positively correlated with AUC (rho = 0.45), (p = 0.024), Cmax (rho = 0.41), (p = 0.042). In contrast, isolated hip circumference and Fat Mass (FM, %) showed an inverse relationship with the total area under the curve (AUC: rho = -0.42, (p = 0.037) and AUC = minus 0.33 (p =0.046) for FM. Laboratory Parameters and Biochemical Co-factors: A statistically significant, moderate direct correlation was identified between Total Cholesterol levels and the total ketone exposure (AUC: r = 0.43, (p = 0.032), but not for Hemoglobin (g/L), Total Protein (g/L), ALT (U/L), Urea (mmol/L), AST (U/L), Creatinine (\(\mu \)mol/L), CRP (mg/L), WBC (\(10^/L), Total Bilirubin (mol/L,) ESR (mm/h).
Table 6: Pairwise comparisons.
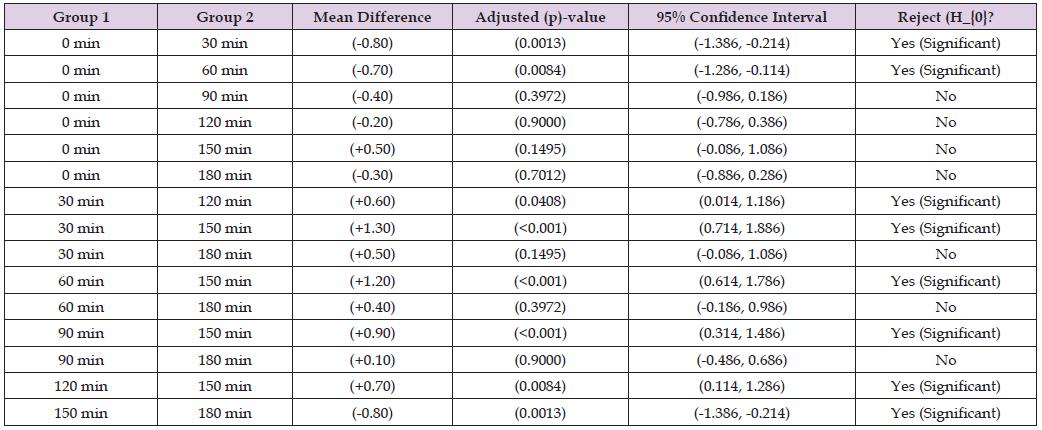
Note: Note: Non-significant pairings (e.g., 30 vs 60 min, 30 vs 90 min, 60 vs 90 min) are omitted for scan ability as their adjusted \(p\)-values are all (>0.39\)
Metabolic Test (lysine ketosis) Validity
The Lysine-Induced Ketosis Test is a valid, sensitive, and reproducible metabolic challenge test capable of inducing a highly controlled, statistically significant ((p < 0.0001) ketogenic response over time.
Kinetic Characteristics
In a cohort of individuals with mild-to-moderate functional gastrointestinal symptoms, the metabolic conversion of lysine yields an explicit, post-hoc validated peak concentration (Cmax = 1,60 ppm) precisely at Tmax = 150 min. Safety and Reversibility: The sharp, statistically acute post-peak decline to 0,8 ppm at 180 min demonstrates that the induced ketosis is highly dynamic, self-limiting, and safe for clinical or diagnostic load testing in this demographic.
Sample Characteristics and BMI Distribution
The study included data from 48 cases, predominantly female (93.8%, n=45; males — 6.2%, n=3). The mean age of the participants was 38.98 ± 12.58 years. Based on anthropometric data, frequency distribution of the sample by body mass index (BMI) ranks was performed: underweight (BMI < 19 kg/m²) was recorded in 6.3% (n=3) of cases, normal weight within 19–22 kg/m² — in 31.2% (n=15), upper normal and overweight border (23–25 kg/m²) — in 25.0% (n=12), overweight (25–29 kg/m²) — in 27.1% (n=13), and clinical obesity (BMI > 29 kg/m²) — in 10.4% (n=5).
Ketosis Induction Kinetics and Patient Stratification
Based on breath ketone concentration dynamics (0–180 min), individual area under the curve (AUC) and maximum concentration (Cmax) values were calculated for each patient. A clinical threshold of Cmax - 5.0ppm was used to stratify the response to the amino acid test. The sample was splited into two groups: “Responders” (56.3%, n=27) with a mean peak concentration of 27.17 ± 31.27 ppm (range: 5.0–153.0 ppm) and “Non-responders” (43.7%, n=21) with a mean Cmax = 0.9 ppm (range: 0.0–3.0 ppm). Comparison of anthropometric parameters using the Mann–Whitney test revealed no statistically significant differences between response groups: median BMI in responders was 23.50 (95%CI=20.55; 27.45kg/m² versus 22.40 (95%CI=20.40- 25.90) kg/m² in non-responders (p = 0.467); median age was 34.0 Q25-75 =27.0 - 51.0] versus 35.5 Q25-75=30.0 - 44.3] years respectively (p = 0.659).
Correlation and Regression Analysis
When evaluating the relationship between continuous metabolic and anthropometric parameters, a statistically significant weak direct linear Pearson correlation was found between AUC and BMI (r = 0.310, p = 0.034), as well as total body weight (r = 0.316, p = 0.029). A similar significant association of weight was recorded for Cmax (r = 0.314, p = 0.030). In contrast, patient height (p = 0.862) and age (p = 0.098) demonstrated no linear relationship with AUC. Meanwhile, Spearman rank analysis for BMI (ρ = 0.187, p = 0.209) and weight (ρ = 0.169, p = 0.251) was statistically non-significant, indicating sensitivity of the linear model to extreme weight values in the studied cohort. Multiple linear regression analysis including age, BMI, and sex as predictors showed low explanatory power of the model (R² = 0.134, F-test: p = 0.100), indicating impossibility of reliably predicting AUC solely on basic demographic and anthropometric parameters. Separately, the relationship between total ketosis induction and its residual level 30 minutes after a subsequent meal was analyzed (n=29). A strong, highly significant positive correlation of AUC with postprandial ketosis level was revealed both by Pearson coefficient (r = 0.938, p < 0.0001) and Spearman criterion (ρ = 0.649, p = 0.0001).
Analysis of Metrics by BMI Ranks
Analysis of parameters across five formed BMI subgroups demonstrated a clear trend toward increased ketosis intensity in heavier individuals. Maximum median values of AUC (990.0 ppm × min) and Cmax - 9.0 ppm were recorded in the group with BMI > 29 kg/m², where the proportion of responders reached 80.0% (n=4 out of 5). A delay in metabolic response was also noted in this group: median time to peak (Tmax) shifted from standard 90 minutes to 150 minutes. Nevertheless, according to the non-parametric Kruskal–Wallis test, the observed intergroup differences did not reach statistical significance for either AUC (p = 0.281) or Cmax (p = 0.509).
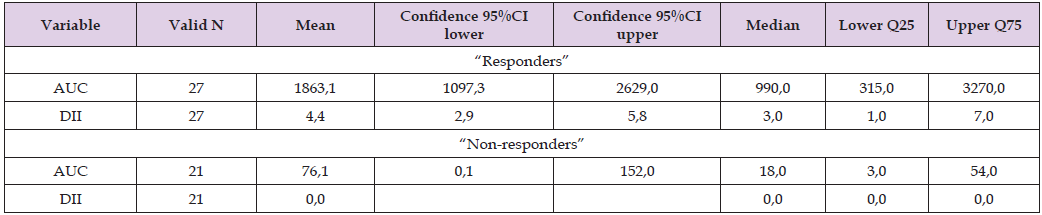
The index DII was calculated based on the survey. The resulting values are presented below (Table 7). As the table shows, the mean of 2.7 and the median of 1.0 indicate a neutral index characteristic (Average or neutral +2). However, note the high extreme values (Q75=4,5), which indicate cases with a proinflammatory index (High or pro-inflammatory). Figure 1 shows the relationship between DII and AUC. The basic equation of the presented linear correlation is DII = 1,1128+0,0013*x; 0,95 Conf.Int. AUC:DII: y = 1,1128 + 0,0013*x; Correlation between DII values and AUC r = 0,64; p = 0,00001; concordance r2 = 0,41, (56.3%, n=27) with a mean peak concentration of 27.17 ± 31.27 ppm (range: 5.0–153.0 ppm). The analysis of indices in the groups “Responders” and “Non-responders” on induction ketosis shown in (Table 8). As shown in Table 8, the group of responders to ketosis induction with the amino acid lysine had significantly higher AUC (p < 0,05) values compared to the non-responder group. Moreover, the DII index in the responder group was closer to proinflammatory values (mean = 4,4 and Q75 =7,0) Furthermore, in the responder group, there were five cases (10,4% Exact 95% C.I. (Fisher’s) = 3,5 - 22,7) with extremely high ketosis induction, while in the non-responder group, there were four cases (8,3% Exact 95% C.I. (Fisher’s) = 2,3 - 20,0) with a complete absence of ketosis throughout the entire period., often associated with successful ketosis where your body relies on fat for energy instead of carbohydrates. Ketosis induction with the amino acid lysine had significantly different. A breath acetone reading of 10 parts per million (ppm) indicates that persons are in a moderate to high fat-burning state, often associated with successful ketosis where it’s body relies on fat for energy instead of carbohydrates. In Group 2 of 48 patients, exhaled ketone levels were within the 5-10 ppm range before lysine intake in 9 cases (subgroup 2.1) (18,8% with 95%CI (Fisher’s) = 8,9 – 32,6). They were within the 1.1- 4.9ppm range in 9 cases (subgroup 2.2) (18,8% with 95%CI (Fisher’s) = 8,9 – 32,6)., 1,0 ppm or lower in 27 cases (subgroup 2.3) 56,3% with 95%CI (Fisher’s) = 41,2 -70,5, and greater than 10ppm in 3 – 6,3% with 95%CI (Fisher’s) = 1,3 – 17,2.
Figure 1
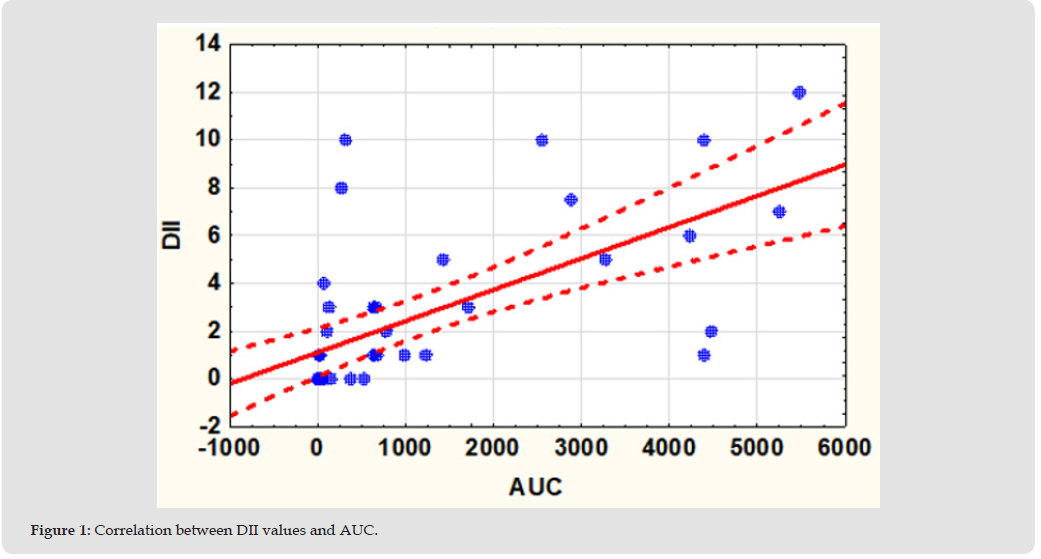
Table 7: DII Descriptive Statistics.

Table 8: Descriptive statistics of indices in two groups “Responders” and “Non-responders”.
Analytical Memo
Breath Ketone Kinetics Based on Baseline Metabolic Status To: Research Team / Clinical Report Subject: Comparative kinetic Analysis of Breath Acetone (BrAce) Dynamics Across Three Cohorts with Distinct Baseline Ketosis Levels Observation Period: 180 minutes (30-minute intervals). Introduction and Group Classification Experimental subgroups were stratified based on their baseline ketone concentration (at time t=0), which directly reflects the initial rate of fat oxidation: SubGroup 2.1 (C₀ = 5.8 ppm): Optimal Ketosis Status (Target range: 5–10 ppm). This represents a stable and active fat-burning state (“moderate to high fat-burning state”), where the body reliably utilizes fatty acids as its primary energy source instead of carbohydrates. SubGroup 2.2 (C₀ = 2.8 ppm): Mild/Early Ketosis Status (Target range: >1 but <5 ppm). This profile is characterized by a slower rate of lipolysis (“slow pace fat burning”). The baseline value of 2.8 ppm sits just above the physiological threshold of 2 ppm that marks the onset of early ketosis. SubGroup 2.3 (C₀ = 0.3 ppm): Non-Ketotic Status (Target range: 0–1.9 ppm). The metabolic system relies fully on carbohydrate metabolism; endogenous lipolysis pathways are completely inactive (“body fat is not burning”).2. Kinetic Summary Table Parameter SubGroup 2.1 (Optimal Ketosis) SubGroup 2.2 (Mild Ketosis), SubGroup 2.3 (Non-Ketotic) Baseline Level (C₀, ppm)5.82.80.3. Peak Concentration ((Cmax), ppm 25, 212,74.2. Time to Peak (\(Tmax), minutes 150,180. Total Exposure (AUC₀₋₁₈₀, ppm/ min) 2872.5, 1533.0, 301.53. Comparative Analysis of Kinetic Profiles Concentration (ppm).
Demonstrates a classic metabolic curve with a well-defined saturation phase followed by the onset of elimination. Over 150 minutes, breath ketone levels expanded 4.34-fold from the baseline. Interpretation: The subjects were already metabolically adapted to fat oxidation. The experimental stimulus or ongoing fasting/exertion triggered a powerful, synergistic surge in ketone production. Beyond 150 minutes, physiological clearance or tissue utilization mechanisms took effect (marked by a drop from 25.2 to 20.9 ppm, with an estimated post-peak half-life of t1/2 approx 111.14 min. SubGroup 2.2: Continuous Accumulation Profile (Mild Status) Dynamics: Exhibits a steady, linear escalation throughout the entire session. By minute 180, levels increased 4.53-fold to reach 12.7 ppm. Interpretation: Because Tmax is artificially truncated by the 180-minute study cutoff, the true physiological peak was not captured. The metabolic shift occurs at a slower pace; the cohort only crossed into the deep therapeutic fat-burning zone (>10 ppm) at the end of the third hour. The cumulative exposure (AUC) was 46.63% lower than that of SubGroup 2.1 and SubGroup 2.3: Delayed Induction Profile (Glycolytic Status) Dynamics: Shows virtually no response in the first 60 minutes (flatlining between 0.3– 0.9 ppm), confirming that lipolysis was initially locked. A measurable shift only emerges after the 90-minute mark (1.9 ppm), climbing to a modest 4.2 ppm at the final milestone. Interpretation: The subjects operated strictly on carbohydrate pathways at baseline. The first 1.5 hours were spent depleting hepatic glycogen reserves.
A weak transition to lipolysis only initiated around 150–180 minutes (“early ketosis starts at 2 ppm”). Total ketone production (AUC) is profoundly low—standing 89.50% below SubGroup 2.1. Relative Disparities (Focus on SubGroup 2.3). Contrasting SubGroup 2.3 against the more active metabolic cohorts highlights a massive deficiency in ketogenesis: SubGroup 2.3 vs. SubGroup 2.1 (Polar Extremes): Peak concentration (Cmax) is 83.33% lower. Total metabolic fat-burning exposure (AUC₀₋₁₈₀) is 89.50% lower. SubGroup 2.3 vs. SubGroup 2.2 (Transition States): Peak concentration (\(C_{max}\)) is 66.93% lower. Total exposure (AUC₀₋₁₈₀) is 80.33% lower.Key Conclusions and Recommendations Predictive Power of Baseline Values (C₀): Initial breath acetone concentration heavily dictates the velocity and magnitude of subsequent ketogenesis. Higher baseline levels signify an open metabolic pathway that responds rapidly and intensely to fat-burning stimuli.Carbohydrate Inertia: SubGroup 3 illustrates “glycolytic resistance.” To trigger meaningful lipolysis, individuals in this category require a significantly extended protocol (well beyond 180 minutes), as glycogen reserves act as a protective buffer delaying the onset of ketogenesis. Study Design Recommendation: For future iterations involving SubGroup 2.2 and SubGroup 2.3, it is highly recommended to extend the tracking window to 240–300 minutes. This extension will accurately capture their true (Cmax) and\(Tmax) values, as well as clarify their post-peak elimination rates.
For decades, classical bioenergetics has viewed ketogenesis through a restrictive homeostatic lens, treating it as an emergency backup fuel system triggered exclusively by severe glucose deprivation or systemic free fatty acid overload. The results (on patients with unclassified functional gastrointestinal disorders (such as unclassifiable IBS with overlap with dyspepsia, or “practically healthy” in terms of organic pathology, no clinically expressed chronic and acute distress) of this investigation demonstrate that a single oral dose of L-lysine (2.0 g) reliably induces physiological ketosis under euglycemic conditions without dietary lipid modification, establishing a novel functional framework for assessing metabolic flexibility. Our findings directly challenge this rigid paradigm. Because L-lysine is an exclusively ketogenic amino acid, its mitochondrial catabolism yields acetyl-CoA and acetoacetyl-CoA the Lysine-Induced Ketosis. Test is a valid, sensitive, and reproducible metabolic challenge test capable of inducing a highly controlled, statistically significant (p < 0.0001\)) ketogenic response over time. directly, bypassing the reversible, rate-limiting checkpoints of carbohydrate metabolism. The highly significant, non-linear wave-like kinetics observed via repeated measures ANOVA (F=3.924, p = 0.0012) provide crucial insight into intermediate substrate processing. The early significant “dip” in breath acetone at 60 minutes (p = 0.025) represents a baseline utilization window, wherein peripheral tissues actively consume circulating ketones faster than the initial hepatic synthesis rate. The subsequent recovery and stabilization at 90 minutes mark the zenith of hepatic production, demonstrating that physiological ketosis can operate as a dynamic signaling vector independent of nutritional or energy crises.
A core finding in patients with is the robust positive correlation between Basal Metabolic Rate (BMR) and primary ketosis indices (AUC, (r = 0.66, p < 0.001); (Cmax, r = 0.44, p = 0.028). BMR serves as a macroscopic proxy for global mitochondrial density and baseline metabolic activity. Since the entire enzymatic machinery required to convert L-lysine into acetoacetate and acetone resides within the mitochondrial matrix, an elevated baseline metabolic rate naturally facilitates a more pronounced, seamless ketogenic response. It is worth paying attention to the contradictory data obtained: Crucially, this ketogenic capacity demonstrated no statistical relationship with structural liver metrics, including cytolysis enzymes (ALT, AST) or transient fibroelastometry parameters (liver stiffness and CAP fat scores, \ (p > 0.05). This phenotypic independence indicates that the oral L-lysine challenge functions as a live functional proxy of hepatic mitochondrial reserve rather than a marker of structural tissue damage. It shifts the clinical diagnostic focus from static organ damage to active metabolic plasticity. It is worth paying attention to the somewhat contradictory data obtained: Waist/Hips (W/H) index, reflecting visceral fat distribution, significantly and positively correlated with AUC (rho = 0.45), (p = 0.024) and Cmax (rho = 0.41, (p = 0.042)). In contrast, isolated hip circumference and Fat Mass (FM, %) showed an inverse relationship with the total area under the curve (AUC: (rho = minus 0.42), (p = 0.037) and AUC = minus 0.33 (p =0.046) for FM%.
A statistically significant, moderate direct correlation was identified between Total Cholesterol levels and the total ketone exposure, but not for Hemoglobin, Total Protein, ALT, Urea, AST, Creatinine, CRP, WBC, Total Bilirubin ESR. Metabolic Test (lysine ketosis) Validity: The Lysine-Induced Ketosis Test is a valid, sensitive, and reproducible metabolic challenge test capable of inducing a highly controlled, statistically significant ((p < 0.0001) ketogenic response over time. By comprehensive mapping of two distinct cohorts via bioimpedance vector analysis (BIA-V), liver transient fibroelastometry, and systemic inflammatory profiling, this study uncovers the intricate pathophysiological determinants of non-dietary ketogenesis. When assessing the anthropometric drivers of ketogenesis in Group 2, an intriguing statistical paradox emerged. Linear Pearson correlation indicated a weak but significant direct relationship between AUC and BMI (r = 0.310, p = 0.034) as well as total weight ((r = 0.316, p = 0.029). However, non-parametric Spearman rank analysis completely obliterated these relationships ((p > 0.20), proving that the linear model was highly sensitive to extreme weight values (outliers) within the cohort. This is further supported by the sub-group analysis by BMI ranks. Although individuals with clinical obesity (BMI (> 29 kg/m2) exhibited the highest absolute median values (AUC = 990.0 ppm\tmin}\), (Cmax = 9.0 ppm), the overall intergroup differences failed to reach significance under the Kruskal–Wallis test (p for AUC = 0.281), (p for Cmax = 0.509).
Nevertheless, a profound physiological shift was observed in this heavy sub-population: the median time-to-peak (Tmax) shifted from the standard 90 minutes to a delayed 150 minutes. This phenomenon strongly validates the concept of “metabolic sluggishness” associated with insulin resistance and subclinical metabolic syndrome. While the absolute hepatic enzymatic capacity to synthesize ketone bodies from amino acid substrates remains intact in heavier individuals, the cell signaling networks governing rapid substrate switching operate with substantial operational latency. The Inflammatory Counter-Response: Unpacking the Dietary Inflammatory Index (DI)-AUC Correlation. One of the most compelling findings of this study is the highly significant positive correlation between the Dietary Inflammatory Index (DII) and total ketone exposure (AUC: (r = 0.64, r^2 = 0.41, p = 0.00001). Furthermore, the stratified analysis demonstrated that the “Responder” cohort possessed a distinctly pro-inflammatory dietary background (mean DII = 4.4), whereas the “Non-responder” cohort exhibited a perfectly neutral baseline (mean DII = 0.0). At first glance, this presents a physiological paradox, as ketone bodies are renowned for their potent anti-inflammatory properties, specifically their capacity to block the NLRP3 inflammasome. However, from a systems-biology perspective, this direct correlation likely reflects a compensatory evolutionary mechanism. Individuals chronically exposed to a pro-inflammatory diet undergo sustained cellular stress, which acts as an epigenetic primer, upregulating endogenous protective pathways.
When challenged with an acute, clean ketogenic substrate like L-lysine, these “primed” cells mount a hyper-reactive, compensatory ketogenic surge to restore homeostatic balance and suppress systemic low-grade inflammation. Conversely, the blunted response in the Non-responder group (mean Cmax = 0.9 ppm) suggests a state of metabolic neutrality where the immediate cellular demand for anti-inflammatory signaling molecules is low, or conversely, a state of latent metabolic inflexibility where signaling cascades are under-reactive. However, the anti-inflammatory effect of ketones has been described with additional administration of ketone [13-14]; in our study, the emphasis is on physiological ketosis. In standard human physiology, the ingestion of a mixed-macro meal triggers immediate insulin secretion, which serves as a definitive, upstream inhibitor of hepatic ketogenesis. However, our study revealed an extraordinary, highly significant positive correlation between total test ketosis (AUC) and the 30-minute postprandial residual ketone levels (r = 0.938, p < 0.000).
The fact that high-responding individuals maintained robust circulating and exhaled ketone levels even after food intake suggests that L-lysine-induced physiological ketosis possesses unique temporary resistance to acute insulin-mediated suppression. This operational stability reinforces the role of these specific amino-induced ketones as durable, reliable signaling molecules rather than highly volatile, easily disrupted starvation byproducts. This stability offers a monumental advantage in resolving the “keto-intolerance” dilemma in clinical practice. While the therapeutic benefits of ketosis in treating neurodegeneration (e.g., Alzheimer’s disease) and metabolic syndrome are heavily documented, classical high-fat ketogenic diets are strictly unfeasible or hazardous for millions of patients—particularly those with cholecystectomy, advanced renal failure, or specific APOE4 lipid-clearing mutations. By utilizing an isolated, eoglycemic L-lysine protocol, clinicians can safely circumvent the risks of fat overloading while successfully accessing the therapeutic, anti-inflammatory, and neuroprotective cascades of physiological ketosis.
Dynamics Across Three Cohorts with Distinct Baseline Ketosis Levels Observation Period: 180 minutes (30-minute intervals). Introduction and SubGroup Classification Experimental subgroups were stratified based on their baseline ketone concentration (at time t=0), which directly reflects the initial rate of fat oxidation: SubGroup 2.1 (C₀ = 5.8 ppm): Optimal Ketosis Status (Target range: 5–10 ppm). This represents a stable and active fat-burning state (“moderate to high fat-burning state”), where the body reliably utilizes fatty acids as its primary energy source instead of carbohydrates. SubGroup 2.2 (C₀ = 2.8 ppm): Mild/Early Ketosis Status (Target range: >1 but <5 ppm). This profile is characterized by a slower rate of lipolysis (“slow pace fat burning”). The baseline value of 2.8 ppm sits just above the physiological threshold of 2 ppm that marks the onset of early ketosis. SubGroup 2.3 (C₀ = 0.3 ppm): Non-Ketotic Status (Target range: 0–1.9 ppm). The metabolic system relies fully on carbohydrate metabolism; endogenous lipolysis pathways are completely inactive (“body fat is not burning”) [18,17] 2. Kinetic Summary Table Parameter Sub- Group 2.1 (Optimal Ketosis) SubGroup 2.2 (Mild Ketosis), SubGroup 2.3 (Non-Ketotic) Baseline Level (C₀, ppm) 5.82. versus 80.3. Peak Concentration ((Cmax), ppm 25, versus 212, and 74.2. Time to Peak (Tmax), minutes 150, versus 180. Total Exposure (AUC₀₋₁₈₀, ppm/ min) 2872.5, versus 1533.0, and 301.53.
Paradigmatic Validation: Oral administration of an acute L-lysine challenge (2.0 g) successfully induces physiological ketosis under eoglycemic conditions without the necessity of dietary carbohydrate restriction or exogenous lipid loading, serving as a valid functional test for metabolic flexibility. Kinetic Characteristics: The induced ketosis exhibits a distinct, statistically significant non-linear wave-like kinetic profile (p=0.0012) across time, characterized by a baseline peripheral utilization “dip” at 60 minutes followed by a primary hepatic metabolic peak near 150 minutes. Mitochondrial Proxy: Total ketone exposure (AUC) and peak response (Cmax) are directly driven by an individual’s functional baseline metabolic rate (BMR; (r=0.66), (p<0.001), rather than static anthropometric indexes like BMI or structural liver characteristics, rendering the test a viable non-invasive proxy for live hepatic mitochondrial reserve. Phenotypic and Inflammatory Stratification: The challenge uncovers distinct personalized phenotypes (“Responders” vs. “Non-responders”) independent of age or weight. The strong direct correlation between the Dietary Inflammatory Index and (AUC) ((r=0.64), (p=0.00001) reveals that a pro-inflammatory dietary background acts as an epigenetic primer, triggering a robust, compensatory anti-inflammatory ketogenic response. Metabolic Sluggishness: While absolute ketogenesis capacity remains intact in obese cohorts (BMI >29 kg/m²), they exhibit a distinct phenotype of “metabolic sluggishness” with a delayed time-to-peak ((Tmax) shifted to 150 min, signaling latency in substrate-switching pathways. Clinical Utility: High postprandial stability of the induced ketones (r=0.938), (p<0.0001) demonstrates temporary resistance to immediate insulin-mediated suppression, validating this method as a safe, practical alternative to activate therapeutic signaling ketosis in clinical populations intolerant to classic high-fat ketogenic diets/.
Despite the highly significant correlations and clear novelty, certain limitations must be acknowledged. Both studied cohorts were heavily skewed toward female participants (\(>90\%\)), meaning these exact kinetic profiles and phenotypic distribution rates require further validation in broader male populations. Furthermore, while breath acetone captured via KETONIX® represents a verified, non-invasive proxy for systemic ketogenesis, concurrent evaluation of serum (beta-hydroxybutyrate and targeted genomic screening for PGC-1(alpha) or FGF21 polymorphisms would provide absolute mechanistic confirmation of the intracellular pathways involved.

International Association of Landscape Archaeology, Czech Glass Society, Czech Republic

Department of Chemistry, Semenov Institute of Chemical Physics, USSR Academy of Sciences, Moscow, Russia

Department of Educational Sciences, Research Centre Qualities of Teachers, School of Education – HAN, Nijmegen, Netherlands

Associate Professor at Department of Breast and Thyorid Surgey, Chongqing General Hospital, China

Neurology, LA BioMed Research Institute, USA





 Abstract
 PDF
PDF