info@biomedres.us
+1 (502) 904-2126
One Westbrook Corporate Center, Suite 300, Westchester, IL 60154, USA
Site Map

Received: October 03, 2018; Published: October 15, 2018
*Corresponding author: Mirjana Dimovska, Institute of Public Health of Republic of Macedonia, Skopje
DOI: 10.26717/BJSTR.2018.10.001887


Background: In regard the broad range of adverse health outcomes related to exposure to particulate air pollution, there are only few epidemiological data to be found for the countries of the former Yugoslav republics. Particulate outdoor air pollution is a major public health concern in the cities of former Yugoslav Republic of Macedonia. Objective: To estimate the range of attributable deaths of outdoor air pollution by particulate matter (PM25), and health gains from implementation of targeted policy that would reduce the concentrations to EU or WHO limit values. Methods: Health Impact Assessment, the counterfactual approach has been applied. To estimate the health gain three hypothetical scenarios were set up. Results: In selected cities 1,903 human lives (excess deaths) are lost annually due to PM25 exposures (22.3% of total all-cause (natural) mortality). The mortality rate attributable to PM25 exposures (per 100,000 populations) is highest in the city of Tetovo 301; Bitola 234; Skopje 208. If the limit values of the PM25 particles comply with the existing EU and WHO limit values, 908 lives could be saved, and 1547 respectively. Estimated excess deaths caused by lung cancer attributable to PM2 5 are 181 representing 40.0% of the total mortality. Conclusions: The estimated impact on mortality and health gains of potential reduction policies are of high significance. Despite the limitations, this assessment provides valuable input to national and local authorities to become aware about the magnitude of the problem.
The scientific evidence of disturbing links between air pollution and health continues to build. Air pollution is the largest contributor to the burden of disease from the environment, causing and exacerbating several diseases ranging from asthma to cancer, pulmonary illnesses and heart disease. Air pollution affects all regions, settings, socioeconomic groups, and age groups [1]. Urban air quality will continue to deteriorate globally. By 2050, outdoor air pollution (particulate matter and ground-level ozone) is projected to become the top cause of environmentally related deaths worldwide [2]. According to World Health Organization (WHO), in 2012, one out of every nine deaths was the result of air pollution-related conditions. Of those deaths, around 3 million are attributable solely to ambient (outdoor) air pollution [3]. The vast scientific literature on the subject includes epidemiological, clinical and toxicological studies, and research has systematically documented a broad range of adverse health outcomes, ranging from respiratory symptoms to mortality from cardiopulmonary diseases and lung cancer
Numerous epidemiological studies have been conducted to quantify the burden of diseases due to ambient air pollution, starting in 1952, the "Great Smog" in London, when an increase in cardiovascular mortality and deaths due to respiratory diseases has been observed. Follow-up studies in the 1990s, such as the Harvard Study of the Six Cities and the cohort study of the American Cancer Society (ACS study), have confirmed the permanent positive association between long-term exposure to air pollution and total cardiovascular mortality, mainly due to coronary artery disease [4], until the first study in Europe, the Dutch Cohort Study of the Nutrition and Cancer Association [5]. REVIHAAP (Review of evidence on health aspects of air pollution) and HRAPIE (Health risk of air pollution in Europe) WHO projects, confirmed that ambient air pollution is an important risk factor for human health [6,7].
Only a few data from epidemiological studies could be found for the countries of the former Yugoslav republics in terms of air pollution levels and health outcomes because of population exposure at those levels. From the countries in the region, one study has been carried out on the relationship between certain pollutants (PM10, NO2, SO2) and the effects on cardiovascular and mortality from respiratory diseases in Belgrade, Serbia, where they have found an increase in mortality of 1% for short-term exposures of PM10, SO2 and smoke [8]. A World Bank study (2012) confirms that air pollution in Macedonia is one of the highest in Europe and that PM2 5 particles in the ambient air are responsible for more than 1 350 deaths, that rank the country on the fifth place within the European countries. Regarding spatial representation, 45% of the burden of diseases (the overall health impact and health outcomes) are in the capital, the City of Skopje [9]. A reduction of even 1 μg/ m3 in ambient PM10 or PM25 would imply 195 fewer deaths and economic savings of €34 million per year due to reduced health costs [10].
The sources of ambient particulate matter air pollution in the country in 2014 according to the sectors, are the following: residential heating, industrial processes and energy production with an individual share of 36%, 33% and 20% of the total primary emissions. The traffic contributed with 2% of the total emissions of PM particles. In the source apportionment study for the City of Skopje conducted in 2015/16, that determines the shares of the various sources of emissions in the suspended particulate concentrations was shown a significant share of biomass burning originating from household heating (32-36%), traffic with a share of 16-19%, road dust 19-20%, and the industry with a share of 18% of the total particulate matter concentrations [11]. As a result of the findings based on numerous epidemiological studies and current scientific knowledge, it is expected that the conditions of air quality in the Republic of Macedonia in the last few years will lead to further deterioration of the health status of the population and appearance of harmful, adverse health effects, as well as to economic losses due to direct costs associated with the increased need for health services, the use of medicines, absenteeism (from work and school), losses due to a premature loss of active years of life, etc. The air quality in Macedonia gives a reasons for concerns due to clear exceedance of the EU air quality standards for particulate matter (PM2 5 and PM10).
The quantification of the contribution of exposure to certain environmental stressors on mortality or overall on the burden of disease at the national or local level, can play a key role in creating public health policies and setting priorities, including environmental policies. According to the World Health Organization, 'Health Impact Assessment (HIA) is a practical approach used to judge the potential health effects of a policy, programme or project on a population, particularly on vulnerable or disadvantaged groups' [12].The main objective of the paper is to assess the effects of the polluted ambient air with particulate matter (PM2 5) on the all-cause mortality and specific mortality in selected cities in the Republic of Macedonia, and to assess the health gain and effect of the well-being of the population from implementation of targeted policy and actions that would reduce the concentration of suspended particles to the EU and/or WHO limit values. The research question is how many lives could be prevented/saved in selected cities if concentration of pollutants (PM10 or PM2 5) will be reduced to EU or WHO air quality limit values.
Aiming to assess the burden of diseases attributable to air pollution in the country, Health Impact Assessment - the counterfactual approach has been applied, using environmental data for population exposure of PM25 as input data for the calculations, obtained from the State Air Quality Monitoring network of Ministry of Environment and Physical Planning. Since the health impact of polluted air was assessed through the mortality as a main health outcome, demographic data and data for all-cause mortality and specific mortality were obtained from the State Statistical Office, PM2 5 particles are selected as a main stressors of concern, due to increasing trends in the last few years and serious exceedance of the EU and WHO limit values. HIAs generally apply concentration-response functions based on risk estimates from the existing epidemiological studies. These functions are used aiming to correlate exposure estimated by air pollution assessment and the scenarios for air quality changes to a population at risk and its baseline health status [13]. To assess the contribution of the particulate air pollution as a growing public health concern on the mortality, we have applied the methodology in which population exposure data and relative risk (RR) for selected health outcomes derived from epidemiological studies are used to calculate Population attributable fraction (PAF) [14].
The PAF calculation is shown in the following formula:
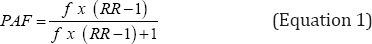
where f is the fraction of the population exposed, obtained from the latest Census of the population (2002), and relative risk (RR) for selected health outcome derived from the epidemiological studies. Whilst epidemiologists often study the risk of a disease in the presence of exposure compared to risk of a disease in the absence of exposure, in health impact assessment on the other hand often asks how many excess cases of disease will occur in a population of a certain size due to exposure at a given exposure level [15]. The health impact of PM refers to the proportion of ill health that is attributable to the PM concentration observed in each city or population. This is the amount of mortality and disease that would be prevented if PM were totally removed, which is an (unrealistic) counterfactual scenario of zero exposure [16].
To calculate the number of attributable extra deaths, the estimated mortality at no exposure (PM concentrations of 0.0 Hg/m3), a hypothetical scenario (counterfactual scenario 1), is deducted from the observed mortality at observed exposure levels. This scenario has been applied in the EBD study in six European countries, where no threshold was used, and levels were compared to a scenario in which air pollution levels is reduced to zero [14]. To estimate the potential health gain of reducing the exposure to PM, and/or to assess the benefit of the potential reduction strategies and actions in the future, we set up two other exposure scenarios. The observed mortality rate associated with the current exposure of suspended PM25 in ambient air will be compared with the estimated mortality rate for exposure to concentrations corresponding to EU limit values (25 |ig/ m3 PM25, from Directive 2008/50/EC) and WHO target value (10 μg/ m3 PM25 in WHO Air Quality Guideline - WHO AQG) - counterfactual scenario 2 and 3.
The study period is five years (2012-2016).
For Health Impact Assessment of the air pollution in selected cities in this study, the measurement data from monitoring stations within the State Automatic Ambient Air Quality Monitoring System of Ministry of Environment and Physical Planning have been used. The number of stations satisfies the minimum number of stations at the national level and complies with the requirements of the European Directives and national legislation [11]. The characteristics and type of monitoring stations are given in Table 1. The study used data from 13 monitoring stations, out of 17. The inclusion criterion for the monitoring station is to provide data for at least 60% of days in the year, during the observed period of 60 moths. The measurement methods and quality control of the measurements are in accordance with the European CEN standards (with the reference method MKC EN 12341: 1998; MKC EN 14907: 2005) [17]. Overall six pollutants are measured hourly, but not all monitoring stations measure all pollutants (PM2 5 PM10, O3, NO2, SO2 and CO).
Table 1: Monitoring stations from the Automatic Ambient Air Quality Monitoring System, type and characteristics.

Monitoring stations in the City of Skopje have good data coverage (from 70.0% to 100%), as well as Tetovo where the coverage in this period was 88.3%. Exception is the monitoring station in Kocani, Kavadarci and the rural background station in Lazaropole, with coverage of 51.7%, 55.0% and 46.7% of the study period. In the study, for these two cities calculations were used due to the large number of missing data. Missing data are calculated from the average concentrations of PM10 measured in the respective month using the data from the other years at the same monitoring station Table 2. Overall, the correlation in PM data between the different monitoring stations is high. The correlation in PM25 between the two stations in Skopje was very high (R2>90%), the same applied to the PM10 stations within the City of Skopje, while the monitoring station outside Skopje (Skopje Region) showed generally inter-correlations higher than 70%. Only PM10 data from Kavadarci station had poor correlation with the other stations (R2<40%), while the rural background station of Lazaropole located on a mountain, showed an inverse correlation with the other monitoring stations. However, high PM2 5 and PM10 inter-correlations suggest that PM10 data can be used to improve spatial coverage of PM25 data [18].
Table 2: Annual mean concentrations of PM , for the period 2012-2016.

NOTE: e* (estimation); ayears with many missing data; bBitola 2 functional only 2015 and 2016.
Annual mean values of PM2 5 are approximately two thirds of those of PM , however, the temporal and spatial variations could be significant. According to the CAFE Working Group, in 2004 mean PM25/PM10 ratio in Europe range from 0.4 to 0.8, depending on the type of site. At urban background sites the ratio ranged from 0.40.5 (Canary Islands and Southern Spain), while in the Netherlands, Berlin, Northern and Central Spain the ratio is 0.8 [19]. The same temporal and spatial variability and trends in the PM25/PM10ratio has been demonstrated in the latest study in United Kingdom for the period 2010-2014 [20]. In Macedonia, PM2 5 are measured routinely only in two monitoring stations in the City of Skopje (Center and Karpos). For the other cities (Table 3), the formula from the HRAPIE study (Health risks of air pollution in Europe) [7] was applied. This ratio is considered an average for the European population by the HRAPIE report, where:

The PM2 5/PM10 ratio in the City of Skopje based on the measured concentrations in the automatic monitoring stations in the five-year period covered by the analysis, ranges from 0.27 to 0.8 (average 0.57). To avoid the variation in the pollutant concentration due to some partial policy actions undertaken or due to meteorological factors (years with abnormal or higher levels of air pollution), the study used five-years mean data values (Table 3).
Table 3: Annual mean concentrations of PM2 5, for the period 2012-2016

NOTE: e* (estimation)
According to the State Statistical Office (the last Census, 2002), the total population in Macedonia is 2,022,547, from which 60% inhabit the urban areas. The average population density is 79,8 inhabitants/km2, while the City of Skopje as the capital and the biggest city of the country, with total population of 506,926 (population density of 3,603/km2), is one of the densely populated cities in the country where 25.1% of the total population live. The location of Skopje in a valley surrounded by mountains, in combination with weak winds and frequent periods of temperature inversion trap the pollutants and cause dangerously high concentrations at times. This paper covers the population of seven cities in the Republic of Macedonia, where increased concentrations of PM particles above the limit values of the national legislation (which is in line with the EU legislation), are measured. The total study population is 887,885 inhabitants (43.9% of the total population) from the following cities: The City of Skopje (ten municipalities, without suburban municipalities), Bitola, Veles, Kavadarci, Kicevo, Kocani and Tetovo for which environmental data and data from vital statistics (mortality) were available. Demographic data obtained from State Statistical Office were disaggregated by sex (Table 4), while monthly mortality data were disaggregated by sex and age (age groups) respectively.
Table 4: Population data for selected cities in Macedonia, by sex.

Mortality data of interest for selected cities divided by age (i.e. age groups), but for the objectives of the study we analyzed the age group >25 years (due to availability of the data from State Statistical Office and their age groups disaggregation). Mortality data are classified according to ICD10 code (International Classification of Diseases, 10th revision). All-cause mortality (excluding external causes of death, A00-Y89 excluding V01-Y89), as well as specific mortality data (cardiovascular mortality I00-I99, respiratory mortality J00-J99; and malignant neoplasms of larynx, trachea and lung C32-C34) have been selected as health outcomes, due to the strong scientific evidence of causality, based on a number of conducted impact assessments of particulate polluted air. Table 5 presents the all-cause (natural) mortality and its distribution by place of living/residence and by sex. To make a comparison based on residence, a mortality rate per 100,000 inhabitants is calculated. The higher mortality rates in Bitola, Veles and Kavadarci could be explained by the higher fraction of population over 65 years old (ranging from 14.7-15.8%), and opposite to that, the lower fraction of the population of 0-14 years (14.6-15.6%), compared to the national average, where the fraction of this age groups is 13.3% and 16.6%. The city of Tetovo has the lower fraction of elderly (65 and over) - 9.6%, and highest fraction of population aged 0-14 related to the other cities above (18.4%). Analysis of the socioeconomic status of the population in selected cities, the level of education or their individual life styles could explain those differences as well.
Table 5: All-cause (natural) mortality in selected cities, for the period 2012-2016.

For the purposes of Health Impact Assessment of air pollution in this study, concentration-response risk coefficients (CRFs) derived from the epidemiological studies and evidence have been used. Concentration-response functions are often expressed in terms of the relative risk (RR) for a unit change in concentration. The relative risk applied in this study given for selected health points with confidence intervals (95% CIs) are summarized in Table 6. The RR is the increase in the probability of occurrence of the adverse health effect associated with a given change in exposure level (typically 10 ng/m3 for PM). Health impacts of air pollution increase strongly above 30 years of age. After infancy, at younger age groups (5-30 years) mortality is rare, while for other age groups (<5 and >30 years) it is the dominant endpoint [21.
Table 6: Summary of RR (95% CI) used in the study for PM 5 as a selected stressor.

Applying a counterfactual approach for health impact assessment in this study, we compare the current health status of the population to a hypothetical one when the same population has not been exposed. To generate estimates, a population attributable fraction as an epidemiological concept has been used. Several calculations presented in Tables 7-10 have been made, were the number of extra deaths for a certain health outcome had been calculated as the difference from the number of deaths in exposure to current air quality (observed death rate), with the calculated/the predicted mortality rate in the so-called counterfactual scenario 1 (a hypothetical "natural" background, i.e., the level that will exists without any man-made pollution). To assess the health benefits, the observed mortality rate as a result of the current exposure of suspended PM25 particles in ambient air was compared to the predicted mortality rate for exposure to concentrations that correspond to EU limit values (25 ng/m3, target value from Directive 2008/50/EC) and WHO (10 ng/m3, target value from WHO AQG). Table 8 HRAPIE experts recommended estimation of mortality effects in adult populations (age 30+ years) as most relevant indicator since most of the health effect evidence comes from studies focused on populations in this age group [7]. The average mortality (adults, 25+) for the observed five-year period in the selected cities in Macedonia is 8,535 (All-cause mortality, except external). If expressed in absolute numbers, 1,903 human lives (additional, extra deaths) (CI95% 1296 to 2429) in the selected cities are lost annually, attributable to exposure to current levels of PM25 particles in ambient air, which is 22.3% of the total all-cause deaths (excluding external). Annually, 908 lives could be saved if the PM25 concentrations are brought to the EU limit value, and a total of 1,547 lives respectively if the WHO limit values are reached (Tables 7 & 8).
Table 7: Five-year all-cause mortality and deaths attributable to PM 5 air pollution.

NOTE: aA00-Y89, excluding V01-Y89
Table 8: Potential health benefits of reducing annual PM 5 levels in terms of total non-external mortality.

NOTE: aRisk based on fixed measurements of PM2.5 (the rest is based on estimations of PM2.5). bPopulation attributable fraction LV = Limit values
The findings of the study conducted in Sao Paulo, Brazil show that reaching WHO standards of PM25 (10 ng/m3), the city would avoid more than 5,012 premature deaths (equivalent to 266,486 life years' gain), life expectancy would have increased by 15.8 months and money saving would be US$ 15.1 billion annually [22]. Though attributable death in epidemiology refers to the number of (premature) deaths attributable to the factor(s) of interest, this does not mean that removal of exposure will permanently reduce the number of death. Deaths are due to happen anyway but can be postponed, and exposure to air pollution is only one of several risk factors that can contribute to development of chronic diseases and ultimately death [23]. The impacts vary proportionately due to the linear association between concentrations and adverse health effects. As no thresholds is known for the adverse health effects of PM10, any additional reduction in concentrations down to the natural background level of 6-7 ng/ m3 of PM10 would result in health gains [16]. Having in mind that IARC (International Agency for Research on Cancer) in 2013 classified air pollution mixture and particulate air pollution as a carcinogenic to humans (Group 1) [24], it is expected that impact of the particulate air pollution in the country on the occurrence of malignant neoplasms of the respiratory system and its mortality, will be significant.
In accordance to this, extra deaths caused by lung cancer in the selected cities that could be attributed to polluted air with suspended PM25 particles are 181 (95% CI 70 to 255), representing 40.0% of the total mortality from this malignant disease (Table 9). However, temporality is an important factor in this assessments. According to authors of the Italian study, "It is correct to assume that reductions in average concentrations produce the estimated health gains. It is not possible to determine precisely the period of time over which these gains are achieved. This is especially uncertain for long-term mortality, because the induction time is not known. In the case of mortality from lung cancer, health benefits would follow reductions in concentrations with a substantial delay, while they would be almost immediate for acute effects, which represent most of the considered health effects" [16]. The reduction was observed specifically for deaths due to cardiovascular and respiratory disease and not from lung cancer, which is a disease with a longer period of latency and less reversibility. These findings suggest that the mortality effects of long-term air pollution may be at least partially reversible over periods of a decade [25].
Table 9: Potential health benefits of reducing annual PM 5 levels lung.

NOTE: aRisk based on fixed measurements of PM2.5 (the rest is based on estimations of PM2.5). bPopulation attributable fraction LV = Limit values
Table 10 presents the range of the health benefit for the population in selected cities if current concentrations of the pollutant are brought to the EU and/or WHO limit values in terms of cardiopulmonary mortality (ICD10 code I00-I99; J00-J99). As expected, the greatest losses (extra deaths per 100,000 population) are noticed in the cities with higher annual mean concentrations of PM25 - Tetovo, with 243 extra deaths and Kavadarci 180. By decreasing concentrations of particles to the limit values of EU or WHO, 14.3% and 23.6% respectively of the total mortality due to cardio-respiratory diseases will be avoided. Potential health benefits range from 11.5 to 381.9 lives (a total of 722) that would have been saved if the EU's limit values were reached, and from 38 to 646 (total 1,193) if reaching the WHO limit values. Global Burden of Disease Study 2015 (GBD), estimated that long-term exposure to ambient PM25 caused 4.2 million deaths and 103.1 million lost years of healthy life in 2015, which is 7.6% of total global mortality. Deaths attributable to ambient PM25 increased from 3.5 million in 1990 to 4.2 million in 2015. PM25 was the fifth-ranking global mortality risk factor. For the purposes of this study, integrated exposure-response functions (IERs) have been developed for each cause of death to estimate the relative risk of mortality over the global ambient annual mean PM25 concentrations. During this this calculations, the functions for the five causes of death (including high blood pressure, smoking ambient particulate matter pollution etc.) are non-linear, with a greater change in relative risk for lower concentrations compared with higher values [26].
Table 10: Potential health benefits of reducing annual PM2 5 levels

Regarding the choice of the stressor (pollutant), although in most of the studies the outdoor air pollution risk factor was PM10, a more accurate measure of the burden of disease would be PM2.5, concentrations which include fine particles and gaseous materials (NOx, Sox, CO, O3, etc.). Considering the possible harmful effects of PM2 5, the United States, European Union, and WHO have revised their recommended air pollution criteria (for example, the U.S. used ultrafine particles as a criterion of atmospheric environment). Korea has also attempted to include PM25 as a new criterion to improve atmospheric environment [27].
One of the limitations of this study is the fact that missing PM25 measurements may have an influence on the results if we use an approximation for the missing values of PM2 5, through the PM10/ PM25 ratios. Furthermore, the use of mortality data for the age group 25+ instead 30+ due to the availability of the data obtained from State Statistical Office, could be another limitation but not significant for the calculations. Chronic effect of PM25 particles is considered by estimating the number of extra deaths due to long-term exposure to polluted air. In contrast, morbidity can be considered in terms of short-term exposure to air pollution (e.g. number of hospital admissions for cardiorespiratory diseases, asthma and symptoms of bronchitis).
Today it is well known that chronic morbidity has a significant impact on health and the health system in addition to the acute effects of air pollution [28]. Finally, the high tobacco prevalence in the country (46.7% in men and 27.8% in women, 2016) and common exposure to environmental tobacco smoke should be considered [29]. In the EU-28, the number of premature deaths attributed to PM25 is 436,000, in relative terms, when considering YLL per 100,000 inhabitants. The largest impacts are observed in the central and eastern European countries where the highest concentrations are observed, i.e. Kosovo, Bulgaria, the former Yugoslav Republic of Macedonia, Poland, Serbia, Hungary, Romania, Greece, the Czech Republic and Slovakia. The premature deaths rate per 100,000 attributed to PM2 5 is highest in Kosovo - 194.4/100,000; Macedonia 162.9, Serbia 149.4 and Montenegro 96.6 per 100,000 respectively [30]. The findings of the EBD study for six European countries and nine stressors analyzed, show that exposure to PM2 5 is the most significant environmental factor affecting public health. Overall 67% of the estimated environmental burden of disease was explained to that exposure. Impact of the particulate matter are lowest in Finland and France, and the highest in Belgium and Italy which are known to be hotspots of particulate matter air pollution [14]. The current rate of premature deaths due to PM2 5 exposures in the City of Skopje is 208 (per 100,000), Tetovo 301, Kavadarci 220, while in Kocani taken as the control city in the study (with the lowest mean concentration of PM2 5,) the rate of extra deaths is 159/100,000. Compared to the calculations of the number of additional deaths in three European cities using the coefficients for CRFs from the ACS study, in Budapest, Hungary with PM2 5 annual mean concentration 34 μg/m3, the number of extra deaths was 4079 (353/100,000); in Paris the number of extra deaths was 3543 (91/100,000) with annual mean concentrations of 16 ng/m3, while in Stockholm with an average annual concentration of 9 μg/m3, there were 589 extra deaths (74/100,000). The study shows that using risk estimates from the European Study of Cohorts for Air Pollution Effects (ESCAPE) instead of the American Cancer Society (ACS) study could nearly double the attributable burden of ambient air pollution [31].
It should be noted that obtained results for the number of extra deaths in all studies are influenced by other factors, such as the age distribution of the population (those at older ages are at higher risks [31-33], the presence of larger groups of vulnerable population or population with a lower level of education [16] and lifestyle factors, such as smoking, time spent outdoors etc. In the Nordic region, the change in demography alone leads to a 20% increase in the PM-related mortality due to the increasing fraction of people older than 65 (60% grow) versus 10% increment of the total population [34]. Transition to healthy and sustainable societal and individual behaviors, calling for integrated measures both at a system and at a local level is recognized as an urgent need in the INHERIT Project. Coherent actions from governments, the private sector and citizens are needed [35].
The selection of mortality as the only health outcome for assessing the risks and benefits of actions in air pollution is the best choice given that it is available from the high-quality database of the State Statistical Office. The estimated impact on mortality is significant and not negligible. According to the findings and projections of this study in the selected Macedonian cities, 1903 lives annually are lost due to exposure to current levels of particulate air pollution, with highest burden from the total mortality in Tetovo, Bitola, Kavadarci and Skopje. The mortality rate attributable to air pollution (population weighted mortality) due to PM2 5 exposures (per 100,000 populations) is highest in the city of Tetovo 301; Bitola 234; Kavadarci 220 and Skopje with 208, while in Kocani selected as a control city in the study, the rate of attributable deaths is 159/100,000.
If the limit values of the PM particles comply with the existing EU limit values, 908 lives will be saved, and 1,547 respectively if the recommended maximum level of the WHO is reached. Using the counterfactual approach for Health Impact Assessment rather than a predictive one and quantifying the health burden due to air pollution, we want to urge and encourage the authorities to take actions. Air pollution policies are interlinked to policies and actions in many different sectors - energy sector, transport and trade, household and construction, agriculture and biodiversity etc. Thus, most of this measures will contribute to cleaner air and would have effects on the human health and well-being, benefits for the ecosystem, reinforced with sustainable individual behavioral changes in the areas of living, moving and consumption. The next step could be to apply the predictive approach of Health Impact Assessment that will assess the benefits of the implementation of specific policies and their impact - changes in the baseline mortality or disease rate. Mortality is only the tip of the iceberg of effects of air pollution. Morbidity attributable to air pollution is expected to be significant. The costs of morbidity are not only caused by direct health care related expenditures, but also by sick leaves from work and school.
Future studies should include morbidity endpoints, to gain a better overall picture of the impact of air pollution in the country. Beside the limitations and constrained by major uncertainties, this assessment should be a valuable input to national and local authorities to become aware about the magnitude of the problem, and take responsibilities toward the prioritizing the actions, strengthen the control of the ambient air pollution, consistent implementation of the legislation and enhance the inter-sectoral cooperation. This kind of estimations should be a base of the decision-making process at any level, from local to national.
Part of this work was funded by EU Twinning programme Project MK 12 IB EN 01 (Further strengthening the capacities for effective implementation of the Acquis in the field of air quality). We also acknowledge with appreciation the contribution of Marco Martuzzi (WHO ECEH Bonn, Germany) for the constant support during the calculation process.


