info@biomedres.us
+1 (502) 904-2126
One Westbrook Corporate Center, Suite 300, Westchester, IL 60154, USA
Site Map
Received: March 22, 2025; Published: April 10, 2025
*Corresponding author: Francisco Casesnoves, PHD Engineering, MSC Physics-Mathematics, Physician, Independent research scientist, International Association of Advanced Materials, Sweden, Uniscience Global Scientific Member, Wyoming, USA
DOI: 10.26717/BJSTR.2025.61.009584
In a previous publication, constrained evolutionary algorithms for In-Vitro-BED-LQ model (Linear Quadratic Biological Effective Dose Model) in prostate cancer Hyperfractionation radiotherapy TPO were optimized with Pareto-Multiobjective (PMO) methods. This study improves the research with a further comparative In-Vivo- BED-LQ model optimization followed by a precision-refinement with Interior Optimization (IO) methods. Complex software is developed based on hyper fractionation constraints, but within vivo main parameters dataset, and IO programming. Results with software design algorithmic method take in handle subroutines functions and matrix-algebra method for setting constraints and 3D IO surfaces. Results with 3D Interior Optimization by using the Genetic Algorithms (GA) previous numbers show get very good precision with new-invention of isodoselines sharp determination. Solutions dataset is shortly compared with previous in vitro study. Findings prove comparative PMO 2D imaging charts and numerical values of PMO prostate cancer hyper fractionated TPO parameters. Applications for prostate tumors radiotherapy planning, especially with new Surfactal- Isodoselines, brain prostate metastases and stereotactic radiosurgery treatments are briefed.
Keywords: Pareto-Multiobjective Optimization (PMO); Mathematical Methods (MM); Biological Models (BM); Radiation Therapy (RT); Initial Tumor Clonogenes Number Population (N0); Effective Tumor Population Clonogenes Number (NEffective); Linear Quadratic Model (LQM); Integral Equation (IE); Tumor Control Probability (TCP); Normal Tissue Complications Probability (NTCP); Biological Effective model (BED); Tumor Control Cumulative Probability (TCCP); Radiation Photon-Dose (RPD); Nonlinear Optimization, Interior Optimization (IO); Radiotherapy Treatment Planning Optimization (TPO); Nonlinear Optimization; Treatment Planning Optimization (TPO); Artificial Intelligence (AI); Pareto-Multiobjective Optimization (PMO); Genetic Algorithms (GA)
From a previous publication, [1], the objective of this contribution is apply Constrained Genetic Algorithms and 3D Interior Optimization on radiotherapy BED-LQ model for prostate tumors [2-33] with in vivo dataset for an hyperfractionated schedule. The BED-LQ model [2-40], is useful for low dose fractions, while LQL and PTL ones are more appropriate for high dose delivery RT treatment schedules— namely, hypofractionated treatment [33]. The numerical difference between in vitro LQ parameters for prostate LQ model can be considered important [1-45]. It is not subject of this article any discussion about hyperfractionation versus hypofractionation dose delivery. Prostate cancer epidemiology statistics-figures are within the group of highest incidences- prevalence cancers, but lower than lung and breast tumors, [45]. Therefore, the objective of the study is to carry out a double optimization process. Firstly, 2D GA optimization with in vivo data for LQ model. Secondly, making the most of the firstly GA obtained results, to get an improved refinement by using 3D Interior Optimization methods. Numerically, TPot magnitude difference in vivo values, prostate cancer, are about 28 days in vivo and [3,20] in vitro ones are lower. In general, also, both in vitro and in vivo TPot parameters for prostate tumors are greater than other types of cancer [21-25,46].
This fact implies a longer survival time with several proper characteristics related to different treatment stages. Namely, surgical, RT, radiosurgical, chemotherapy, inmunotherapy, hormonal therapy, combinations of all of them. Today, biomarkers are getting an important role in order to predict the survival time, optimal chemotherapy, and both characteristics at the same time [41]. Table 1 shows a biomarkers classification into P-Biomarkers (Biomarkers for Prognosis, [42]), T-Biomarkers (Biomarkers for Optimal Treatment), and H-Biomarkers (Hybrid Biomarkers Group), [Author’s proposal]. The programming design has two parts: Nonlinear GA-PMO engineering software with matrix algebra constraints, similar to the previous publication in codes/patterns for PMO-BED models. Second part is rather more difficult. That is, 3D Interior Optimization with the new useful-practical finding of isodoselines for radiotherapy planning hyper fractionated schedule. Those new Isodoselines along the Interior Optimization surface constitute a TPO advance and innovation of this contribution. Results comprise Graphical and Numerical TPO hyper fractionated RT treatment planning. 2D GA graphics are presented in several formats, for 100, 150, and 250 generations. 3D Interior Optimization charts are illustrated with Isodoselines, optimal areas, and numerical data inset. Numerical results show first GA figures and Interior Optimization refined values. Therefore, the novelty of this article, based on the previous evolutionary optimization paper, [1], is its GA algorithms and computational optimization with in vivo parameters, 3D Interior Optimization improvements, and the practical definition of 3D Isodoselines for RT planning hyperfractionated schedule.
Table 1: General Biomarkers classification, [Author’s proposal]. Nano-Biomarkers is an open research field with potential perspectives in future [42,45]. Just remark that Biomarkers are is extent, diverse and difficult as involves biochemistry, molecular biology, medicine-pharmacology, medical physiology and several other fields. Therefore, this Table is simple based on Author’s proposal classification.

It is objective, according to the precision of numbers obtained, that the mathematical and software developed is considered appropriate. Grosso modo, a double constrained optimization based on previous Nonlinear Pareto-Multiobjective GA optimization was developed with the addition of 3D Interior Optimization refinement and the new- practical Isodoselines definition. Applications for radiotherapy hyperfractionated BED-TPO planning are presented. Numerical Analysis precision results are gonna be promising for improvements of the method.
Following previous studies, mainly the prostate cancer one [1], and publications for Breast, Head- Neck cancer, here the Pareto-Multiobjective Optimization Fowler-foundation BED Effective model was programmed, [1-40,45,47]. Alpha, Betha, and rest of parameters intervals are detailed in Table 2. Algorithms 1-5 set the 2D GA and 3D IO formulas and constraints [26-27,48-49]. Radiobiological parameters Alpha and Betha are implemented independently, not in quotient [alpha/ beta] because of the programming pattern’s purpose. This lowdose LQ-BED model constitutes the foundations for hyper fractionated radiotherapy TPO, though there are dissimilarities among authors [21-25,46]. Therefore, the Pareto-Multiobjective [Algorithm 1] that was set, with Chebyshev L1 norm, [Algorithms 2-4] is presented firstly. The IO method is explained secondly.
Table 2: Software implemented dataset for GA programming with source references [1,42,43, 62,63-65].

Evolutionary Algorithms Mathematical Method
The GA algorithms used are approximately the same than in previous prostate cancer publication, [1]. The sequence of the formula’s development is as follows,
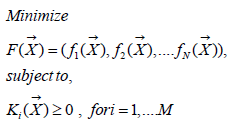
(Algorithm 1)
Where
F(x): Main function to be optimized.
fi (x): Every function of same variables (x).
Ki (x): Constraints functions such as in general N ≠ M.
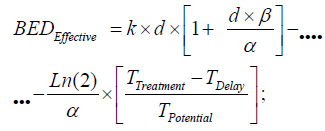
BED nonlinear-quadratic model has been adapted for in vivo parameter
TPot magnitude. Then, PMO in Prostate, [1,25,27,28] tumors
simplest BED model reads,
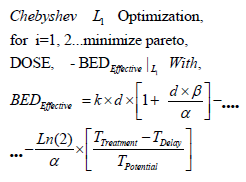
(Algorithm 2)
where,
BED: The basic algorithm for Biological Effective Dose initially developed
by Fowler et Al. [1,23-25, 28-33,46].
k: Optimal Number of fractions for hyperfractionated TPO. Optimization
parameter. [1,23-25,28-33,46]. d: Optimal Dose magnitude
for every fraction. Optimization Parameter [ Gy]. [23-25,28-33,46].
α: The basic algorithm constant for Biological Effective Dose
models. Radiobiological experimental parameter in vivo. [ Gy-1]. [23-
25,28-33,46].
β: The basic algorithm constant for Biological Effective Dose models
in vivo. Radiobiological experimental parameter. [ Gy-2]. Note that
it is very usual to set in biological models [ α / β in Gy].
TTreatment: The overall TPO time. This parameter varies according
to authors’ and institutions/hospitals criteria. [1,23-25,28-33,46].
TDelay: The overall TPO time delay for clonogens re-activation.
This parameter varies according to authors’ experimental research.
TPotential: The potential time delay for tumor cell duplication.
This parameter varies according to authors’ experimental-theoretical
research.
DOSE: The dose magnitudes for lung cancer simulation algorithm
for Biological Effective Dose [1,23-25, 28-33,46]. Software patterns
were calculated around intervals prostate DOSE ϵ [35-39,50-53] Gy.
Algorithm 1 [Fowler mainly, modified by Casesnoves, 98]. Prostate
PMO algorithm [2-29,46,48,49] implemented in software. Table 2
shows these intervals for optimization parameters details. Programming
was developed in Matlab® system. At programming trials, it
was found that precision was increased related to in vitro parameters
[1]. The constraints algebraic algorithm developed for Pareto-Multiobjective
problem, [Algorithms-3-5, Casesnoves 2023] reads,
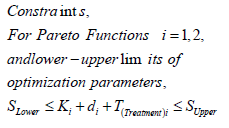
(Algorithm 3)
Where,
SLOWER: Summatory of all lower constraints for parameters [K,
d, T]. SUPPER: Summatory of all upper constraints for parameters [K,
d, T]. Ki: Dose fraction number parameter for [ i = 1, 2].
di: Dose fraction magnitude parameter for [i = 1, 2]. TTREATMENT:
Treatment time magnitude parameter for [i = 1, 2].
The subroutines programming strategy, as in [98], which are implemented
reads,
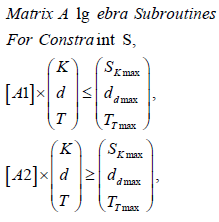
Algorithm 4)
where,
SK,d,T : Upper (maximum) and Lower boundaries for parameters [K, d, T], according to Algorithms 1- 2.
A1,2: Matrices for numerical values, Table 2.
Sofware used for this study continues previous algorithms papers [1,2-21,25,27,28,35,47] with modifications, and addition of IO programs. For GA-PMO modeling, Equation 1 and Algorithms 1-4 are implemented on 2D programs, with application of Algorithm 5 basic model formula. Algorithm 2 was programmed with Algorithm 3 matrix constraints subroutines-functions. Table 2 shows Constrained GA Optimization in vivo parameters, different from [1], implemented in Algorithms 1-5. From Table 3 results, after IO implementation, 3D IO dataset for Table 4 is got. From all these numbers, 3D IO and 2D Genetic Algorithms Graphical Optimization imaging-processing charts, error determinations, pareto-distance, get precise approximations for hyper fractionated PMO-BED model. In general, precision obtained is more than expected, Tables 3 & 4.
Table 3: Constrained optimization Algorithms 1-4 numerical results. Pareto distance is almost exact, in contrast with previous in vitro research (in [1], was about 10-2 magnitude order).

Table 4: Brief of IO constrained optimization Algorithms 1-4 numerical results, with description of two Isodoselines, Figure 7. From Table 2, Lower Isodoseline is for 70 Gy, Upper for 78 Gy. K figures are truncated to integers.

Interior Optimization Computational Method
3D Interior and Graphical Optimization methods are used to confirm and refine the in vivo precision of the GA results from [1]. This is an advance as it was found that by using Interior Optimization the precision is increased and Isodoselines can be set for TPO. The method and software developed is a potential new application for accurate TPO.
Programming Dataset
Table 2 shows Matlab Constrained GA optimization dataset is detailed, for first optimization stage. As in [98], constraints matrix algebra is implemented through [Algorithms 3-5]. All these simulation techniques come from [1,21-33,35,36,46-49,54,55]. The in vivo TPotential in prostate cancer for setting data is TPotential ϵ [56-60] days. The reason to use in vivo dataset in this second prostate study is that, although currently the in vivo radiobiological differences differ in the literature, more realistic results are gonna get.
2D GA Graphical results are shown in Figures 1-4. The constrained optimization results are presented sharply in 2D multifunctional charts. This constrained optimization with in vivo parameters, [Algorithms 1-5] gets better results than in vitro one in the previous prostate cancer study [1].
Figure 1

Figure 2

Figure 3

Figure 4

The imaging process software shows the results got with 3D Interior Optimization, Figures 5-7. Results are very acceptable. Isodoselines are marked inset every image. The radiotherapy planner gets multiple choices by using this 3D IO method.
Figure 5

Figure 6

Figure 7

Invention of Interior Optimization Isodoselines
When performing the 3D Interior Optimization refinement, it was found that Isodoselines can be feasible and useful. Figure 7 can be considered a definite demonstration. It shows a number of selected Isodoselines for a number of TPO-dose magnitudes to prove the new utility found. For IO, the algorithm to be set on program patterns reads,
Algorithm (5)
where all the parameters description are at Algorithms 1-4.
An image processing showing the utility for PTO of this IO with
several Isodoselines is presented, Figure 7. Note that Algorithm 5 is
converted when running software in a nonlinear-quadratic system
of equations. As it is quadratic, the rationale of the precise results is
justified.
Numerical results can be divided into two parts. First one is the GA numerical figures, Table 3. Secondly IO results brief based on Figure 7 mainly. In Figure 7 Isodoselines demonstrate their efficacy for TPO choice. That is, once fixed total dose, e.g., 70 or 78 Gy, any planner can select the desired number of fractions, and the convenient figure of fraction-dose along a Isodoseline, Figure 7 proof.
Genetic Algorithm Optimization Numerical Results
Figures for constrained PMO-GA optimization numerical data are presented shown in Table 3. As occurred in [98], constrained optimization displays acceptable numbers within numerical intervals [1,2- 40,47].
Interior Optimization Optimization Numerical Results
Table 4 show the accurate numerical results got with IO refinement method. Example-dataset included comes from Isodoselines of Figure 7.
Table 5 presents details and applications of both optimization techniques. Radiotherapy hyperfractionated treatment planning applications for prostate tumors are specified. Medical Physics principal applications for radiotherapy research emerge from the data.
Table 5: Details for radiotherapy and radioprotection for RT prostate cancer TPO Medical Physics study applications. Derived from these results, dual-optimization (GA+IO) can be considered acceptable.

The objective of the study was to apply firstly constrained 2D GA Optimization for prostate cancer hyper fractionated RT treatment with BED-LQ model and in vivo parameters. Secondly to get precise numbers by using 3D Interior Optimization methods. Constrained PMO-Multiobjective method was programmed with subroutines. A rather difficult software for 3D Interior Optimization to determine optimal surfaces and Isodoselines was designed. In general, for first stage, the previous publication algorithms were set. First part of results comprises a group of 2D GA plots and numerical dataset. Constrained Optimization with Algorithms 1-5 got to get a Pareto Distance almost exact, null, with 250 generations. Interior Optimization application in second stages resulted in the invention of Isodoselines along the optimal surface, also with accuracy, Figure 7. These Isodoselines give a large number of alternatives in terms of number of fractions and magnitude of fractions keeping the same total BED dose.
It is considered a practical invention for RT planning with BED models. When number of generations increases from 100, the running time of the constrained programs rises to approximately 1-3 minutes. As a rule, numerical and graphical results are better than expected. One of the reasons because of which GA-in vivo parameters method gonna get such precision, is the parameter magnitude of TPot in vivo. The second part of BED equation becomes lower and the model results almost be a quadratic nonlinear equation with k and d variables. As a result, the GA Optimization is simpler for computation and reaches more computational precision. The method can be considered somehow laborious but the precision gained results are justified. Inconvenient is the increase of running time when using GA in direct proportion to the increment of generations number. The software to construct precise 3D Interior Surfaces and Isodoses has to be checked and done carefully. Grosso modo, a prostate cancer constrained RT-BED hyper fractionation model with GA and in vivo data was performed with Pareto-Optimization and refined with 3D Interior Optimization. Isodoselines constitute a practical result for BED RT accurate planning. Applications for prostate tumors and radiation therapy in general optimal TPO emerge from all the study.
Formulas applied/included are from previous prostate article with in vitro data. Model is a modification from several authors, based also on [21,25,27,28,46,61] techniques. Mathematical Algorithms 1-4 formulas are modificated from previous publications [21,25,27,28,46,61]. RT applications methods for these publications were created by Dr Casesnoves in 2021-2. Methods from [21,26,27] were created by Dr Francisco Casesnoves in 3rd November 2016, and Interior Optimization Methods in 2019. BED model setting in Algorithms and programming were developed by Dr Casesnoves from previously published BED models. This article has previous papers information, from [2-22], whose inclusion is essential to make the contribution understandable. This study was carried out, and their contents are done according to the International Scientific Community and European Union Technology and Science Ethics [62-65]. References [62-65]: ‘European Textbook on Ethics in Research’. European Commission, Directorate-General for Research. Unit L3. Governance and Ethics. European Research Area. Science and Society. EUR 24452 EN. And based on ‘The European Code of Conduct for Research Integrity’.
Revised Edition. ALLEA. 2017. This research was completely done by the author, the computational-software, calculations, images, mathematical propositions and statements, reference citations, and text is original for the author. When a mathematical statement, algorithm, proposition or theorem is presented, demonstration is always included. When a formula is presented, all parameters are detailed or referred. If any results inconsistency is found after publication, it is clarified in subsequent contributions [Note: in at least one article of theses series, it was written by mistake that radiation is previous to surger. That is a mistake, for cancer treatment, surgery, when possible, is previous to radiation]. When a citation such as [Casesnoves, ‘year’] is set, it is exclusively to clarify intellectual property at current times, without intention to brag. The article is exclusively scientific, without any commercial, institutional, academic, religious, religious-similar, non-scientific theories, personal opinions, political ideas, or economical influences. When anything is taken from a source, it is adequately recognized. Ideas and some text expressions/sentences from previous publications were emphasized due to a clarification aim [62-98].


