 Research Article
Abstract
Background: As you know, high BMI values often lead to type 2 diabetes (T2D). However, it is not clear what factors directly contribute to this transformation of one pathology into another, because many people with high BMI do not develop diabetes. In this regard, it is interesting to consider this pathology from the point of view of Traditional Chinese Medicine (TCM) based on the results of assessing the bioenergetics of such patients using the Akabane test.
Methods / Design: In total, the Akabane test and BMI assessment was performed by 338 subjects of whom there were 139 men and 198 women who did not have any pronounced pathologies. The average age of thе participants was 43.52 + _13.26 years old. For comparison, a second group of 475 patients (men -160, women-315) of the same age with a verified diagnosis of T2D was taken, who also underwent this test.
Results: The methods of correlation and regression analysis of the relationship of BMI with certain acupuncture channels (AC) were analyzed, as well as the features of the test profiles depending on the age and BMI values. It was found that the most informative in assessing high BMI values is the ratio of the right and left branches of the AC and the degree of symmetry breaking in them. A comparative analysis of different values of BMI and tests in 2 groups of subjects revealed those AC separately in men and women, whose changes against the background of BMI growth lead to the formation of T2D. The mechanisms and boundaries of transitions for such a transformation are identified.
Conclusion: the capabilities of this test are shown for effective individual monitoring of BMI at the level of certain organs and body systems. This monitoring system, based on new physical principles, is especially useful for tracking the effect of various treatments, supplements and lifestyle factors on specific metabolic processes in the body.
Keywords: BMI; Diabetes Mellitus Type 2; Akabane Test; Metabolic Disorders; Acupuncture Channels
Abbreviation: AC: Acupuncture Channels; TCM: Traditional Chinese Medicine; TS: The Pain Thresholds in Temperature Sensitivity; T2D: Diabetes Mellitus Type 2
Introduction
Metabolic diseases such as excess weight, obesity, type-2 diabetes, and vascular diseases, have reached epidemic proportions worldwide [1-4]. These diseases contribute significantly to the overall morbidity and mortality. Despite the abundance of studies in the management of overweight and type 2 diabetes, which are often associated, it is not clear what mechanisms lead to the transformation of one pathology into another [5-7]. Such representations at the level of specific indicators of the organism would make it possible to effectively track such a transition and take preventive measures in advance. At the same time, it is desirable that the assessment technique be simple and non-invasive, in contrast to the measurements of the glycemic level, and allow such patients to control themselves independently every day. In this regard, we conducted this study, showing the capabilities of the Akabane test and its interpretations in the light of TCM for monitoring these patients using the example of assessing changes in the body due to the growth of BMI and its transition to T2D. Earlier it was shown that the AC system in the values of this test reflects the main physiological and biochemical parameters in the body at the level of individual organs and physiological systems [8-12]. Therefore, the use of this new tool in the assessment of metabolic disorders in the body opens up new opportunities in their early diagnosis and prevention of complications.
According to the main theoretical concepts of TCM, the work of all human organs and systems is controlled by the system of AC, which are represented on the human body by Acupuncture points, which, based on the connection with a certain organ or physiological system, are connected into an energy line that forms a specific AC. At the same time, various types of influence on such points lead to a change in the activity of the organs associated with them, which is used in reflexology. The quantitative assessment of AC activity is especially effective using the Akabane test, which has high correlations with various physiological and biochemical parameters of the body, which allows effective monitoring using this simple test. In TCM, it is customary to assess the activity of an AC by the amount of Chi (QI) energy in it, which from the point of view of modern physiology corresponds to the concept of “Functional activity” of a certain organ or system with which a particular AC is connected. In turn, the 12 main AC form the system of the 5 Elements Figure 1, which are responsible for the general balance of energy distribution in the body through stimulating and inhibiting interactions between the organs [13-17]. According to a number of researchers, in terms of its principles this five-point system of regulation is one of the most accomplished and wellknown in modern technology. Traditionally, the level of energy (activity) is characterised by two notions. These are “fullness”, which corresponds to the hyperactivity of an organ corresponds to the Yan factor, and “emptiness”, which corresponds to an organ’s inactivation and corresponds to the Yin factor.
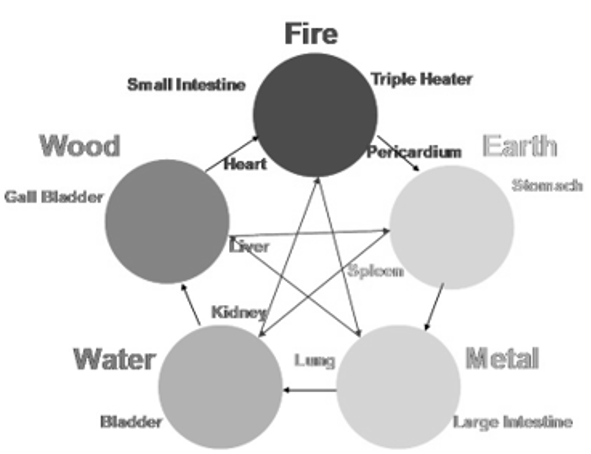
Figure 1: The system of Five primary elements.
According to TCM, the main flow of energy moves clockwise in a circle of circulation. However, as a result of various reasons, the uniform movement of energy at the level of certain AС and primary elements can be disturbed and lead to its local excess or deficiency. In this case, other regulatory mechanisms are manifested, associated with the depressing effect of one primary element on another. For example, an excess of energy of the primary element Fire - inhibits (melts) Metal. Metal destroys Wood, and it destroys the Earth. Water slows down (extinguishes) Fire, and the Earth blocks the path of Water. At present, a number of studies have appeared [18-21] in which the principle of operation of such a system at the mathematical level has been shown, which makes it possible to predict the occurrence of various diseases based on the individual state of this system. There are a number of modern studies showing that AС are real systems for transferring information between the environment and living organisms, including plants. Wherever there is water, information transmission channels are spontaneously formed where there is a dynamic self-focused propagation of coherent radiation with its phase synchronization [8-11]. Such energy waves in the connective tissue can “capture” neighboring molecules, cells and biological units in their coherent vibrations. Thus, this optical waveguide in the form of an AС can provide a no dissipative flow of energy and information throughout the body [22].
To quantitatively evaluate a channel’s activity level in TCM, the so-called “sacrificial stick” test was used in ancient times in China. This test involved a burning sandal stick that was brought in proximity to points at the tips of every finger and toe until the first sensation of pain. At each point, the pulse rate before pain was first felt, was measured. If the number of pulse beats was lower than the average one for all the channels, it proved the hyperactivity of an acupuncture channel and its corresponding organ. Conversely, when the rate was higher, it represented the inactivity of a channel and its corresponding organ. This test was described by the Japanese doctor Koben Akabane in 1956. Since then, the test has carried his name [23]. According to classical Oriental literature as well as according to our study results [24- 27], the following channels have different regulatory functions:
a) LU- lungs channel, connected with the function of lungs
and tissue breathing.
b) Li- large intestine channel, connected with the large
intestine function and its microbe flora, it participates in the
regulation of arterial pressure, biochemical blood indices.
c) PC - pericardium channel, connected with the cardiac
muscle trophicity and its structure. In addition, it is connected to
muscular activity, arterial blood pressure levels and emotions.
d) TE- triple heater channel, connected to the central and
peripheral hemodynamic, and with body energy consumption.
In addition, it regulates the hormones in the body, thyroid and
hypophysis.
e) HT - heart channel, regulates the cardiac rhythm, body’s
physical strength.
f) Si - small intestine channel, connected to the electrolytic
balance and food digestion.
g) SP- spleen-pancreas channel is connected to the pancreas
and immunity.
h) LR- liver channel is connected to liver function and central
nervous system, stress levels.
i) St- stomach channel is connected to the digestion function.
j) GB- channel of the gallbladder is connected to the
digestion function and peripheral nervous system.
k) Ki- kidney channel is connected to the kidney function
and the adrenal glands, controls the total supply of energy in
the body and its redistribution.
l) BL- urinary bladder channel is connected to the urogenital
system, its functions and its related hormones, it reflects the
state of vertebrae column as well.
Each channel consists of the left (l) and the right (r) branch between which normal symmetrical activity balance is maintained. TS is our bodies’ basic reactive system; it is as significant as important indicators such as body temperature, as it gives a very clear representation of functional and psycho-physiological profiles. Their topography is shown in Figure 2.
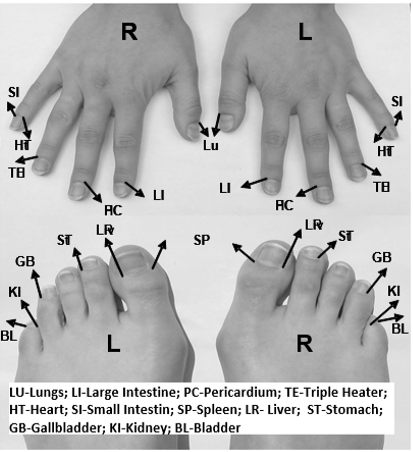
Figure 2: Topography of acupuncture points used for evaluation of the AC in Akabane test.
Materials and Methods
In total, the Akabane test and BMI assessment was carried
out on a group of 337 subjects, of whom there were 139 men and
198 women aged (M ± SD) 44.08 ± 15.8 in men and 47.12 ± 13.7
in women. Body mass index, BMI (kg / m2) was calculated by the
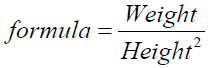 The value of 25 was taken as the upper limit of
the BMI norm. The majority of the study participants were members
of staff at the NCERM of EMERCOM clinic in Russia (St. Petersburg),
who did not have any pronounced pathologies. For comparison, a
second group of 475 patients (men - 160, women - 315) of the same
age with a verified diagnosis of D2M was taken, who also underwent
this test. This test measures the pain thresholds in temperature
sensitivity (TS) when heat is applied to the “entrance-exit” points
of each channel (LU11, LII1, PC9, TE1, HT9, SI1, SP1, LR1, ST45,
GB44, KI1, and BL67) by applying an impulse light-emitting diode
(LED) non-coherent infrared radiation (IR)-light onto the skin
(f = 1 Hz, λ = 920 nM), recording the total energy expenditure in
joules [18-19]. Each impulse radiates 0.07 joules of thermal energy.
These measurements were carried out using a certified device –
“Refleksomaster”, invented by the author of this paper. The analysis
of the relationship between biometrical indicators and AC was
carried out using correlations (Pearson and Spearman coefficients)
and multiple regression analysis. One-way MANOVA by LSD post
hoc comparisons analysed the effect of sex on the AC data. Wilcoxon
signed-rank test and the Mann-Whitney test were used for paired
comparisons. Statistical decisions were made at the 5% significant
level (р≤0.05). We used the SPSS software package version 15.
The value of 25 was taken as the upper limit of
the BMI norm. The majority of the study participants were members
of staff at the NCERM of EMERCOM clinic in Russia (St. Petersburg),
who did not have any pronounced pathologies. For comparison, a
second group of 475 patients (men - 160, women - 315) of the same
age with a verified diagnosis of D2M was taken, who also underwent
this test. This test measures the pain thresholds in temperature
sensitivity (TS) when heat is applied to the “entrance-exit” points
of each channel (LU11, LII1, PC9, TE1, HT9, SI1, SP1, LR1, ST45,
GB44, KI1, and BL67) by applying an impulse light-emitting diode
(LED) non-coherent infrared radiation (IR)-light onto the skin
(f = 1 Hz, λ = 920 nM), recording the total energy expenditure in
joules [18-19]. Each impulse radiates 0.07 joules of thermal energy.
These measurements were carried out using a certified device –
“Refleksomaster”, invented by the author of this paper. The analysis
of the relationship between biometrical indicators and AC was
carried out using correlations (Pearson and Spearman coefficients)
and multiple regression analysis. One-way MANOVA by LSD post
hoc comparisons analysed the effect of sex on the AC data. Wilcoxon
signed-rank test and the Mann-Whitney test were used for paired
comparisons. Statistical decisions were made at the 5% significant
level (р≤0.05). We used the SPSS software package version 15.
Results
According to the measurements, the BMI values in the groups varied from 17.6 to 44.1 according to all data, in the group of men they varied within 18.3-37.4, M ± SD: 26.4 ± 4.1, in the group women - 17.6-44.1, M ± SD: 25.9 ± 5.4. There were no significant differences between age and BMI in the groups of men and women (U-test). Since the distribution of the BMI index is asymmetric and significantly different from normal (p = 0.053, Kolmogorov- Smirnov Test), BMI data were logarithm (BMI data have been logarithm, using natural logarithm) and further data analysis was carried out for both the initial and logarithm data. LnBMI. For the same reason, when analyzing the sensitivity thresholds, along with the initial ones, logarithmic data were used. The upper limit of the logarithm of the norm is Ln (BMI = 25) = 3.219. Figure 3 shows the corpol (Scatterplots) and regression lines when approximating the Ln (BMI) data by a straight line and a parabola depending on age for men and women. In both cases, linear regression is significant, *** pb <0.001, both in the group of men and in the group of women, rm = 0.379, rf =, 437, Std. Error of the Estimate = 0.142 & 0.179 for men and women, respectively. The second-order coefficient when approximated by a parabola is significant in the group of men, *** pb <0.001 and insignificant in the group of women. The rank correlations, of course, coincide for BMI & Ln (BMI), and Pearson’s for the logarithms above. The Figure 3 shows that throughout the entire age range, the BMI index is increasing for women, for men, the index also increases, and at the age of 40 it reaches almost a plateau.
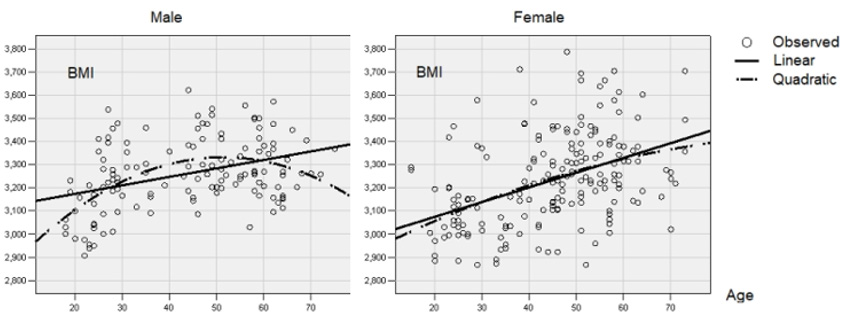
Figure 3: Polygon of distribution of BMI values depending on age in men and women.
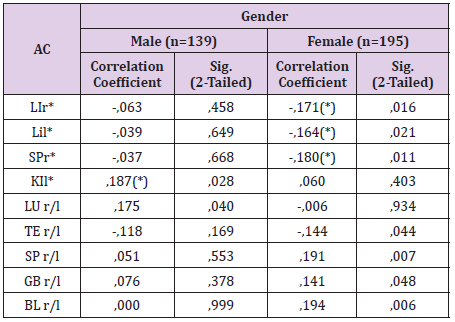
Table 1: Results of correlation analysis between 24 channels and IUI, taking into account the influence of age in men and women.
Where: * - TS indicators of channel branches; r / l is the ratio of the TS indicators of the right and left branches of the AС.
To identify the relationships between the BMI parameters and the TS test values at the level of 24 channels, taking into account the influence of age, a correlation analysis was carried out. Table 1 shows only significant relationships (p< 0.05), and not only with individual AC, but also with the ratios of the values of their branches at the right / left level. Earlier it was shown that this indicator reflects the degree of asymmetry in the AC and it is one of the most important criteria in the diagnosis of various diseases (). Therefore, in Table 1, along with the assessment of the links with the BMI indicators of the TS channels, the results of such comparisons are also presented. In general, a number of significant correlations were revealed, which in men are traced only with KIl, and in women with LI r and l and SPl. When assessing correlations with BMI at the level of the ratio of the right and left branches (r / l) in Men, there is a connection only with the AC of the lungs. Women have significantly more such connections with AC -TE, SP, GB and BL. To eliminate the influence of age on the connection of BMI with the channels, Partial Correlations were produced, presented in Table 2. In men, according to these results of assessments of connections at the level of 24 branches of the AС, a new tendency was noted with the influence of the lung (p = ,053) and kidney (p = ,063) canals. According to ТСМ, the kidneys contain a total energy reserve, which, from the point of view of modern concepts, corresponds to the volume of perirenal fatty tissue. In addition, the kidneys contain a reserve of “hereditary energy”, which corresponds to the genetic characteristics of the organism.
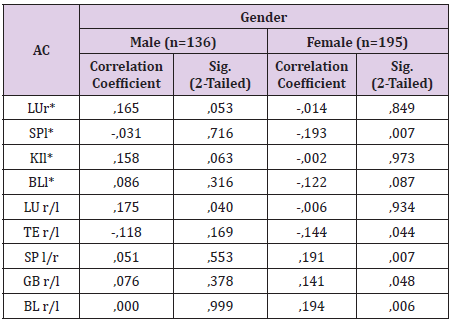
Table 2: Partial correlations when excluding the influence of age.
Where: * - TS indicators of channel branches; r / l is the ratio of the TS indicators of the right and left branches of the AC
Thus, these results confirm the data on a genetic predisposition to overweight. When assessing the ratio of the right / left communication with the TS channel of the lungs becomes reliable. This relationship can be explained by the level of oxygen consumption in metabolic reactions in the body, because AC of the lungs reflects the oxygen saturation of the blood. With physical exertion, oxygen consumption increases and body weight decreases from intense catabolic reactions. Thus, through the level of communication with the AC of the lungs, it is possible to indirectly monitor the degree of physical activity. This indicator comes with a (+) sign. Therefore, the higher the right branch - which reflects blood oxygenation [28,29] - the higher the oxygen capacity of the blood. In women, as before, there was a pronounced significant relationship (p = ,007) with SPl. According to our data [18,20,21], the left SP branch is associated with the production of a counter insular hormone, which increases appetite. Therefore, the growth of BMI can be explained by bulimia. There is also a tendency (p =,087) in dependences with BL- which is associated with the peculiarities of the sex hormonal background. In general, in women compared to men, the regulation of metabolism is different. The SPl channel has the most pronounced effect. This dependence is also confirmed by significant connections (p =,008) with the primary element “Earth” at the level of 5 elements. Additional significant connections (p =,044) with the TE channel were also revealed, which reflect the influence of the thyroid gland and GB (p =,048), which reflect disorders in the nervous system [17,18], which is also very logical.
According to step-by-step regression analysis in men Table 3, BMI dependencies on TS of both branches of the lung canal were revealed, as well as with the PC canal and especially (p =, 001), with the left branch of the KI canal. In models of AC right / left branch ratios, the BMI has significant dependences (p =, 023) only with the lung canal. In general, such dependences on the combination of the presented AС can be explained by the pronounced effect of physical activity on BMI indices. During such loads, according to the presented model, the AС of the lungs provides the body with proper oxygen consumption, the pericardial canal reflects the intensity of muscle loads, and the KI channel is the overall balance of the body’s energy supply. Thus, all these 3 АС have a single conceptual connection. However, in general, the model has a low percentage of explainable variance. R2 (Adjusted) = 0.07. In women, the most interesting regression dependences with BMI were found at the level of the relations of the right / left branches of the AC, which are presented in Table 4. Of these, the most significant dependences with the SP -(p = .007), BL -(p = .01) channels), as well as, similarly to men, with the KI channel. An interesting trend (p =,09) was also noted in relation to the TE channel, which reflects the regulation of basal metabolism through the activity of the thyroid gland. In general, this model also has a low percentage of explainable variance (R²= 0,10). R2 (Adjusted) = 0.10. The following graphs show the profiles of the 24 AC test with BMI values less than and more than 25 in men and women Figure 4.
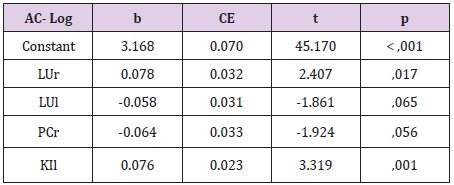
Table 3: Results of stepwise linear regression of the dependences of АСs with on the BMI value in men.
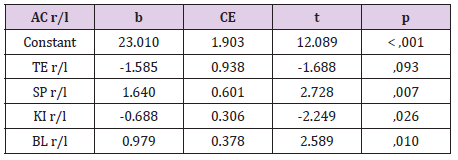
Table 4: Results of stepwise linear regression of the dependences of АСs ratio r/l with on the BMI value in women.
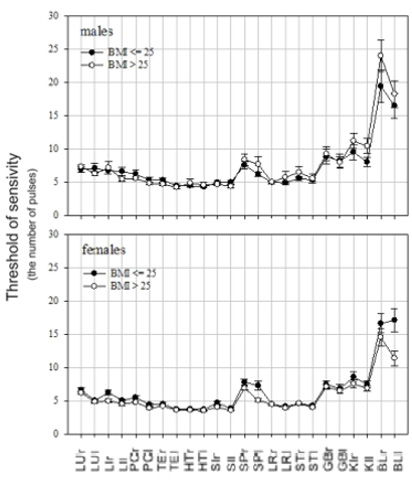
Figure 4: Test profiles in men and women with BMI values less and more than 25.
In both cases, a visual difference was noted mainly in the BL, SP and KI channel only in men. However, according to Multivariate Tests, (Wilks’ Lambda, Males: p = .179; Females: p =, 569), these profiles do not differ significantly in general. Earlier it was shown that the assessment of the ratio of the right and left branches of the AС has the greatest diagnostic value [20-25]. Figure 5 shows the distribution profiles of these indicators’ r/l in men and women. The greatest differences in the profiles were noted in the lung canal. According to the graph of differences from men, the indicators of the right branch of this channel are higher in women than on the left. In general, the profile of r / l values in women is higher in all channels, which reflects relative hypofunction in comparison with men at the level of major organs and systems, with the exception of the ACs of the heart and kidneys. The right branch according to the TCM characterizes accumulation and anabolic processes, and the left one - catabolic. The Woman is Yin, and the Man is Yang. Thus, on the whole, this graph confirms this classification of TCM. The female body tends to accumulate energy more, and the male to waste. According to the t-test, M-W test Table 5, significant differences between men and women at the level of relations between the right and left branches of the AC occur in the AC of the lungs, small intestine, liver and stomach. To find the same changes in profiles, tests were compared for r / l ratios at different BMI values, as well as in patients with T2D separately in men and women. Figure 6 shows the profiles in men. With an increase in BMI above 25, an increase in LU, LI, ST and especially BL is noted. Such an increase in the latter is carried out mainly due to an increase in the indicator of its right branch. Earlier it was found [7,17,18], that this channel reflects the activity of the sex hormonal sphere.
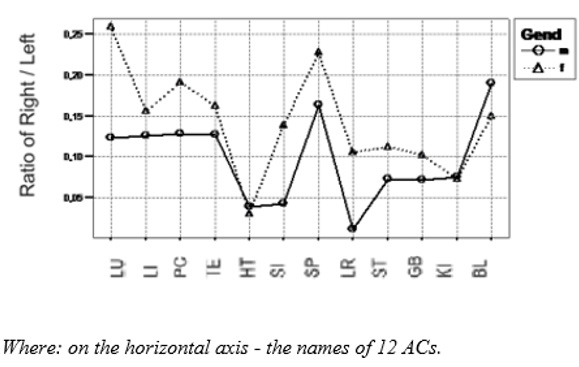
Figure 5: Comparison of test profiles in men and women at the level of right / left ratios.
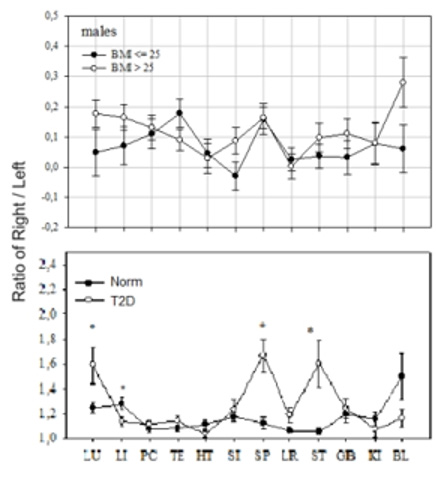
Figure 6: The averaged graphs of the Akabane test profiles at the level of ratios of TS indices to r / l branches of 12 AC in men with BMI is more and less than 25 in comparison with similar profiles in men with T2D and Normal.
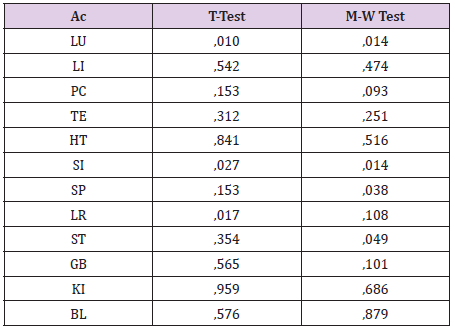
Table 5: Significance levels of differences in r / l ratios ACs between men and women according to t-test and M-W test.
Significance Levels p<0,05
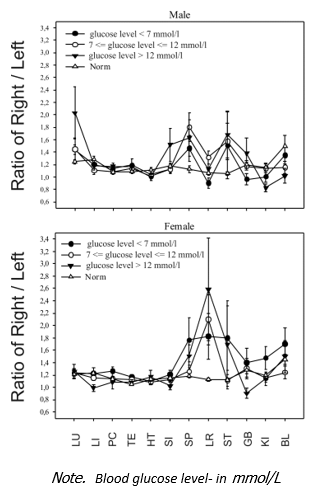
Figure 7: Test profiles of R/L ratio TS in patients with NIDDM for blood glucose level less than 7 mmol/L, from 7 to 12 mmol/L, and greater than 12 mmol/L compared with healthy subjects.
At the same time, sexually active men, according to TCM, go under the Yang gender sign, and their indicators of the left (Yang) branch of this channel should prevail. The sharp predominance of the right branch with a BMI of more than 25 reflects generally low sexual activity, since the supply of energy in this system sharply exceeds its expenditure [17,18]. In men with T2D, according to the test profile, as a whole, there is a significant (p<0.05) increase in LU, SP, ST indicators. Moreover, if at BMI> 25 the LU indicator was at the level of 1.2, then with T2D it increased to 1.6, and the SP and TS indicators rose sharply from 1.1-1.2 to 1.7. Figure 7 shows a diagram of the changes in the profiles of this test in T2D in men and women at different values of the capillary blood sugar in 4 ranges. In general, men showed a linear increase in LU, SP and ST indicators with an increase in the level of glycemia. This growth reflects a sharp asymmetric increase in the right branches of the AC in comparison with the left. As for the hormone channel BL - in diabetes, its r / l ratio approaches to 1.0, which reflects the equality of both branches, which is usually observed in men in old age. This can be regarded as a breakdown of compensatory mechanisms in this system and the absence of its influence on the vital processes of the organism. Comparisons between the three groups of blood glucose ranges and the norm for right / left ratios were also made using the ANOVA test. In men, linear reliable relationships were noted for LU (p = 0.031), SP (p = 0.01), LR (p = 0.006), KI (p = 0.009). Thus, in general, the transition of men with high BMI to the category of patients with type 2 diabetes occurs due to an increase in the values of 4x AC - LU, LI, SP, ST. Moreover, the ST channel is probably the decisive component in this transformation.
In women, the test profile at different values of BMI Figure 8 at the level of r/ l ratios has significant differences from a similar profile in men. At the same time, a similar increase in the BL and especially SP channel is noted with an increase in the BMI value. According to TCM, a woman corresponds to the Yin function, but the activity of the sex hormonal channel BL is associated with monthly activity. In the middle of the cycle in fertile women, the right branch of this AC should prevail over the left at least 20-30% for conception to occur and the fetus begins to develop. Closer to the beginning of menstruation in the second phase of the cycle, a woman becomes similar to a man according to the test and the left branch of the BL canal prevails. Thus, normally, such a dependence should average the value of both branches. However, according to the graph in women, an increase in BL with an increase in BMI is also associated with an increase in its right branch - and it can be assumed that such a hormonal background contributes to the unilateral predominance of anabolic processes and the monthly cycle is disrupted. When BMI is less than 25, this indicator on the graph approaches 1.0, which, on the contrary, reflects the equality of the influences of two opposite phases of the hormonal cycle on the laterality of this AC, which, as a result, becomes symmetrical. In comparison of the test profiles in the assessment of BMI and T2D, women showed a sharp increase in the asymmetry of the LR channel on average to 2.0 (2 times) with a large range of fluctuations from 1.7 to 2.2. As shown earlier, such changes synchronously reflect changes in the level of glycemia. Significant differences in the profiles were also noted for AC –TE and SP.
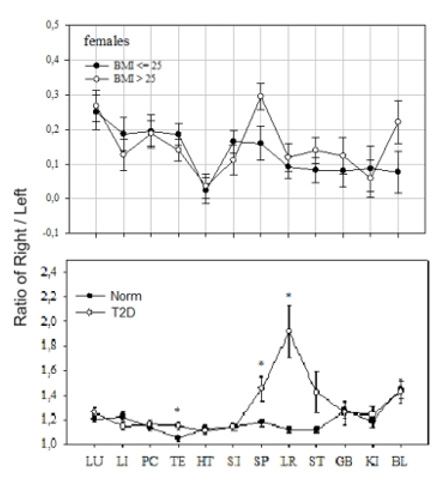
Figure 8: The averaged plots of the Akabane test profiles at the level of ratios of TS indices of r/ l branches of 12 AC of women with BMI are more and less than 25 in comparison with similar profiles in women with T2D and norm
According to the ANOVA-test, women with T2D showed a linear increase in TS simultaneously with an increase in glycemia in relation to r/ l according to liver AC (p = 0.002), SP (p <0.001), ST (p = 0.025). Usually, with an increase in BMI values over 25, an increase in glycemia is not significant and is noted only periodically. Then, at certain values of the TS, it increases synchronously with the growth of asymmetry in these AC and becomes constant. In general, in a comparative analysis of the data obtained, it can be assumed that in women a significant increase in LR is a decisive marker of the transition of excess body weight to T2D.
Thus, in general, by comparing the results of various studies, certain AС were established, the growth of which is critical for the transition of patients with overweight to the category of T2D patients. The next task is to construct the concept of connections and interaction of these channels based on the TCM.
Discussion
As you know, high BMI values are directly related to the onset of T2D, which is confirmed by numerous studies [1,4,26]. For example, according to a survey of women with T2D, 75.9% of them lead a sedentary lifestyle, 79.3% are obese, 75.9% have cardiovascular risk associated with certain indicators of the waist circumference [27]. What is the cause of these metabolic disorders? According to TCM, energy (Chi) in the body is taken from three sources:
a. The Chi of food through the primary element Earth enters
first into the AC of the stomach and then into the AC of the
pancreas-spleen, where it is carried through the body with blood. The dominant role of these AC in the nutrition of the
body is known from TCM [28,29].
b. at the level of the primary element Metal, this energy
combines with the Chi of the air through the lungs channel.
c. At the level of the primary element Water, this flow
connects with the hereditary Chi, which is located in the AC of
the kidneys. At the same time, “dirty energy” is excreted from
the body with feces and urine through AC- LI and BL, and pure
Chi enters into energy expenditures at the level of the primary
elements of Wood and Fire. At the same time, according to the
TCM, it is believed that the total supply of Chi is in the AC of
the kidneys, which, according of observations, corresponds to
the fat reserves in the paranephria [19,20,22,23]. When this
“operative reserve” is overflowed, it turns into belly fat, which is
reflected in the growth of BMI. For a more visual understanding
of the mechanisms of Chi transformation in real situations, let
us consider schematic models of the obtained BMI connections
with the AC at the level of 5 primary elements separately for
men Figure 9 and women Figure 10.
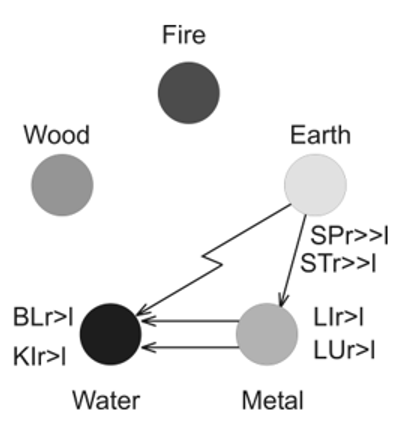
Figure 9: Model of regulation of metabolic processes at the level of 5 primary elements in men.
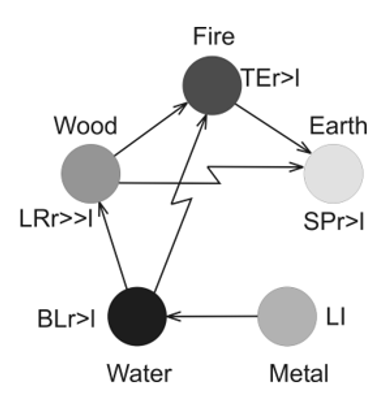
Figure 10: Model of regulation of metabolic processes at the level of 5 primary elements in women.
In both models of primary importance are the AC of the primary element “Earth” through which the energy of food enters the body. However, according to the data of step-by-step linear regression of BMI connections with the total AC activity at the level of 5 primary elements, women have significant relationships with the primary elements Earth (p = 0.003) and Tree (p = 0.04), while men have no dependences at such a high level of generalization. This underlines the significant difference in their metabolic systems as a whole at the level of this key primary element. However, at the level of certain AC, especially when considering the processes of transformation of high BMI values in T2D there are general mechanisms. So, at the level of the primary element Earth, these connections are especially pronounced in men through the AС of the stomach and pancreas, which often leads to hyperphagia. At the same time, in the presence of T2D in men there is a sharp asymmetry in these AС due to the predominance of their right branches Figure 6, which is likely, based on previously obtained models, is accompanied by a high activity of the contra insular hormone against the background of insufficient insulin production and resistance to it [20-22].
This process is also largely controlled by the hormone Leptin, which is released from adiposities in proportion to the mass of adipose tissue. Its level increases with general obesity in proportion to excess body weight and also depends on the state of the intestinal micro biota. This creates a vicious circle of regulation. One of the main functions of Leptin is the regulation of appetite by transmitting signals from fat stores by binding to Leptin receptors in the arcuate nucleus of the hypothalamus [30-32]. Consequently, the central nervous system is undoubtedly involved in these disorders. Such a pronounced asymmetry along the gastric canal in men, in turn, leads to an imbalance in BL, which controls the sex hormonal background, through “oppressive connections”. Such links between ST and BL have previously been described as one of the causes of male disharmonosis and impotence [17,18,22]. There is also a well-known proverb “The way to a man’s heart goes through the stomach”, but excessive food consumption is harmful. These changes are shown schematically in Figure 9. From the point of view of TCM, at the beginning of the movement of the system of five primary elements “along the vicious path”, there may be changes in the canal of the large intestine, which reflects significant changes in its microbial flora [33]. The large intestine contains about ~ 100 trillion microbes, which create their own biofield, forming its activity. Through this AC, the effects on the body from food, water and other external factors are realized. There is even a bi-directional microbiota-gut-brain connection that modulates brain function that contributes to bulimia [34]. In this model, this channel has direct connections with both the stomach (ST) and BL, so it can play the role of the initiator of all violations.
According to mathematical modeling [13-15], the micro biota has a huge impact on our body as a whole and even forms the second regulatory system of the body. Its changes lead to a change in the overall pH of the body. Therefore, even the most insignificant deviations of it lead to a change in AC-LI, which are then transmitted to the hormonal AC-BL. As a result, there is a decrease in sexual activity, which according to the test in men is tracked by the presence of high indicators of its right branch [17,18,23]. In turn, such a transformation according to the “motherson” rules adopted in TCM leads to an increase in the values of the right branch of the gastric AC due to the influence of Leptin and pancreas, which is reflected in the test profiles in T2D Figure 6 as a key moment in the transition of a high indicator BMI in T2D. As a result, a stable “Trigon” of pathological interrelations arises with the defeat of three of the 5 primary elements, which in such a vicious state support each other, which significantly complicates treatment. Women have a slightly different scenario, which is shown in Figure 10. The canal of the large intestine, according to Partial correlations Table 2, has no significant effect on the process. The main influence from the point of view of TCM can be exerted by BL, where the profiles with BMI> 25 show signs of dyshormonosis. Further from it there are 2 chains of influence: the first, through “oppressive connections”, concerns the TE channel, which controls the basic metabolism in the body through the thyroid gland and is thus directly related to BMI. In addition, this channel controls the cardiovascular system, which is associated with the risk of various hemodynamic complications, which are much more common in women than in men [17,18]. According to the test profile in T2D, its changes are visually insignificant, however, according to paired comparisons, they are reliable (t-test; p <0.05).
The second chain of influence goes in a circle of circulation in the AС of the «Tree», where it is associated with the formation of pronounced asymmetry in the AС of the liver. This AС is key in the formation of the TS profile in T2D. It is known that the inactivation of female sex hormones occurs in the liver. It is likely that the primary dyshormonosis leads to subsequent liver damage. In terms of depressing connections, the AС of the liver also affects the AС-pancreas, and with the AС of the stomach, in contrast to men, the connections are not so pronounced. Here, only the main structural connections at the level of the five primary elements are shown, which undoubtedly require additional study. However, such a visual scheme of the constructed picture of the transformation of one pathology into another on the basis of ТСМ provides new opportunities in the overall assessment of the situation at the level of each specific case, which we widely use for treatment in practice. Despite attempts to introduce mathematics in 5 elements with the aim of predicting and treating various diseases on this basis, it is very difficult for doctors in the West and East to understand This study shows another principle of monitoring, which is based on the use of metrology tools in the form of the Akabane test, the assessment of its profiles, the construction of regression and schematic models and then the therapeutic effect on their basis. In each specific case of transformation of this pathology, there are usually its own distinctive points that need to be analyzed during treatment. In this, an important role will be played by the assessment of test profiles, especially in terms of r /l ratios in the observation dynamics. Then we build an individual model of relationships at the level of 5 primary elements, which allows us to think over the tactics of treatment and take control of AC with high asymmetry.
Based on the obtained patterns, treatment with reflexology methods is also effective, because the key channels associated with the transformation of BMI in T2D are usually in the hypo, and their targeted stimulation at the level of individual branches of the AC by reflexotherapy methods, especially based on individual regression models, gives a good effect [17,18,23]. Of course, the therapeutic effect does not come immediately, because a significant restructuring at the level of bioenergetics is required under test control within 1-2 months. For correction, we use the Yang factor in the form of stimulating modulated IR radiation, with which we act on 2 points (Lo-point and Yuan) only on that branch of the AC, which is in the “Void” with an excess of Yin (www.chimaster. me) The impact is carried out in the “feedback” function until a painful response is achieved. The impact on each point lasts 2-3 minutes. In the course of 1 session, the correction is carried out on no more than three ACs. Then, after 20-30 minutes required for the completion of transient processes in the AC, a control test is carried out by which we evaluate the factor of reducing the level of asymmetry in the AC after exposure. After that, we put markers on the patient’s body at points for self-correction at home using the method of acupressure or warming them with lighted sandalwood sticks in combination with a diet [17,18,21,22,35]. Approximately every week we conduct control tests for such patients to assess the effectiveness of treatment. At the same time, more attention is paid not even to the BMI index itself, but to those symptoms and diseases that accompany its high values. The purpose of such corrective actions is to bring the patient’s existing profile closer to the norm profile under test control.
In addition to such reflexology, with high BMI rates, diet and drug therapy are prescribed, which is selected on the basis of the Akabane test using proven techniques [35]. Thus, such an integrated approach using metrology and mathematical modeling tools gives scientifically substantiated positive results in the treatment of this complex pathology. As the results of the studies have shown, the formation of high BMI indices and their transformation into T2D have many similar mechanisms, which, thanks to the TCM methodology, can be structured at the level of Yan / Yin, 5 primary elements, then 12 AC and 24 of their branches. This structuring makes it possible to isolate the fundamental key components of these transformations from hundreds of important reactions and physiological changes in the body. In our opinion, this methodology can be useful in assessing other diseases. In our opinion, the use of the Akabane test opens up new methodological possibilities in clarifying this issue for diagnosis and treatment, since it is possible to visually and simply track the mechanisms of this transformation according to the test profiles along with the assessment of BMI on new physical principles.
Conclusions
The Akabane test can detect and control various metabolic disorders associated with BMI growth at the individual level. With high BMI indices, it is possible to track the transformation of these changes in T2D. According to the test profile and the level of asymmetry between the branches of the AC during monitoring, it is possible to assess the dynamics and degree of disorders at the level of individual organs and physiological systems and thus control the effectiveness of treatment.
References
- Saklayen M (2018) The Global Epidemic of Metabolic Syndrome. Current Hypertension Reports 20(2): 12.
- Chockalingam A, Norman R Campbell, J George Fodor (2006) Worldwide Epidemic of Hypertension. The Canadian Journal of Cardiology 22(7): 553-555.
- (2018) GBD 2017 Risk Factor Collaboration. Global, regional, and national comparative risk assessment of 84 behavioral, environmental and occupational, and metabolic risks or clusters of risks for 195 countries and territories, 1990-2017: a systematic analysis for the Global Burden of Disease Study 2017. Lancet Global Health Metrics 392.10159: P1923-P1994.
- Singh GM, Goodarz Danaei, Farshad Farzadfar, Gretchen A Stevens, Mark Woodward, et al. (2013) “The age-specific quantitative effects of metabolic risk factors on cardiovascular and diabetes: a pooled analysis”. PLoS One 8 (7): e65174.
- Ahn C, Choi D (1986) Theoretical Study on Five Element Acupuncture, Dongguk University at Kyong-Ju, Dongguk Journal 5: 287-309.
- Chang-Beohm Ahn, Kyung-Jun Jang, Hyun-Min Yoon, Cheol-Hong Kim, Young-Kwang Min, et al. (2010) Sa-Ahm Five Element Acupuncture. J Acupunct Meridian Stud 3(3): 203-213.
- Valery Muzhikov, Elena Vershinina, Ruslan Muzhikov, Kirill Nikitin (2018) Structure of Interchannel and Five Primary Elements Connections According to the Test of Akabane International Journal of Chinese Medicine. 2(3): 18-29.
- H Umezawa (1993) Advanced Field Theory: Micro, Macro, and Thermal Physics IP, New York, USA, pp. 238.
- M Blasone, P Jizba, G Vitiello (2011) Quantum Field Theory and its Macroscopic Manifestations. Imperial College Press, London pp. 544.
- E Del Giudice, A De Ninno (2006) Coherent quantum electrodynamics in matter. Electromagn Biol Med 25: 522-530.
- E Del Giudice, G Preparata, G Vitiello (1988) Water as a free electric dipole laser. Phys Rev Lett 61 (9): 1085-1088.
- L Brizhik (2015) Influence of electromagnetic field on soliton mediated charge transport in biological systems. Electromagn Biol Med 34 (2): 123-132.
- Yingshan Zhang (2020) pH 7.35 to 7.45– Mathematical Reasoning of Treatment Principle Based on Yin Yang Wu Xing Theory in Traditional Chinese Medicine (II). International Journal of Chinese Medicine. 4(3): 37-53.
- YS Zhang, W L Shao (2012) Image mathematics-mathematical intervening principle based on Yin Yang Wu Xing theory in traditional Chinese mathematics (I). Applied Mathematics 3(6): 617-636.
- Y S Zhang, BB Zhang (2019) Acupuncture Treating Dystrophy Based on pH. -Mathematical Reasoning of Treatment Principle Based on Yin Yang Wu Xing Theory in Traditional Chinese Medicine (III). Chinese Medicine 10(2): 39-105.
- Akabane K (1956) Method Oi Hinaishin. Tokyo: Publisher unknown, 1956.
- Muzhikov V G (2000) Theory and practice of the thermal acupuncture channel diagnostics and treatment. St. Petersburg: Petrovsky Fund 2000.
- Muzhikov V (2003) Introduction to the energoskopia of man. ISBN 90-5179-103-8, Gopher Publishers: 412.
- Muzhikov VG, Nozdrachev AD, Bogdanov NN (2005) System of Thermopuncture Diagnostics and Monitoring of Patients with Type 1 Diabetes 4(15): 23-28.
- Muzhikov V, Vershinina E, Belenky V, Muzhikov R (2016) Significant heat sensitivity increase detected in various types of diabetes mellitus patients by Akabane test for use of management of diabetic patients. Acupunct Electrother Res 41(1): 1-19.
- Muzhikov V, Vershinina E, Muzhikov R (2017) System of Thermopuncture Diagnostics and Monitoring of Patients with Type 1 Diabetes. J Altern Complement Integr Med 3: 2-7.
- Valery Muzhikov, Elena Vershinina, Ruslan Muzhikov (2018) Opportunities of the Akabane Test for Diagnosis and Monitoring of Patients with Type 2 Diabetes. Journal of Diabetes and Metabolism 9: 2.
- Valery Muzhikov, Elena Vershinina, Vadim Belenky, Ruslan Muzhikov (2018) Assessing the links between anthropometrics data and Akabane test results. Journal of Acupuncture and Meridian Studies. 11(1): 31-38.
- Valery Muzhikov, Elena Vershinina, Ruslan Muzhikov, Kirill Nikitin (2019) The Method Of Individual Assessment Of The Action Of Insulin And Its Adequate Dose In Diabetes Mellitus World Journal Of Pharmaceutical Research. (WJPR) 8(7): 176-205.
- Valery Muzhikov, Elena Vershinina, Ruslan Muzhikov (2020) Possibilities of the Akabane Test and Cosinor Analysis to Predict the Level of Glycemia and the Individual Selection of Drugs and their Doses in the Treatment of Diabetes. Biomedical Journal of Scientific& Technical Research. (BJSTR) 29(3): 502-509.
- (2016) Diagnosis of Diabetes and Prediabetes. National Institute of Diabetes and Digestive and Kidney Diseases. June 2014. Archived from the original on 6 March 2016. Retrieved 10 February 2016.
- Maria Marta Amancio Amorim, Raquel Cristine de Souza, Alessandra Hugo de Souza, Maria Cristina Santiago (2020) Nutritional Profile of People with Diabetes Type 2 Attended on the Integrated Health Care Clinic of UNA University Center - Belo Horizonte. EC Diabetes and Metabolic Research (ECDMR) 4(9): 30-38.
- Wang Hongtu, He Juan, Zhai Shuangqing, et al. (2002) A review of the research on the regulation of the five zang organs by the spleen and stomach circulatory system. Journal of Beijing University of Traditional Chinese Medicine 25 (2): 1-4.
- Tian Zaishan, Wu Xianzhong, Chen Yufeng (2005) About abdominal brain (second brain). Chinese Journal of Integrated Traditional Chinese and Western Medicine Surgery 11 (5): 454-457.
- M Baratta (2002) Leptin-from a signal of adiposity to a hormonal mediator in peripheral tissues. Medical Science Monitor 8(12): RA282–RA292.
- E Jéquier (2002) Leptin signaling, adiposity, and energy balance, Annals of the New York Academy of Sciences 967: 379-388.
- BM Spiegelman, J S Flier (1996) Adipogenesis and obesity: rounding out the big picture. Cell 87(3): 377-389.
- Vinod Nikhra (2020) Impact of Dietary Modification on Microbiome: Exploring Therapeutic Implications. EC Diabetes and Metabolic Research 4(9): 07-19.
- Proctor L (2019) A review of 10 years of human microbiome research activities at the US National Institutes of Health, Fiscal Years 2007-2016. Microbiome 7 (1): 31.
- Sergeev IN, Thamer Aljutaily, Gemma Walton, Eduardo Huarte (2020) “Effects of Synbiotic Supplement on Human Gut Microbiota, Body Composition and Weight Loss in Obesity”. Nutrients 12(1): 222.
