 Research Article
Abstract
Background: Every living matter is characterized by rhythm in the basis of its existence and the laws of symmetry apply in it. System of acupuncture channels (АС) reflects the basic processes in the body, rhythm and symmetry are also peculiar to them, which through them can be estimated much more simply than, for example, based on biochemical or physiological parameters of the body.
Methods: A patient with type 1 diabetes performed 43 Akabane tests at different times of the day for 18 days. With each test, she recorded blood sugar, insulin dose and assessed the effect on the body of various other factors in arbitrary units (from 1 to 10) with an assessment of their effect on the level of glycemia using regression and correlation analysis. The rhythmic activity of АС was also analyzed using Cosinor analysis.
Results: It was found that the influence on the level of glycemia through certain AС is exerted by many external and internal factors. In routine monitoring of blood sugar, they cannot be foreseen, because blood glucose itself is the final product in a large chain of metabolic reactions that cannot be controlled in this way. The activity of certain AС reflects these influences and changes cyclically, which can be used to evaluate biorhythms. It was shown that a correctly selected medicine at an individual level restores symmetry in the body, which is broken at different levels from the effects of the disease.
Conclusion: Using the regression analysis and the Cosinor method for assessing the contribution of AС to glycemia, it is shown that different AС have different phases, amplitudes and periods of biorhythms, therefore, due to their interference within the same regression model, sharp fluctuations glycemia are possible, which can be predicted in time. By assessing the asymmetry at the AС level in the body, it is also possible to carry out individual selection of drugs and their doses
Keywords: Akabane Test; Medicine Action; Chronopharmacology; Kosinor - Analyses; Telemedicine
Introduction
Currently, despite the huge technological advances in the treatment of diabetes, the mechanism of the formation of glycemia in diabetes is not completely clear. Therefore, maintaining the optimal glycemic value and predicting its level is still very relevant for patients with diabetes. Typical for research in the field of biology and medicine is static representations in the form of correlation and regression dependences of some processes on others by the sum of their results. However, they give only a general point of view on a certain process, smoothing out the sequence of temporary events, which are often crucial for understanding the mechanisms of interaction in the body. Usually, for monitoring patients with diabetes, an assessment of the level of glycemia in the dynamics of observation is used. However, blood glucose is the final product in the multi-link chain of carbohydrate metabolism, where various organs and systems are involved. New possibilities are opened using the Akabane test [1] to monitor these patients, since the test indicators allow you to track the functional activity of various organs and systems involved in digestion [2-5]. This test also has high correlations with various biochemical parameters of blood, with the level of glycemia [4,6,7]. Thus, according to the test data, one can evaluate the entire chain of carbohydrate metabolism with an assessment of the contribution of each organ or physiological system and with the identification of the level and nature of regulatory failure.
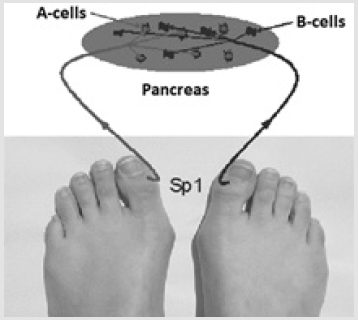
Figure 1: The principle of connections of SP1 points with the function of the pancreas.
Previously, a general model was shown of the relationship between the indices of certain AC and the regulation of glycemia in patients with type T1D, which was in good agreement with the results of subsequent studies [8]. According to this model (Figure 1), on the pancreatic canal, test indices at the SP1 point on the right and left separately reflect the total activity of either B or A pancreatic cells and vary in proportion to their participation in digestion. These changes are cyclical in nature and reflect 2 endogenous biorhythms associated with the activity of A and B cells (Figure 2). In addition to the pancreas, while maintaining its function, other organs and systems also affect the level of glycemia, and their contribution can be estimated, for example, using a regression model. This model can be represented as 2 scales with a set of channels in each of them with different signs and coefficients of influence on the level of glycemia. At the same time, both scales are in constant motion under the influence of biorhythms, due to which the “corridor of norm” is maintained for the most important indicators of the body. In the case when the function A or B of the cells is absent, their values in the dynamics of observation then do not change and pancreas does not produce its biorhythm at the level of its AC. In the case of pathology at the level of a organ, there is a loss of symmetry at the level of these subsystems, which can be assessed through changes in indicators of the left and right branches of their AC. This allows you to track the functional activity of various organs and systems of the body on new physical principles and, in addition, evaluate their endogenous biorhythms through the dynamics of changes in test parameters.
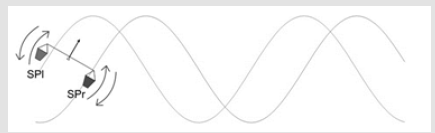
Figure 2: The principle of assessing the effect of biorhythms on the level of glycemia.
Materials and Methods
To quantitatively evaluate a channel’s activity level in TCM, the so-called “sacrificial stick” test was used in ancient times in China. This test involved a burning sandal stick that was brought in proximity to points at the tips of every finger and toe until the first sensation of pain. At each point, the pulse rate before pain was first felt, was measured. If the number of pulse beats was lower than the average one for all the channels, it proved the hyperactivity of an acupuncture channel and its corresponding organ. Conversely, when the rate was higher, it represented the inactivity of a channel and its corresponding organ. This test was described by the Japanese doctor Koben Akabane in 1956. Since then, the test has carried his name. This test measures the pain thresholds in temperature sensitivity (TS) when heat is applied to the “entrance-exit” points of each channel (LU11, LII1, PC9, TE1, HT9, SI1, SP1, LR1, ST45, GB44, KI1, and BL67) by applying an impulse light-emitting diode (LED) non-coherent infrared radiation (IR)-light onto the skin (f = 1 Hz, λ = 920nM), recording the total energy expenditure in joules [2-4, 9,10]. Each impulse radiates 0.07 joules of thermal energy. These measurements were carried out using a certified device- “Merid”, invented by the author of the paper. TS is our bodies’ basic reactive system; it is as significant as important indicators such as body temperature, as it gives a very clear representation of functional and psycho-physiological profiles. Their topography is shown in Figure 3.
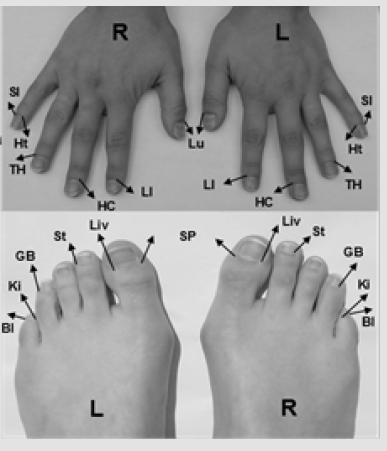
Figure 3: Topography of acupuncture points, used for evaluation of the AC in Akabane test.
According to classical Oriental literature as well as according to
our study results [3,4], the following channels have different regulatory
functions: LU- lungs channel, connected with the function of
lungs and tissue breathing.
a) Li- large intestine channel, connected with the large intestine
function and its microbe flora, it participates in the regulation
of arterial pressure, biochemical blood indices.
b) PC - pericardium channel, connected with the cardiac
muscle trophicity and its structure. In addition, it is connected
to muscular activity, arterial blood pressure levels and emotions.
c) TE- triple heater channel, connected to the central and
peripheral hemodynamic, and with body energy consumption.
In addition, it regulates the hormones in the body, thyroid and
hypophysis.
d) HT - heart channel, regulates the cardiac rhythm, body’s
physical strength
e) Si - small intestine channel, connected to the electrolytic
balance and food digestion.
f) SP- spleen-pancreas channel is connected to the pancreas
and immunity.
g) LR- liver channel is connected to liver function and central
nervous system, stress levels
h) St- stomach channel is connected to the digestion function.
i) GB- channel of the gallbladder is connected to the digestion
function and peripheral nervous system.
j) Ki- kidney channel is connected to the kidney function
and the adrenal glands.
k) BL- urinary bladder channel is connected to the urogenital
system, its functions and its related hormones, it reflects the
state of vertebrae column as well. Each channel consists of the
left (l) and the right (r) branch between which normal symmetrical
activity balance is maintained.
To evaluate the parameters of the biorhythmic activity of organs
and body systems, the Cosinor analysis method [11-15] is
currently widely used, when using the smallest standard deviations
from points with real measurements of АС parameters in the dynamics
of observation, we can construct a resulting curve reflecting
the biorhythm. To calculate the biorhythm parameters, we used
the licensed TSA program (Time Series Analysis - Cosinor V-6.0
Lab View. License N 125403071), as well as analogues of this program.
Statistical decisions were made at a significance level of 5%
(р≤0.05). Data analysis was provided using software package SPSS
Inc. V 15.
Results
Since group statistics using correlation, regression, and FA smooth out the effects of biorhythms, then for an example of real monitoring of the effect of biorhythms on glycemia, we will give observation of a woman aged 24 years who has suffered from T1D for 12 years. She gats intensive insulin therapy using basal-bolus regimens with a total insulin dose of 14 to 55 units per day, depending on the situation. In this case, glycosylated hemoglobin (HbA1c), -7.42%; however, C-peptide = 1.06, which corresponds to its normative values (0.37-1.47). During monitoring, the patient independently for 18 days at different times of the day made 43 Akabane tests with simultaneous measurement of sugar on an individual glucometer. In addition, to assess various factors affecting the level of glycemia, each time with the test she recorded in arbitrary units (from 1 to 10) the amount of food eaten, the level of physical activity, as well as outdoor temperature, time after eating and the day of the menstrual cycle since the onset of menstruation. Figure 4 presents its averaged scaled TS profile of the patient for 18 days of observation at the level of 24 AС normalized to the average level of the profile across all channels.
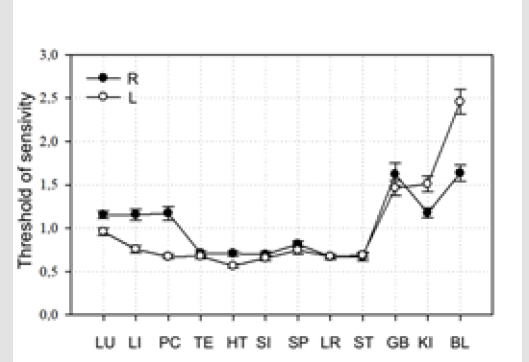
Figure 4: Scaled TS profile 24 channels normalized to the average level of indicators at the level of the right(R) and left(L) sides.
It is known that the pronounced asymmetry between the right and left branches of the AS reflect regulatory malfunctions in the control of the glycemia level by the body [4-7,16]. As follows from the graph, the greatest asymmetry is observed for AC-LI, PC, GB, KI, BL. Moreover, the asymmetry and deviation of indicators in the dynamics of observation for SP and LR is practically absent, which indicates the absence of the influence of the pancreas on the level of glycemia , because with preserved connections, the performance of these AС usually changes synchronously with a change in glycemia level [8]. (Figure 5) According to our observations, this situation arises when endogenous insulin is replaced by exogenous in non-regular injections and regulatory failure occurs with inhibition of B-cell function. In this case, the level of C-peptide remains within the normal range, which indicates the potential ability of B- cells to produce their own insulin. Figure 2 shows the average graph of glycemia changes with the range of daily fluctuations in comparison with the total daily dose of insulin for 18 days of monitoring. At the same time, the daily dose of insulin ranged from 5 to 55 units and the glycemia level varied from 4.0 to 21mmol/l, which reflects a generally ineffective control using these medications. There is also a large range of glycemic values; for example, on the 10th day of monitoring, it changed from 9.1 to 19mmol/l., and on the 14th day of monitoring, it changed from 3.8 to 17.2mmol/l per day. Table 1 shows the correlation of AС with several additional factors that were evaluated during monitoring; such as the temperature in the street, the amount of food eaten, the level of physical activity, the day of the menstrual cycle.
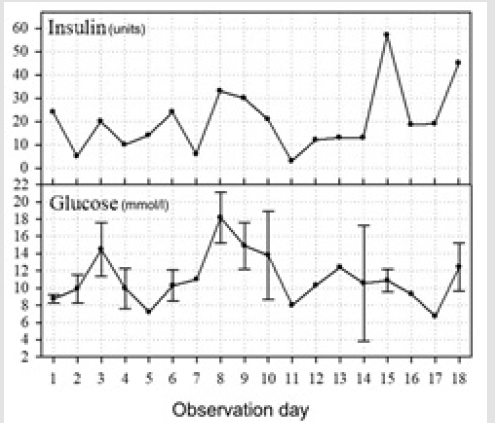
Figure 5: Graphs of daily values of glucose and insulin during the observation.
Glucose data are averaged per day, ± the error of the mean, insulin is summed.
As a result, a significant connection was established between channels with the temperature outside (via Lil, PCl, BLl ), on the amount of food (MPL, LRl ), physical load (TEr, PCl, BLl ) and the day of the cycle that effects on MPr, Lil, BLl. Most of the newly analyzed factors influenced the sex hormones through channel BL. The link between SP and indicating the side (right-r, left-l) and LR with the amount of food and time after eating, in our opinion, is related to the functional insufficiency of these systems, which is not observed in healthy people. The main factor in the formation of high glycemia is in this case the nervous factor through the GBl channel (r=0.30; p-0.04), which is especially manifested in the opinion of the patient at the time of menstruation in the form of increased irritability. The right branch of the hormonal channel BLr and STr of the stomach also reliably reflects the level of glycemia. This connection is obvious, as is the connection between BLl and GBl in the system of the five primary elements [17]. All these dependencies, in our opinion, require more specific targeted treatment, and not treatment according to the “general scheme” without considering individual circumstances.
The model included 5 channels with the most significant effect on the level of glycemia. In this model, through the STr channel, the body receives energy with food, which is mainly transformed into glucose. LIr channel - reflects the state of intestinal microflora, which affects the production of endogenous insulin [3,4,6]. Also, in the indicators of this channel, a connection with the weather and the environment is traced. SP- reflects the activity of A -cells with the production of contrainsular harmony. GBr- reflects the activity of the peripheral nervous system mainly at the level of parasympathetic. BLr- reflects the state of sexual hormonal background. Thus, in general, this individual model is quite logical and these factors are decisive in the genesis of glycemic regulation in this individual case. The range of observed and predicted values for this model is presented in Figure 6.
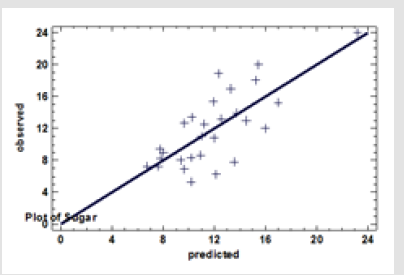
Figure 6: Polygon of the distribution of observed and predicted glucose values by the regression model.
Since each of the channels is subject to certain rhythmic changes, let us consider with Cosinor analysis the main parameters (period and amplitude) of these rhythms for the channels that are included in this model. In general, different periods and amplitudes of rhythmic activity are noted in Figure 7. The maximum period of 24.1 hours is observed on the left branch of the channel SPl, and the minimum period of 5 hours on BLr. The maximum amplitude in arbitrary units is marked on the right branch of GBr, and the minimum on STr. Considering the data obtained, we combined all 5 biorhythm plots into one (Figure 8), Where the maximum and minimum amplitudes for each channel are set considering real measurements and time intervals are synchronized. As a result, due to the interference of 5 rhythms, a complex pattern with non-repeating episodes of interactions is noted. Based on the parameters of the regression model (Table 2), the resulting theoretical glycemia level was calculated using the digitized values of the amplitudes at each point in time according to the graph (Figure 9) for individual sinusoids of each of the 5 AC. The result is a theoretical graph of glycemic changes over time with the conditional assumption that the real biorhythm is an ideal sinusoid, and the additional action of insulin, food, physical activity, etc. in this case was not analyzed. In general, repeated fragments with glycemic level profiles after 5 days are noted. To assess the effect of insulin on АС, consider another stepwise regression model presented in Table 3. This model has 95% explainable variance due to the influence of a larger number of АС. It is interesting to note that insulin in this case mainly affects the right branches of AC, which control the accumulation of energy in the body, while their left branches control energy consumption [18]. The only exception is the PC channel, which controls muscle activity. Both its branches with different signs of influence and similar regression coefficients entered the model. Thus, in this case, insulin affects both anabolic and catabolic processes in the muscles.
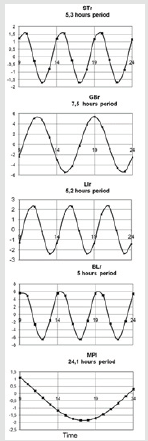
Figure 7: Graph of changes in amplitudes and periods of 5 Ac based on Cosinor analysis.
In this regression model of insulin bonds, only 2 channels — LIr
and STr — are repeated with the model of AС bonds with glycemia
(Table 2) and they have different signs of influence. According to
previous studies [4,19], it was found that a correctly selected medicine
or other therapeutic effect should restore the symmetry broken
by the disease in the body according to certain systems, which
is reflected through the channels in changing their sign of influence
or in changing the right or left branch of the channel in comparison
with the time of treatment. In this case, the results of comparing
two models of the influence of glucose and insulin on the channels
show that insulin levels the effect of glycemia due to restoration of
symmetry and harmony only in these two body systems. Therefore,
in this case, such a treatment is not enough. Moreover, an increase
in the dose of insulin, for example, with insulin resistance, can on
the contrary, lead to a breakdown of compensation and the appearance
of reverse asymmetry, which is fraught with new problems,
because the presence of any asymmetry on the right/left level, according
to the theory of interaction of 5 primary elements - will
strike a bounce on other AC and harmony will be broken in other
organs and systems . In this case, the proverb will be true: “Оne is
cured, the other is crippled. “With ideally selected therapy, in the
regression models of AC connections with glycemia and insulin, the
same channels should participate, but with opposite signs of influence
or the opposite side. Only in this case, the drug will be as effective
as possible. it will restore symmetry and harmony in the body
at the level of certain organs and systems affected by pathology.
If a larger number of AС is introduced into the step-by-step
regression model, then the percentage of explainable variance can
be significantly increased, since a greater number of AС reflects a
greater number of factors affecting glycemia. Such a model of the
relationship of glycemia level with 11 channels already has 86% of
the explained variance and is presented in Table 4. Part of АС are
included in the model from Table 1, reflecting several additional external
and internal factors influencing the level of glycemia. As in
the previous simplified model (Table 2), the level of glycemia is significantly
affected by SPl AC, which reflects the activity of A -cells,
and therefore the counter insulin hormone with a negative vector of
influence on glycemia (the higher the SPl channel values - the lower
the glycemia level). Although the counter-insular hormone leads to
an increase in glycemia, however, the high values of the AC parameters
according to the Akabane test generally characterize the hypofunction
of the organ or system. Therefore, everything is logical
- an increase in the values of the SPl channel with a negative sign
of influence leads to a decrease in glycemia. However, this channel
was not included in the model of relations with insulin.
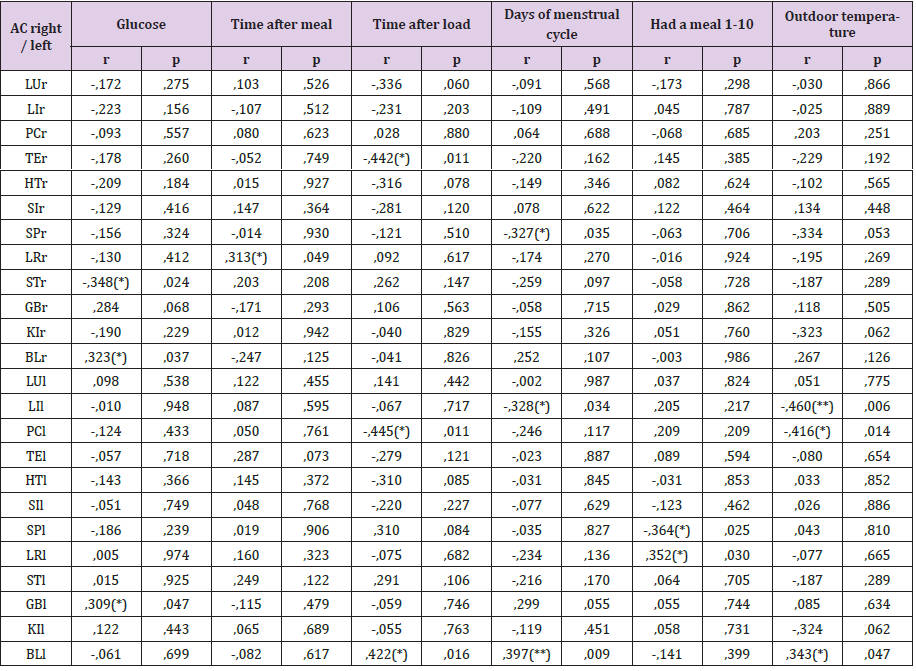
Table 1: Connection of channel activity with additional factors of vital activity.
*Correlation is significant at the 0.05 level (2-tailed).
**Correlation is significant at the 0.01 level (2-tailed).
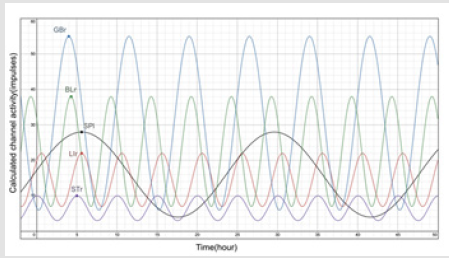
Figure 8: Schedule of joint activity of biorhythms of 5 AC for 2 days.
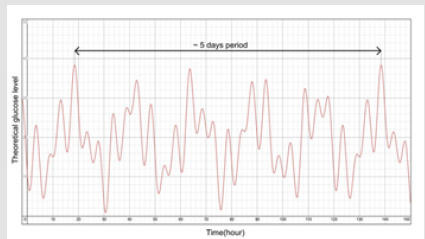
Figure 9: The resulting predicted changes in glycemia over time.
When comparing models of the effect of insulin on AС (Table
3) and this model of glycemic relationships, only 2 AC (+ LIr, and +
PCl) are determined, which have mirror-opposite signs, and therefore
influence vectors. In addition, in both models, there is an influence
with a positive vector of the Stomach channel (ST), but in the
model of communication with insulin it is the right (r), and with
glucose its left branch (l), which is also regarded as a positive effect
of treatment. In general, analyzing the action of insulin in this case,
considering additional connections, it can be noted that it does not
have an enough effect on the regulation of glycemia. In the case of
its high individual activity, there should be a “cohesion” at the level
of most AС, which should be the same in both models but different
in sign of influence and in their laterality. Only in this case, during
treatment, will the asymmetry be balanced and harmony will be
formed in both branches of the defined AC, which is accompanied
by a pronounced therapeutic effect. In this case, unfortunately, this
effect is only partially observed. From this point of view, the most
optimal type of treatment in this case is treatment with drugs that
selectively reduce the activity of A-cells.
It should also be noted the participation in this model of AС
connections with glycemia of both branches of a number of AC, in
particular LI, which is associated with the production of endogenous
insulin and channel BL- which reflects the activity of sex hormones
[3,4] and both branches of these AС have opposite signs of
influence . This typical situation is similar to the previously shown
“carbohydrate scales” at the level of the pancreatic canal (Figures
1 & 2), where the right branch reflects the activity of B- cells and
the left A- cell, which produce hormones that are opposite in effect
on glycemic level. This principle of regulation is universal, only in
different AС it concerns different organs and systems and their indicators,
but everywhere it is well monitored through the activity of AС. Thus, in these models at the level of different physiological systems,
in a similar way, due to the participation of the right and left
branches of the AС with opposite influence vectors, the regulation
of the “corridors of the norm” takes place according to various indicators
of the entire carbohydrate metabolism chain which can thus
be monitored. Such regulation is carried out with the formation of
a wave process of activity with a certain period and phase in time.
If you find the biorhythms of these AС, the process of assessing and
predicting the level of glycemia will increase significantly, because
it will be possible to more accurately predict the rise and fall due to
the interference of a larger number of АС.
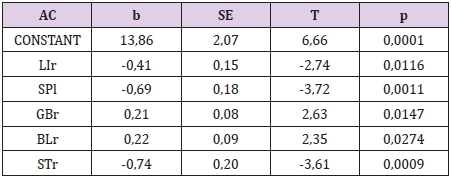
Table 2: A regression model of the relationship between glycemia and AС activity.
R-squared = 56,54 percent.
R-squared (adjusted for d.f.) = 48,98 percent.
Standard Error of Est. = 3,33.
Mean absolute error = 2,40.
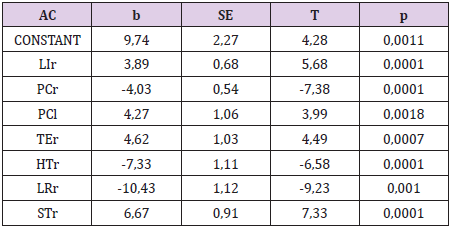
Table 3: Regression model of the effect of insulin on the channels.
R-squared = 90,57 percent.
R-squared (adjusted for d.f.) = 85,07 percent.
Standard Error of Est. = 0,79.
Mean absolute error = 0,48.
Discussion
The AS system is the oldest real regulatory system in living nature, including in the human body [20-24]. The whole acupuncture system is built on it, which has existed for many millennia and has proven its effectiveness in practice. There is convincing data on the effect of glycemia on the activity of certain AC. This data cannot be ignored, because they can be a key theoretical basis in creating a new promising monitoring system for patients with diabetes based on new physical principles. In this design, AC act as sensors from which you can read information about the state of certain internal organs and systems and thus monitor in time the entire chain of energy conversion in the body. Typically, such studies are devoted to generalized statistics for a group of people. But then, due to averaging, the truth becomes blurred and does not reflect individual reality. Therefore, it is much more productive, especially to assess the effect of biorhythms, to study one organism with an assessment of its features. In this case, as a rule, a lot of seemingly insignificant nuances are revealed, the combination of which gives new important decisions and conclusions that slip away when assessed at the level of group statistics. In this case, using the example of a specific patient, one can see that many factors influence the level of glycemia, which are reflected in the activity indicators of certain AS. Each AS seems to adsorb strictly defined effects on the body in the mode of selective resonance with several internal and external factors.
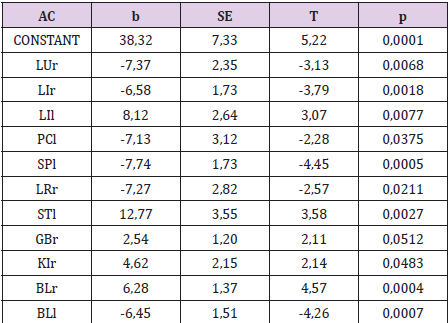
Table 4: Regression model of the influence of glycemia on the channels.
R-squared = 86,58 percent.
R-squared (adjusted for d.f.) = 75,84 percent.
Standard Error of Est. = 2,29.
To illustrate the effect of glycemia, we took 2 regression models,
of which only 1 was illustrated by biorhythms of 5 AС, because using
this simplified model, we could show more simply and clearly the
principle of forecasting based on the analysis of biorhythms. In the
second model, already 11 АС were used for analysis and therefore
it is much more difficult to evaluate the influence of interference
in the manual mode. In this case, computer simulation is already
needed to identify crisis periods in time. It would be ideal to assess
the impact of all 24 major АС included in the system of five primary
elements, since in general, they reflect the whole gamut of internal
and external processes affecting our body. Using this AС system as a
user-friendly marker of changes in the body, it is possible to build a
monitoring system based on new physical principles. Assessing the
rhythmic component of the dynamics of changes in AС, it is possible
to determine the basic parameters of biorhythms at the level of
various organs and physiological systems. This provides new tools
in the assessment of glycemia in patients with diabetes.
These rhythms at an individual level, with a measured nature
of life, characteristic of patients with diabetes in general, have high
repeatability, so they can be extrapolated to the future for 1-2 days in advance and thus predict the level of glycemia for more adequate
therapy. Similarly, this technology can be used to monitor various
concomitant diseases in diabetes, for example, to predict hypertensive
crises, because the AС system clearly reflects the formation
of arterial hypertension on the basis of group and individual
regression models with the possibility of predicting them based on
the principles of biorhythm interference [3,4,24]. Another area of
application of this system is monitoring the effectiveness of various
drugs at the individual level and assessing their optimal doses
based on the principles of restoring symmetry and harmony in
the body. If, however, additionally, take medicines based on chrono-
pharmacology simultaneously with the individual biorhythm
of certain organs at certain hours-this way you can significantly
reduce their dose without compromising the quality of treatment.
Technically, these principles and the technology itself can be implemented
in the form of a miniature wearable gadget in combination
with a Smartphone [25,26].
Conclusion
a. Changes in the activity of certain AС reflect the effect on
the body of glycemia and insulin, so their indicators can be used
to monitor patients with diabetes.
b. Considering the impact on a specific organism of various
environmental factors, physical activity and food products
through an assessment of the activity of AС, you can track their
effect on the level of glycemia non-invasively through mathematical
modeling
c. Due to the interference of AС biorhythms in time, dangerous
periods arise that can be predicted based on Cosinor analysis.
d. By the significance of the effect on glycemia and various
drugs, such as insulin, on AС, it is possible to evaluate the effectiveness
of it and other drugs and their doses to a specific organism
on the basis of the principle of restoration of symmetry
at the right/left level.
Disclosure Statement
The authors declare that they have no conflicts of interest and no financial interests related to the material of this manuscript.
References
- Akabane K (1956) Method Oi Hinaishin. Tokyo.
- Muzhikov VG (2000) Theory and practice of the thermal acupuncture channel diagnostics and treatment. St. Petersburg: Petrovsky Fund.
- Muzhikov, V (2003) Introduction to the energoskopia of man. ISBN 90-5179-103-8, Gopher Publisherspp. 412.
- Muzhikov V, Vershinina E, Muzhikov R(2017) System of Thermopuncture Diagnostics and Monitoring of Patients with Type 1 Diabetes. J Altern Complement Integr Med 3: 2-7.
- Valery Muzhikov, Elena Vershinina, Ruslan Muzhikov (2018) Opportunities of the Akabane Test for Diagnosis and Monitoring of Patients with Type 2 Diabetes. Journal of Diabetes and Metabolism 9: 2.
- MuzhikovVG (2002) German Patent DE 199 83 992 Method for Determining Blood Indexes and Device for Embodying thereof European Patent and Trademark Attorneys, N12, WO 01/45560 A1.
- Valery Muzhikov, Elena Vershinina, Ruslan Muzhikov, Kirill Nikitin (2018) Thermopuncture for the diagnosis, monitoring, and treatment of patients with type 2 diabetes. Journal of Acupuncture and Meridian Studies 11(5): 323-331.
- Muzhikov V, Vershinina E, Belenky V, Muzhikov R (2016) Significant heat sensitivity increase detected in various types of diabetes mellitus patients by Akabane test for use of management of diabetic patients. Acupunct Electrother Res 41(1):1-19.
- Muzhikov VG, Nozdrachev AD, Bogdanov NN (2005) Discrete Thermopuncture Test. Report 1. Reflexology 4(15): 23-28.
- Muzhikov VG (2010) Patent of Germany N 20 2010 018 135.6. Device for reflex correction of functional infringements of the organism.
- Nelson W, Tong Y, Lee J, Halberg F (1979) Methods for cosinor-rhythmometry, Chronobiologia 6(4): 305-323.
- Cugini P, Di Palma L (1994) Cosinor analysis: a procedure for estimating biological rhythms as integral function by measuring the area under their best-fitting waveform profile. Biological Rhythm Research 25(1): 15-36.
- Bingham C, Arbogast B, Cornélissen G, Lee Jung K, Halberg F (1982)Inferential statistical methods for estimating and comparing cosinor parameters, Chronobiologia 9(4): 397-439.
- Boden G, Chen X, Urbain J (1996) Evidence for a Circadian Rhythm of Insulin Sensitivity in Patients With NIDDM Caused by Cyclic Changes in Hepatic Glucose Production. Diabetes 45(8):1044-1050.
- David S Stoffer, Robert H Shumway (2017) Time Series Analysis and Its Applications. EZ Green Edition pp. 545.
- Muzhikov VG, Lesogor VM, Reukov AS (2000) System of Monitoring and Correction in the Rehabilitation of Patients Suffering from Diabetes Mellitus. Methodical recommendations for doctors by the Medico-Social Expert Bureau of the Ministry of Labour and Social Development of the Russian Federation. CBNTIN 12.
- Valery Muzhikov, Elena Vershinina, Ruslan Muzhikov, Kirill Nikitin (2018) Structure of Interchannel and Five Primary Elements Connections According to the Test of Akabane. International Journal of Chinese Medicine 2(3): 18-29.
- Valery Muzhikov, Elena Vershinina, Vadim Belenky, Ruslan Muzhikov (2018) Assessing the links between anthropometrics data and Akabane test results. Journal of Acupuncture and Meridian Studies 11(1): 31-38.
- Valery Muzhikov, Elena Vershinina, Ruslan Muzhikov, Kirill Nikitin (2019) THE METHOD OF INDIVIDUAL ASSESSMENT OF THE ACTION OF INSULIN AND ITS ADEQUATE DOSE IN DIABETES MELLITUS. World Journal of Pharmaceutical Research. (WJPR) 8(7): 176-205.
- H Umezawa (1993)Advanced Field Theory: Micro, Macro, and Thermal PhysicsAIP, New York, USA.
- M Blasone, P Jizba, G Vitiello (2011)Quantum Field Theory and its Macroscopic Manifestations. Imperial College Press, London.
- Del Giudice, A. De Ninno(2006)Coherent quantum electrodynamics in matterElectromagn. Biol Med 25: 522-530.
- E Del Giudice, G Preparata, G Vitiello (1988)Water as a free electric dipole laser.Phys Rev Lett 61: 1085-1088.
- M Blasone, P Jizba, G Vitiello (2011)Quantum Field Theory and its Macroscopic ManifestationsImperial College Press, London.
- Muzhikov VG (2005) Thermopuncture monitoring of the functional state in patients with hypertension. Reflexotherapy2(13): 29-33.
- Muzhikov VG (2015) Chinese patent ZL 201080024594.X. Device for reflex correction of functional infringements of the organism.
