 Research Article
Abstract
A simple, specific and validated reverse phase high performance liquid chromatography method was developed for determination of drug related substances (impurity) of Darunavir in formulation. Method development includes optimization of stationary phase (column) and mobile phase flow rate for the resolution of six known impurities and one unknown impurity and Darunavir. Development of HPLC method for estimation of Darunavir related substance in formulation was carried out on Zorbax SB-C8, 250 x 4.6mm, 5μm by using a gradient mode of the mobile phase flow rate at 1ml/min with the same mobile phase as, ACN : Buffer pH 4.0 (Mobile phase B:Mobile Phase A). The stability-indicating capability of the method was proved through the solution state stability, solid state study and it was concluded that purity threshold was found to be greater than purity angle. A good linear relation exists over the range of 50 to 150 % specification level with a correlation coefficient value of 0.9998Validation of the method was successfully established by performing various validation parameters such as specificity, precision, linearity, accuracy, LOD, LOQ, robustness, ruggedness according to ICH guidelines.
Keywords: Darunavir; HPLC Method Development; Assay of Drug in Formulation; Estimation of Drug Related Impurity; Stability Indicating Forced Degradation Method; Validation of the Method
Introduction
International conference for harmonization (ICH) provides
regulatory guidelines, such as ICH Q3A guidelines for the
identification, quantification of impurities in new drug as well as
pharmaceutical formulation. Therefore, it is necessary to conduct
the impurity profiling to give documentary evidence that these
impurities are present within the specified limits as predefined
by the toxicological studies and to limit or to decrease the levels
of these impurities in the formulation. For this, various analytical
methods are available for the quantitative determination of
impurities even at trace levels, which in turn ensures the consistent
quality output and also safety & efficacy of drug therapy [1].
Generally forced degradation/stress testing is used to generate
the samples for stability-indicating assay methods. Forced
degradation/stress testing is defined as “the stability testing of drug
substance and drug product under conditions exceeding those used
for accelerated stability testing” [2]. Degradation can be achieved
by exposing the drug, for extended periods of time, to extremes
of pH (HCl or NaOH solutions of different strengths), at elevated
temperature, to hydrogen peroxide at room temperature, UV light,
and to dry heat (in an oven) to achieve degradation to an extent of
5–20% [3,4]. Nowadays stability indicating methods had the main
focus on the estimation of the amount of drug substance present
in the marketed preparations. So, such type of testing methods is
known as specific stability testing methods.
These methods involve the estimation of the amount of
drug substance in the presence of other impurities, excipients,
degradation products without their separations. The presence of
other impurities and degradation products of drug substance may
be responsible for the adverse effects of drug products. It makes the
given drug product unsafe to use clinically [5]. ICH guidelines have
guided the preparation of stability testing protocols for registration
of new drug substance and product in USA, Japan, and European
Union countries. It provides the requirement of three types of
stability testing such as long term stability studies, accelerated
stability study and intermediate stability study for four climatic
zones. ICH guidelines also guide qualification, identification, and quantification of impurities in drug substances and drug
products to determining its thresholds [6,7]. Knowing these USFDA
regulatory requirements and need of impurity / drug related
impurity profiling [8], Darunavir drug had been selected for our
current research work. Various new protease inhibitor drugs used to
treat HIV infection. Among them, Darunavir is a second-generation
protease inhibitor (PIs), designed specifically to overcome
problems (Drug resistance problems) with the older agents in
this class [9]. Darunavir drug sold under various brand names
(dose:100mg/400mg) [10]. It acts on the HIV-Aspartyl protease
enzyme which is needed by virus to cleave the HIV polyprotein
into its functional fragments. The chemical name of darunavir [11]
is (3R, 3aS, 6aR)-hexahydrofuro [2,3-b]furan-3-yl(1S,2R)-3-[[(4-
amino phenyl) sulfonyl] (2-methylpropylamino] -1 -benzyl-2-
hydroxypropyl] carbamate corresponding to the molecular formula
C27H37N3O7S and a relative molecular mass of 547.68g/mol (Figure
1).

Figure 1: Structure of Darunavir and Darunavir impurities-I,II,III,IV,V and VI.
Darunavir exists as polymorphs in the form of Darunavir amorphous, Solvates and Hydrates. The ethanolate and hydrate forms exist in the form of crystals, whereas the non-solvated form is amorphous. When in the formed crystalline forms exist solvent molecules, water, salt, excipient or impurity has a pseudo polymorphic behavior and it can occur during handling, processing and storing. The tendency of a molecule to form solvates is related to the molecular structure, standards of hydrogen bonding and crystal packing. The solvent serves to stabilize the structure and desolvation process results in the formation of an amorphous form [12]. Literature survey reveals that Stability-indicating HPLC [13], RP-HPLC [14-16], IR [17], LC-MS [18] and UV Spectrophotometric methods [19] are reported for determination of darunavir as ethanolate form but no methods are reported for determination of darunavir in its amorphous form. Hence the present work describes the development and validation of HPLC method for its assay and related substance determination in amorphous form of the drug.
Materials and Methods
Apparatus
The analysis was carried out on a HPLC-Jasco LC-Net II/ADC equipped with Quaternary Gradient pump PU-2089 plus, multi-wavelength detector MD-2010 plus with manual injector with 20µL loop and a reserved phase ACE C18 column (150x4.6mm,5µ) with pore size of 100Ao was used for chromatographic studies, Jasco v-630 -UV-visible spectrophotometer , pH meter EI, Model No. 1102012, Stability Chamber -THERMOLAB, Model No.:TS 00002008, Membrane filters with cellulose filter paper of 0.45µ , Sonicator model PCI Mumbai, Model No. 3.5L 100H , Weighing balance:Shimadzu AUX220 and Calibrated glassware’s were used throughout experimental work.
Chemicals and Solvents
Acetonitrile and Maethanol (HPLC Grade), Hydrochloric acid, Sodium hydroxide, Hydrogen peroxide, Pot. Dihydrogen phosphate, O-phosphoric acid of analytical grade. Distilled water was used throughout the experimental study.
Experimental
Sample preparations for Development of HPLC Method for Darunavir Related Substance Estimation in Formulation
Preparation of Solutions:(Diluent:- Methanol)
i. Preparation of Standard Solution of Darunavir: A standard solution of darunavir 0.24mg/mL was prepared using methanol as diluent. Further 1.0mL of this solution was diluted to 100.0mL in volumetric flask with diluent and mixed. (Concentration of Darunavir: 2.4μg/mL)
ii. Preparation of Impurity stock solution (One solution for each Impurity): Standard impurities DAR-I, DAR-II, DARIII, DAR-IV, DAR-V and DAR-VI were weighed separately and transferred to a series of 50.0mL volumetric flasks and diluent was added, sonicated to dissolve and volume were made up to the mark with diluent and mixed. (Concentration of about each Impurity: 80μg/mL).
iii. Preparation of Darunavir impurity spiked solution: An accurately weighed quantity about 120.0mg of Darunavir standard was transferred to 100.0mL volumetric flask, about 50.0mL of diluent was added, sonicated to dissolve and cooled, from each impurity stock solution DAR-I, DAR-II, DAR-III, DAR-IV, DAR-V, DARVI 3.0mL was added and volume made up to the mark with diluent. (Concentration of DAR-I, DAR-II, DAR-III, DAR-IV, DAR-V and DARVI Impurity 2.4μg/mL and Darunavir 1200 μg/mL).
iv. Preparation of Buffer Solution pH 4.0: An accurately weighed quantity about 1.36gm. of potassium dihydrogen phosphate in 1000ml of water and pH adjusted to 4.0 ± 0.05 with Ortho-phosphoric acid, it was then filtered through 0.45μ nylon membrane filter.
v. Preparation of Mobile Phase:
a. Mobile phase A: Potassium dihydrogen phosphate Buffer
pH 4.0
b. Mobile phase B: 100% Acetonitrile
vi. Selection of Mobile Phase: Mobile phase was selected on trial and error basis. Using following chromatographic parameters, various trials were carried out to select suitable gradient program of mobile phase for resolution of impurities.
a. Column :-Zorbax SB-C8, 250 x 4.6mm, 5μm.
b. Detection Wavelength :- 265nm
c. Temperature :- 60 °C
vii. Gradient Program: (Table 1)

Table 1.
A 20μL SST solution of Darunavir Standard Spiked with Impurities solution was injected and chromatogram recorded.
Study of System Suitability Parameters
Preparation of System Suitability Solution (SST): An accurately weighed quantity about 120.0mg of Darunavir was transferred to 100.0mL volumetric flask, 50.0mL of diluent was added, sonicated to dissolve, cool and 3 mL portion of DAR-I impurity stock solution added and volume was made up to the mark with diluent and mixed (Solution S1). (Concentration of DAR-I Impurity 2.4μg/mL and Darunavir 1200μg/mL).
Sample Preparation for Study of Linearity (Calibration Curve)
Preparation of DAR-I Impurity Stock Solution: An accurately weighed quantity about 3.0mg of DAR-I impurity was transferred to 100mL volumetric flask,70.0mL of diluent was added, sonicated to dissolve and volume was made up to the mark with diluent and mixed. (Concentration 30.0μg/mL Stock solution).
Darunavir Standard Stock Solution: An accurately weighed quantity about 3.0mg of Darunavir standard was transferred to 100mL volumetric flask; add 70.0mL of diluent, sonicated to dissolve volume made up to the mark with diluent and mixed. (Concentration 30 μg/mL Stock solution)
Sample Preparation for Validation of Method:
Preparation of DAR-I Impurity Stock Solution for Accuracy: An accurately weighed quantity about 3.2 mg of DAR-I impurity was transferred to 50 mL volumetric flask, 30mL of diluents was added, sonicated to dissolve and volume made up to the mark with diluent mixed. (concentration of 60.7μg/mL as a stock solution).
NOTE: Impurity is spiked in 2nd dilution of sample solution.
Preparation of Sample for Linearity & Range: The working concentration level of Darunavir is about 160μg/mL, was prepared in diluent.
Results and Discussion
Selection of λmax by UV Spectroscopy
Standard solution of Darunavir 10 μg/mL was scanned in the range of 400-200nm in 1.0cm cell against solvent (methanol) blank and spectrum were recorded. The spectra of Darunavir standard solution is shown in Figure 2. The λmax of Darunavir was found to be 265.0nm, hence selected as detection wavelength for further experimentation.
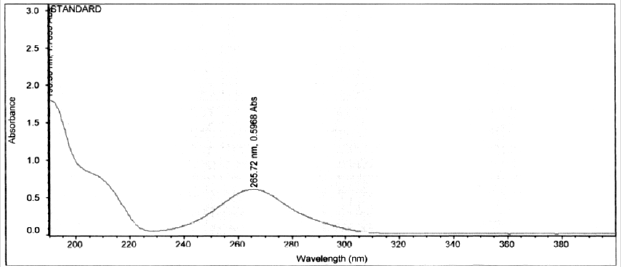
Figure 2: UV spectrum of Darunavir Standard Solution.
Preliminary Selection of Chromatographic Condition:
In order to optimize chromatographic conditions to separate elute and quantify Darunavir one or two parameters (Column and flow rate ) were modified at each trials. Standard solution was prepared in different mobile phases varying in composition and various trials are taken for the selections of chromatographic conditions such as mobile phase, column, flow rate, wavelength, temperature and pH are shown in Table 2. The chromatogram recorded for trail no 3 is shown in Figure 3.
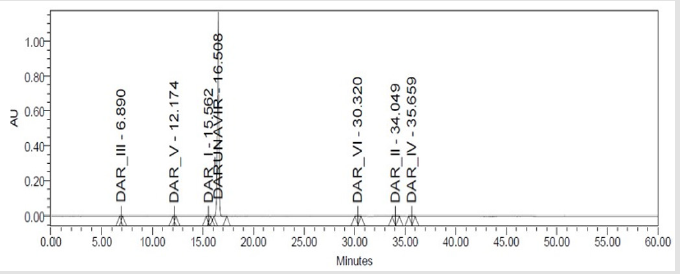
Figure 3: Chromatgram recorded for Darunavir impurity spiked Solution.
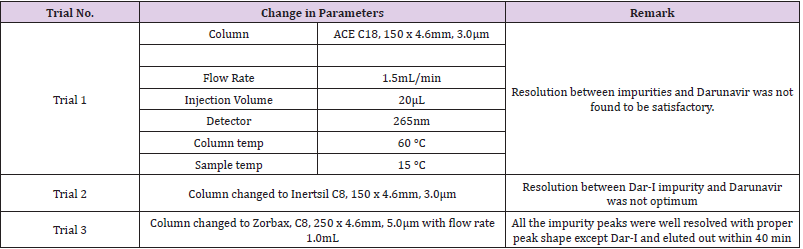
Table 2: Trials and Chromatographic observation.
Conclusion
From the above chromatographic condition the finalized RP-HPLC parameters are shown in Table 3.
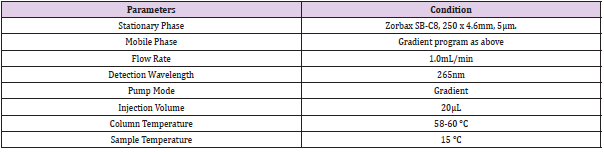
Table 3: Final Optimized chromatographic condition.
Study of System Suitability Parameters:
The study of chromatogram Figure 3 revels that the API and all the impurities were well resolved except DAR-I Impurity which elutes very close to Darunavir API peak, hence resolution of the same was studied. System suitability parameters were measured to verify the system performance. For this sample solution prepared which contains DAR-I Impurity was 2.4μg/mL and Darunavir 160μg/mL of concentration and five replicate injections of 20μL injected.The chromatogram recorded is shown in Figure 4 and Obsrevations are recorded in Table 4.

Figure 4: Chromatogram of Darunavir System suitability Solution.
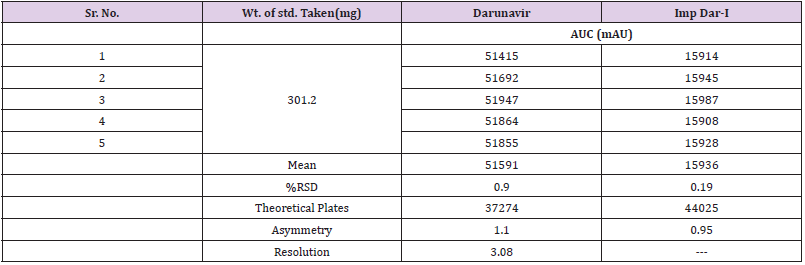
Table 4: Results of System Suitability Parameters.
Study of Linearity (Calibration Curve)
Preparation of Linearity Stock Solution: The dilutions were prepared for Linearity Level (%) from 50% to 150% in such a way that we get final solutions having concentration in the range of 1 to 4μg/mL and observations recorded & graph plotted as concentartion of drug Vs peak area are shown in Figures 5a&5b for drug and impurity 1. The correlation coefficient for Darunavir and DAR-I Impurity was found to be 0.998 and 0.999 respectively.

Figure 5: Plot of Calibration curve of
a) Darunavir
b) Impurity 1.
Application of Proposed Method to Formulation
The optimized gradient program and chromatographic parameters were applied to check the presence of unknown peaks in diluents and standard solution of Darunavir. For this, 20μL injection of diluent (blank) and standard solution prepared earlier were injected in system. The chromatogram was shown in Figures 6(a)&(b). The observations from Figures 6a&6b are recorded in Table 5. From the figure and observation it was concluded that no additional peaks were seen in the chromatogram of diluents and standard solution. Hence the proposed method was further applied to formulations.

Table 5: Peak name, Retention time, Area and Asymmetry.
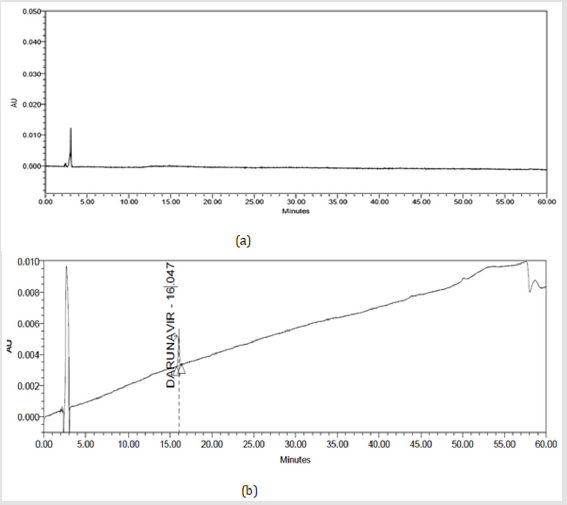
Figure 6:
(a) Chromatograms of Diluent (blank) solution
(b) Chromatograms of Darunavir Standard solution.
Validation
Specificity: (Identification, Interference & Peak Purity)
A 20μL volume of Blank (Diluent), Darunavir Standard solution, impurity mixture solution and sample solution spiked with known impurities at specification limit were injected into the HPLC system. There was no interference from the blank at the retention time of Darunavir and impurity peaks. The chromatogram of impurity spiked sample revels that the impurities were well separated and also the peak purity data revels that there was no co-eluting peaks and no interference of impurities at the retention time of analyte peak. The observed chromatograms are shown in Figures 7a-7k. The observations of spiked sample for specificity are shown in the Table 6.
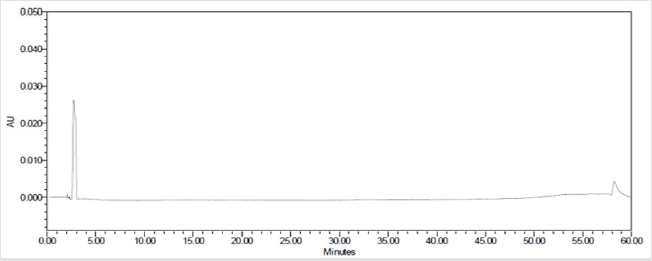
Figure 7(a): Chromatogram of Blank (Diluent) solution.
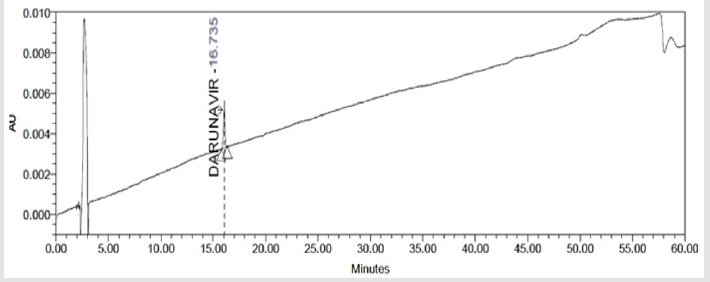
Figure 7(b): Chromatograms of Darunavir Standard Solution.
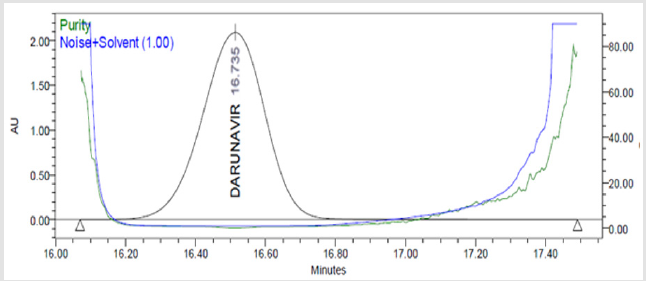
Figure 7(c): Peak Purity Plot of Darunavir Standard Solution.
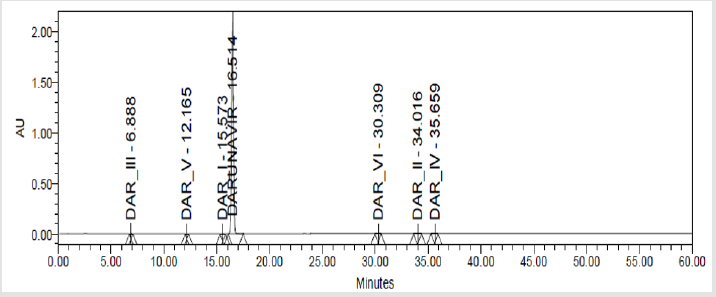
Figure 7(d): Chromatograms of Darunavir Spiked Soluution.
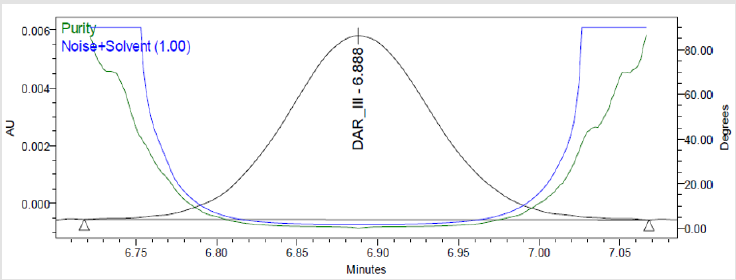
Figure 7(e): Peak Purity Plot of Impurity Dar-III Solution.
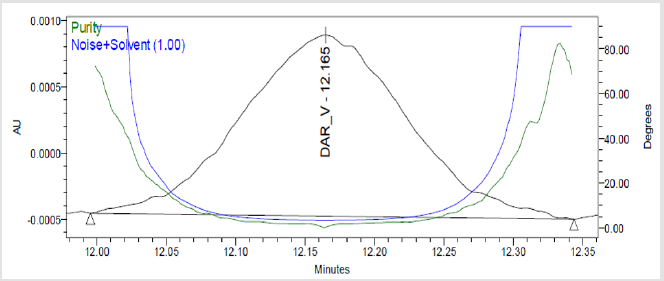
Figure 7(f): Peak Purity Plot of Impurity Dar-V Solution.
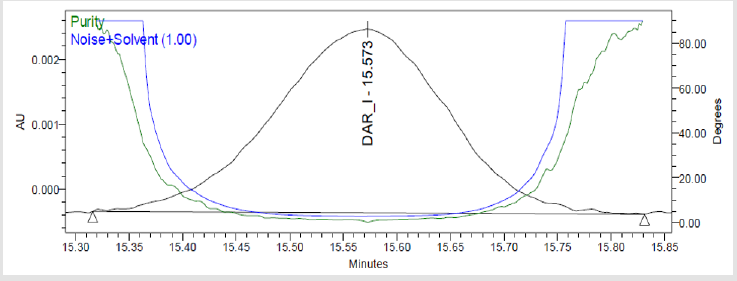
Figure 7(g): Peak Purity Plot of Impurity Dar-I Solution.
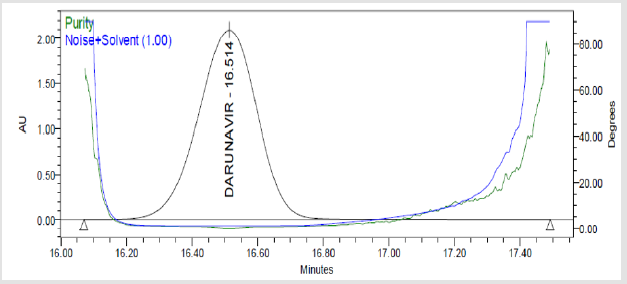
Figure 7(h): Peak Purity Plot of Darunavir Solution.
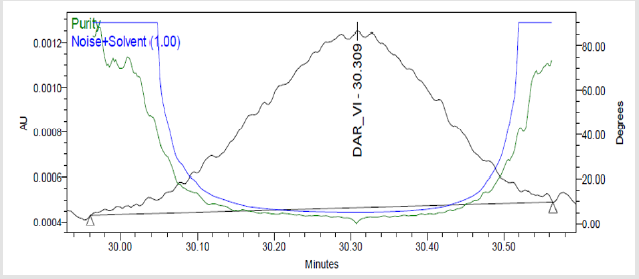
Figure 7(i): Peak Purity Plot of Impurity Dar-VI Solution.
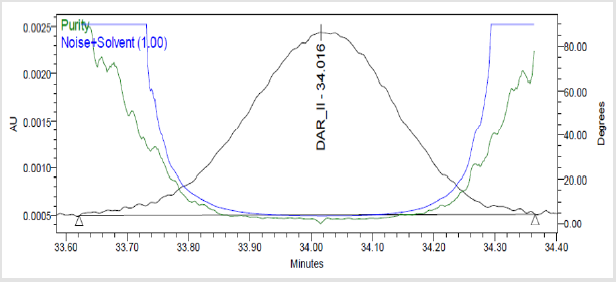
Figure 7(j): Peak Purity Plot of Impurity Dar-II Solution.
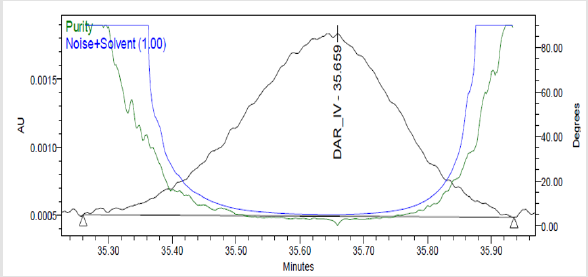
Figure 7(k): Peak Purity Plot of Impurity Dar-IV Solution.
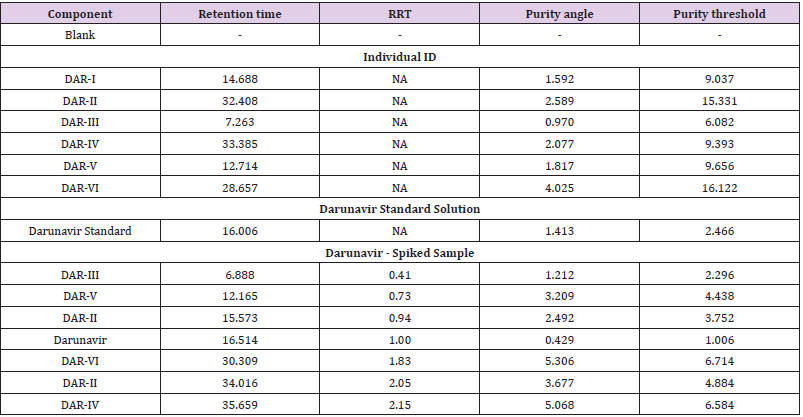
Table 6: Observation of Specificity.(Identification, Interference and Peak purity).
Accuracy
Accuracy (Recovery) for DAR-I Impurity: Accuracy was
performed by injecting three replicates each of sample spiked at
four levels LOQ, 50%, 100% and 150% of the corresponding limit
concentration of known impurities like DAR-I Impurity. The limit
concentration for DAR-I Impurity (0.20%) each level prepared in
triplicates. Prepared 12 sample spiked with known impurities like
DAR-I Impurity at 4 different levels, each level in triplicate from 3x
LOQ, 3x 50% , 3x 100% and 3x 150% of the limit concentration.
DAR-I Impurity stock solution was prepared of a concentration
60.7μg/mL as a stock solution.
NOTE: Impurity is spiked in 2nd dilution of sample solution.
Procedure
Weighed 20 tablets and average weight of tablet calculated, crushed into fine powder and mixed well. Weighed and transferred powder equivalent to 800mg into 100mL volumetric flask, 70mL of diluent was added, sonicated for 30 minutes with intermittent shaking and allowed it to cool, volume made up to the mark with diluent and mixed. Further 15mL of this solution was diluted to 100mL volumetric flask, added DAR-I impurity stock solution mentioned in above table and volume made up to the mark with diluent and mixed. Filter the sample solution through 0.45μ nylon membrane filter.
Precision
The precision of an analytical procedure is usually expressed as the variance, standard deviation, relative standard deviation or coefficient of series of measurements (Table 7).
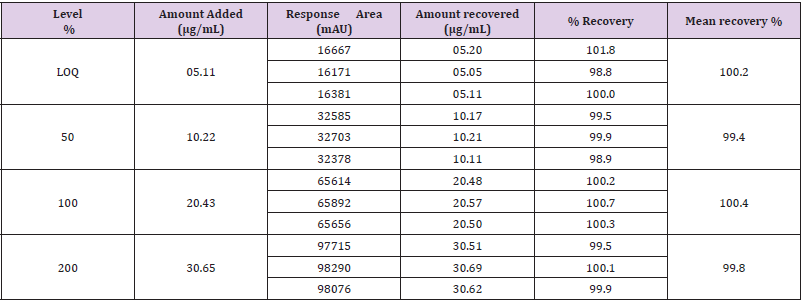
Table 7: Accuracy for DAR-I impurity.
System Precision for Related Substance: System precision was performed by single injection of Blank (Diluent) and six replicate injections of DAR standard solution were injected on the system. The results obtained from the observation of chromatogram was shown in Table 8.
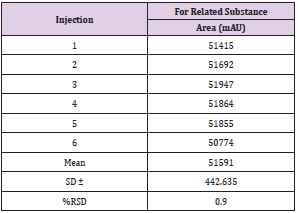
Table 8: Accuracy for DAR-I impurity.
Method Precision
Method Precision was performed by injecting six samples solution prepared by spiking DAR-I impurity (0.20%) & Darunavir for unknown impurities at limit concentration (0.20%) to the Darunavir tablets were prepared and injected on the HPLC. The observations are shown in Table 9.

Table 9: Method precision for Known Impurities & % Unknown impurities.
Intermediate Precision (Ruggedness) For Related Substance: The observation and results is shown in Table 10.
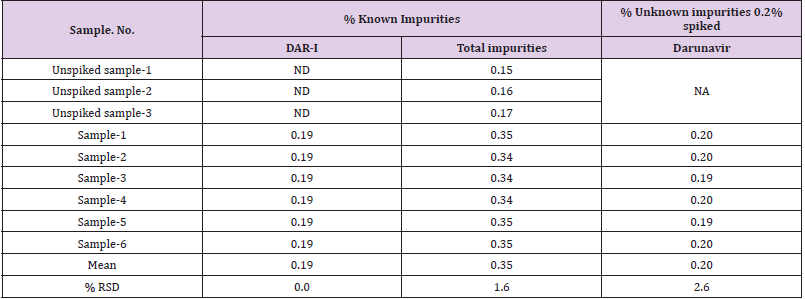
Table 10: Intermediate precision for known and unknown impurities.
Linearity & Range
It was performed in the range of LOQ to 150% of the Darunavir Sample. The working conc. level of Darunavir is about 30μg/mL. The range is proposed to be from LOQ to 150 % of 30μg/mL. Sample preparations are prepared as per earlier procedure in Development of HPLC Method for Estimation of Darunavir Related Substance in Formulation for study of linearity (calibration Curve). Then each solution was injected and chromatographed. The observation of linearity of drug is recorded in Table 11 and graph was plotted as Concentration (μg/mL) w.r.t limit concentration v/s area shown in Figure 8a-8b. The correlation coeficient for Darunavir and Dar-I impurity was found to be 0.998 and 0.999 respectively.
Limit of Detection and Limit of Quantitation
Based on determination of prediction linearity, six replicate injections were made for LOQ.Six replicates of above predicted LOD and LOQ solution were injected on system and calculated % RSD are summarized in Table 11.
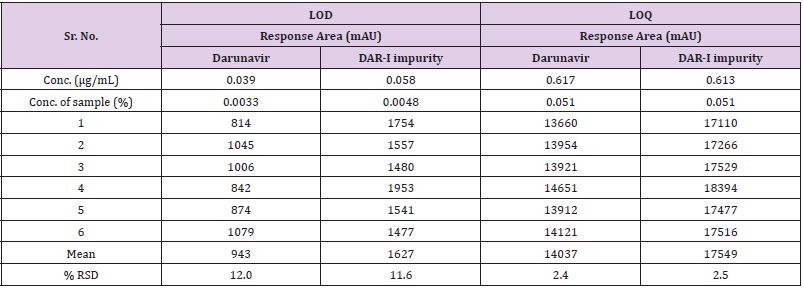
Table 11: Precision for LOD and LOQ for Darunavir & DAR-Iimpurity.
Forced Degradation
In forced degradation study a drug substance or the drug product is exposed to an environmental vigorous than the normal i.e.at high temperature, high humidity over the period of time, hydrolysis of drug with base or acid and photo stability of drug are called as accelerated stability conditions. Force degradation studies are performed to get an idea of how drug substance or product degrades, degenerate and behaves under changing condition, which helps in developing the stability indicating method of analysis. The ICH Guideline Q1A suggests the following condition to the employed.
Solution State Analysis:
a. Acid Degradation
b. Base Degradation
c. Peroxide Degradation
Solid State Analysis
a. Photolytic Degradation (UV Light)
b. Humidity Studies
c. Thermal Degradation
Solution State Stability
For Related substance: For the solution stability study for
the related substances, sample prepared to get final concentration
of 1200μg/mL Concentration solution of Darunavir. The amount
of standard drug undegraded was calculated using the following
formula:
The amount of standard drug undergarded was calculated
using the formula
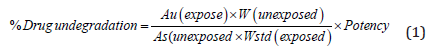
Where,
Au = Peak area of standard (exposed), As = Peak area of
standard (unexposed), Wstd = Weight of Standard
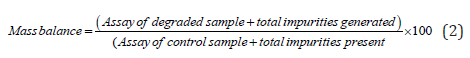
Calculation formula for Mass balance:
Acid Hydrolysis
It was performed by adding 15mL of 1N HCL & kept on bench top at room temperature for 20 Min. and neutralized 1N alkali. After neutralization, the standard solutions were prepared following general procedure as described earlier. The Sample solution of assay and sample solution for related substance solutions were injected after 20min and chromatographed separately using optimize chromatographic conditions.
Base degradation: It was performed by adding 15mL of 1 N NaOH & kept on bench top at room temperature for 14 h and neutralized 1N alkali. After neutralization, the sample solution was prepared following general procedure as described earlier. The Sample solution of assay and sample solution for related substance solution were injected after after 14h in 1 N NaOH and chromatographed separately using optimize chromatographic conditions.
Peroxide degradation: It was performed by adding 15mL of 30 % hydrogen peroxide solution & heated at 70 °C in water bath for 5 h, allowed to cool and volume made up to the mark with diluent and mixed. The Sample solution of assay and sample solution for related substance solution were prepared following general procedure as described earlier. The sample solution was injected and chromatographed separately using optimize chromatographic conditions. From the chromatographic observations of Acid degradation, Alkali degradation and peroxide degradation chromatograms, AUC were noted, % undegraded drug (Assay) and mass balance was calculated using the formula 1 and 2 is shown in Table 12.
Solid State Analysis
Photolytic degradation (UV Light): According to ICH
Guideline sample should be exposed to light to providing an overall
illumination of not less than 200 watt hrs. /square meter. The
stability chamber was calibrated using appropriate UV meter for
UV Light study and the study was carried out for 7 days.
Exposure period of UV light was calculated by the following
formula:
200×1000000 / Intensity /10000 hrs
Darunavir sample solution was prepared by general procedure as described earlier and it was performed by exposing the sample solutions under UV and white light for 1.2 million lux hours and an integrated near ultraviolet energy of not less than 2000 watt/ square and volume made up to the mark with diluents and mixed. The sample solution was prepared following general procedure. After photolytic degradation sample solution for assay and for related substance solution were injected and chromatographed separately using optimize chromatographic conditions.
Thermal degradation
It was performed by heating the solution in the oven at 50 °C for 24 h, allowed to cool and volume made up to the mark with diluent and mixed. The sample solution was prepared following general procedure. The sample solution for assay and for related substances were injected and chromatographed separately using optimize chromatographic conditions. From the chromatographic observations of Photolytic degradation (UV Light) and thermal degradation chromatograms, AUC were noted, % undegraded drug (Assay) and mass balance was calculated using the formula 1 and 2 is shown in Table 12. Purity Threshold was found to be greater than purity angle.
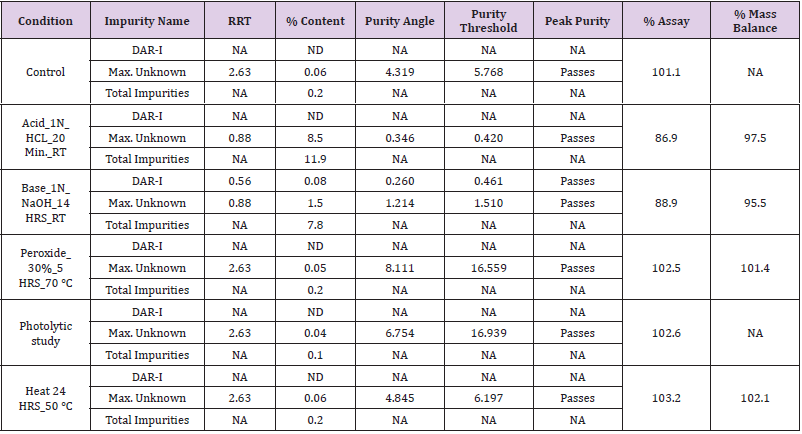
Table 12: Observation of Forced degradation.
Note: ND = Not Detected, NA= Not Applicable
Stability in Analytical solution
The standard and sample solution was prepared as per described in general procedure for preparation of solutions and kept sample for 24 h at sample temperature condition (15 °C) & room temperature (25 °C) after 24 hrs sample was injected time to time continuously to check the solution stability. The results obtained are shown in Table 13.
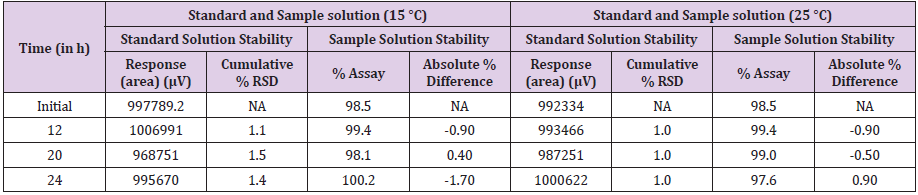
Table 13: Stability in analytical Standard and Sample solution (15 °C) and (25 °C).
Filter Compatibility
The Standard and Sample solution was prepared as per
described in general procedure for preparation of solutions and
filtered through different types of filters (PVDF, Nylon, PTFE &
Teflon + Glass) and injected on to the HPLC. The centrifuged sample
and filtrates of different filters were analyzed for their equivalency.
The observations are shown in Table 14.
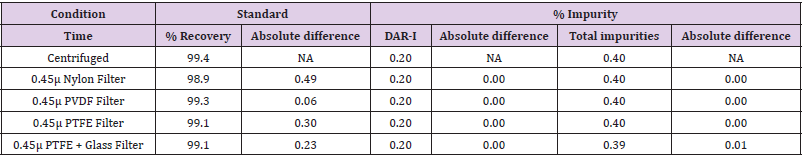
Table 14: Study of Filter compatibility.
Robustness
The robustness of an analytical procedure is measured by making small but deliberate variations in method parameters and observing the effect of these variations on the system suitability parameters by injecting standard and sample solution.
a. Change in chromatographic conditions:
b. Change in wavelength (± 5nm)
c. Change in flow rate (± 0.1ml/min)
d. Change in column temperature (± 5 °C)
e. Change in buffer pH (+0.2unit).
The observations are shown in Table 15a & 15b.
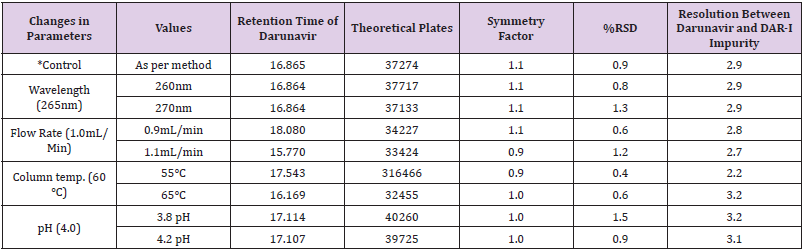
Table 15(a): Robustness for Darunavir Standard solution.

Table 15(b):Robustness for Darunavir Spiked Sample.
Conclusion
From all above studies, we can concluded that the proposed HPLC method can be used successfully for estimation of Assay and Related Substance in Darunavir. It can also be useful in detecting the degradation of unknown impurities in tablet formulation. Further this method may be applied to preparative HPLC for qualification of unknown impurities which might be generated during forced degradation studies. The results obtained by HPLC method for determination of Darunavir are reliable, accurate and precise. The method can be employed for routine quality control analysis of Darunavir in tablet dosage form.
References
- Bhargavi D, Rao BB, Kiran G, Gouthami T, Bakshi V (2017) Method Development and Validation for Related Impurities of Efavirenz by RP-HPLC Method. Analytical Chemistry Letters 7(5): 737-47.
- Singh S, Bakshi M (2000) Guidance on the Conduct of Stress Tests to Determine Inherent Stability of Drugs. Pharmaceutical Technology Asia. p. 24-24.
- Sonawane S, Gide P (2016) Application of Experimental Design for the Optimization of Forced Degradation and Development of a Validated Stability-Indicating LC Method for Luliconazole in Bulk and Cream Formulation. Arabian Journal of Chemistry 9: S1428-S1434.
- Kurmi M, Kumar S, Singh B, Singh S (2014) Implementation of Design of Experiments for optimization of Forced Degradation Conditions and Development of a Stability-Indicating Method for Furosemide. Journal of Pharmaceutical and Biomedical Analysis 96: 135-143.
- Carr GP, Wahlich JC (1990) A Practical Approach to Method Validation in harmaceutical Journal of Pharmaceutical and Biomedical Analysis 8(8-12): 613-618.
- (2003) Guidance for Industry: Q1A (R2). Stability Testing of New Drug Substances and Products CDER, CBER, USFDA.01-22.
- (2003) Guidance for Industry ANDAs. Stability Testing of Drug Substances and Products. CDER, USFDA. 01- 05.
- (2003) FDA, Guidance for Industry Q1A(R2). Stability testing of new drug substances and products.
- wikipedia.org.
- http://www.drugs.com/cdi/darunavir.html.
- https://www.ema.europa.eu/en/documents/assessment-report/darunavir-krka-dd-epar-public-assessment-report_en.pdf
- Corrêa JCR, D’Arcy DM, Serra CHDR, Salgado HRN (2014) A Critical Review of Properties of Darunavir and Analytical Methods for its Determination. Critical Reviews in Analytical Chemistry 44(1): 16-22.
- Reddy BR, Jyothi G, Reddy BS, Raman NVVSS, Reddy KSC, Rambabu C (2013) Stability-Indicating HPLC Method for the Determination of Darunavir Ethanolate. Journal of Chromatographic Science 51(5): 471-476.
- Chandrethiya GD, Shelat PK, Zaveri MN (2013) RP-HPLC Method Development and Validation for Estimation of Colchicine in Gelatin Nanoparticles Formulation. Int J Pharm Pharm Sci 5(1): 228-231.
- Mane MB, Gaikwad PJ, Patil AV, Mogale AS (2013) RP-HPLC Method for Determination of Darunavir in Bulk Pharmaceutical Preparation. Int J Pharm Sci Res 21(2): 20-23.
- Babu, GR, Rao AL, Rao JV (2013) Development and Validation of Novel HPLC Method for Estimaton of Darunavir in pharmaceutical formulations. Int J Res Pharm Chem 3(2): 438-43.
- Kogawa AC, Salgado HRN (2013) Development and Validation of Infrared Spectroscopy Method for the Determination of Darunavir in Tablets. Physical Chemistry 3(1): 1-6.
- Rao RN, Ramachandra B, Sravan B, Khalid S (2014) LC–MS/MS Structural Characterization of Stress Degradation Products Including the Development of a Stability Indicating Assay of Darunavir: An anti-HIV drug. Journal of Pharmaceutical and Biomedical Analysis 89: 28-33.
- Ghante M, Shelar R, Sawant S, Kadam M (2014) Development and validation of UV Spectrophotometric method for estimation of darunavirethanolate in bulk and tablet dosage form. Int J Pharm and Pharm Sci (7): 240-242.
