 Research Article
Abstract
Objective: For decades has been discussed on cardio-protective factors associated with drinking water, Si, Mg, etc. This study is assessing Finnish regional cropland Mg/Ca values (by total, “tot” and 6 separate soil types) from periods 1966-70 (“68”) and 1986-90 (“88”), soil-type proportions (Prp) of mineral soils (min), e.g. moraines (mor) and sands, groundwater (gw) Si and (Mg/Ca), male (M) CHD mortality, ratios of human CHD and other cardiac mortality to total mortality [(CHD/Tot) and (Card.o/Tot)] in 19 regions. Preferring Si.gw median (Si.gw.md) to Si.gw.mean is explained.
Results: Finland could be divided into 4 different areas: Åland (carbonate soils), SW, SE and North (5 regions with long-term dolomite application). In both periods (Mg/Ca), with exception of sandy clay, was highest in the North, lowest in Åland and associated inversely with coarseness of soil-type. After exclusion of North: [(Mg/Ca).soil.68] was explained 87.2 % by [(Mg/Ca).gw] (in whole country only by 27.7 %, p = 0.021), by Si.gw.md 71.7 % (p < 0.001). In continental Finland (on non-carbonate soils): Si.gw.md was explained inversely: 48.4 % (p=0.007) by Prp. {[mor/(mor+sands)]; [(mor+sands)/min)]}.88, 5 % (p = 0.001) by [M.CHD.(74-83)], 54.6 % (p < 0.001), by [(CHD/Tot).(87-04)]; positively 39.2 % (p = 0.005) by [(Mg_Ca).gw]. In whole country [(Card.o/Tot). (1987-2004)] was explained inversely by [(CHD/Tot).(87-04)], better by more coincidental [(Mg/Ca).tot.88], (45.2 %, p = 0.002) than by [(Mg/Ca).tot.68] (40.9 %).
Conclusion: CHD and [(CHD/Tot)] mortality associated stronger with parameters of soil weathering ability, indicated by soil-type distribution, groundwater Si and (Mg/Ca). (Card.o/Tot) associated stronger with cropland (Mg/Ca) and was affected by long-term dolomite application.
Keywords: CHD; Other cardiac mortality; Cropland Mg/Ca; Groundwater Mg/Ca; Groundwater Si; Soil-type proportions
Abbreviations: AMI: acute myocardial infarction; CHD: coronary heart disease/ischaemic heart disease; coms: coarse mineral soils (i.e. Moraines + Sands); Dystri-lithic leptosol: limestone soil-type in Åland; gw: groundwater; min : mineral; Prp: proportion; R.by: Regression by; SE: southeast; SW: southwest; tot: Total
Introduction
According to WHO report: “Many ecological studies report an inverse (i.e. protective) association between cardiovascular disease mortality and water hardness, calcium or magnesium levels; however, results are not consistent” [1]. In Finland clinical symptoms of CHD (coronary heart disease or ischaemic heart disease) have been observed to have been associated with groundwater (gw) silicon (Si) [2]: “clear-cut symptoms or ECG signs of CHD”, and Mg/ Ca ratio [3]: “first AMI by men aged 35-74 years”. Cropland Mg/Ca has been discovered not to be associated with CHD mortality of middle-aged men [4] in 1964-84, but it has been reported to have been associated inversely with ratio of cardiac non-CHD mortality to total mortality (Card o./Tot) in whole population [and nonsignificantly (positively!) with [(CHD/Tot] (the numbers were not given)] 1969-2016 [5]. A change in the WHO’s coding rules has reduced pneumonia as an underlying cause since 2005 [6], why this association needs a new assessment by excluding data from 2005- 16. Time-related data on national Mg supplementation of cropland and its rapid change exists from 1972-80 [7], from other periods the data are less precise, even data on 1972 is slightly disputable [8].
About regional quality of liming agents there has not been available quantitative data, anyhow qualitative report from 1956: Distribution of Mg-rich mines and quarries has been different in different areas of Finland. In the 1950’s the production of liming agents with Mg contents 10.3-13.5 % situated in the northern Finland, northward from Joensuu-Kuopio-Kokkola line [9], dotted line in Figure 1. Physiological mechanisms of Mg and Si are mainly overseen in this article. The aim of this study is to represent some regional cropland and gw factors [Si, Mg/Ca, proportion of some soil-types] and their associations with each other and with cardiac mortality (assessed by four parameters), as well as the change of cropland (Mg/Ca) in 6 separate soil-types between periods 1966- 70 (“68”) and 1986-90 (“88”) and the association of long-term dolomite liming on cardiac mortality parameters.
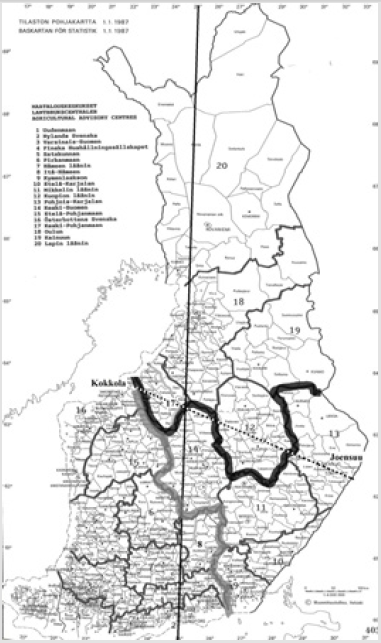
Figure 1: Map of Finland, from [10], with boundaries of Agricultural Advisory Centers (nowadays Rural Centers, RC’s). Dotted line, according to [9], divides Finland roughly to rich (North) and poor dolomite liming (South) zones (before 1976) [7,8]. The dick black line is drawn according to the soil analyses. The grey line shows the usual Finnish East-West division [11]. The straight vertical line shows the meridian of 25 °E.
Materials and Methods
Figure 1 from [10] represents the 20 administrative units, Rural Centers (RC)-earlier “Agricultural Advisory Centers”. More closely [RC.(04ab) Finska Hushållnings..] is divided into “continental” [(04a).Finska Hushållningssällskapet] and [(04b).Åland] [11]. These 21 RC’s are the source of cropland parameters: Soluble Ca and Mg contents of Fine sand moraine, Finer fine sand, Silt, Sandy clay, Mull, Carex peat and Total, as well as proportions of mineral soil-types. (Table 1) These are provided by Eurofins Viljavuuspalvelu Oy: from 1966-70 (abbr.: “68”) [12] (Table 2) and from 1986-88 (abbr.: “88) [13] (Table 3). Groundwater (gw) Si, (Mg/Ca) values are provided by Geologic Survey of Finland [14] (Table 4). Soil analyses were determined by using acetic acid ammonium acetate buffer (0.5 M, pH 4.65) [15]. Additional administrative units are 19 “Regions” [16], which are more important than RC’s, because a plenty of data are readily accessible by Regions. Regions are rather well overlapping with RC’s. There are a few bigger differences: MK01 Uusimaa is formed in 2011 [16] and is moderately well overlapping with combination of [(01).Uudenmaan] and [(02). Nylands Svenska], as a remark of its data source even labeled by “[(01;02) Uusimaa]”. MK02 Varsinais-Suomi is constituted from RC’s [(03).Varsinais- Suomen] and [(04a) “continental” Finska Hushållningssällskapet]. It is labeled here by “[(03;04a). Southwest Finland]”, too. Cropland area of [(04a) “continental” Finska Hushållningssällskapet] is attained by subtracting area of Åland (in provincial database) from [(04ab) Finska Hushållningssällskapet]. The following Regions after MK02 are MK04 Satakunta, MK05 Kanta-Häme and MK06 Pirkanmaa. In RC databases [(05).Satakunnan] is followed by [(06).
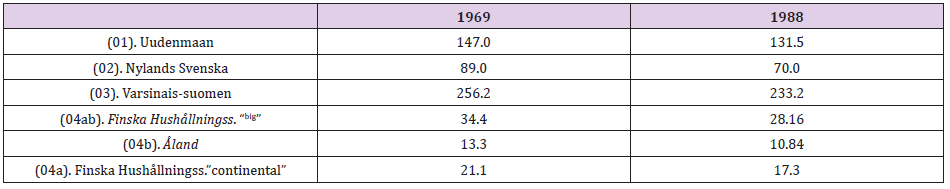
Table 1: Arable land 1969 and cultivated land of the following RC’s in 1988 (1,000 ha).
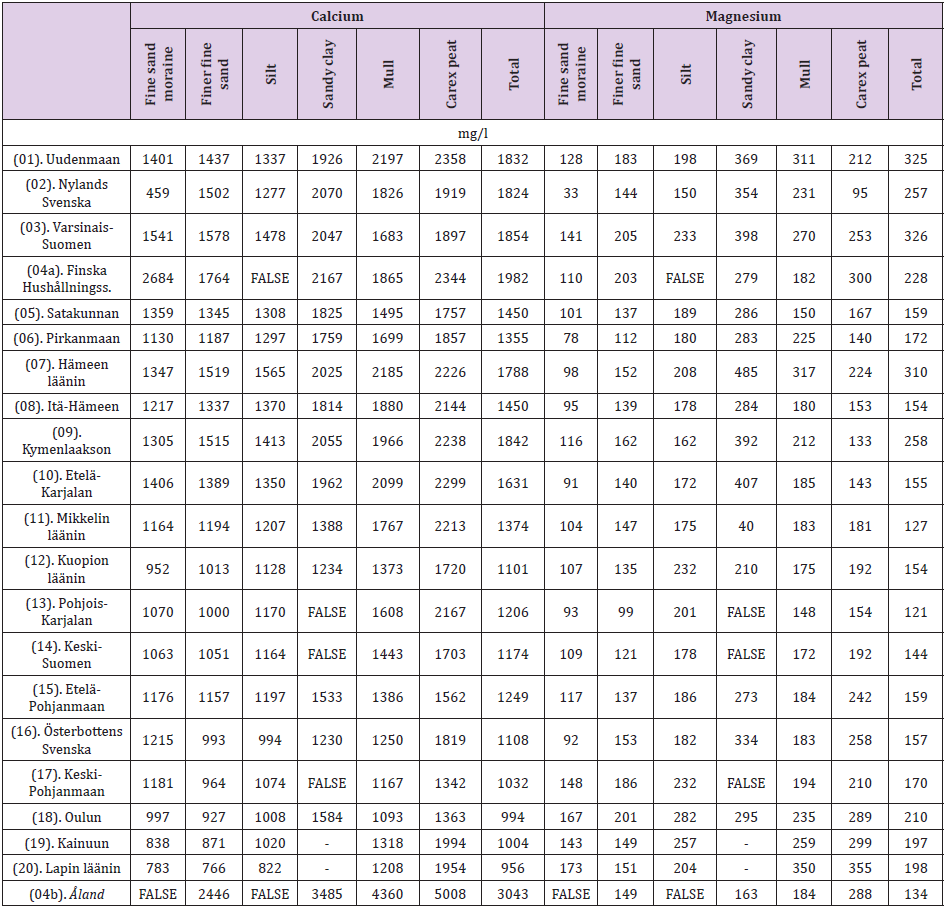
Table 2: Soluble calcium and magnesium contents in different soil-types (and total) of Finnish Rural Centers in 1966-70. After removing unpaired Ca and Mg cells, they and originally empty cells have got value “FALSE” (closer in the text).
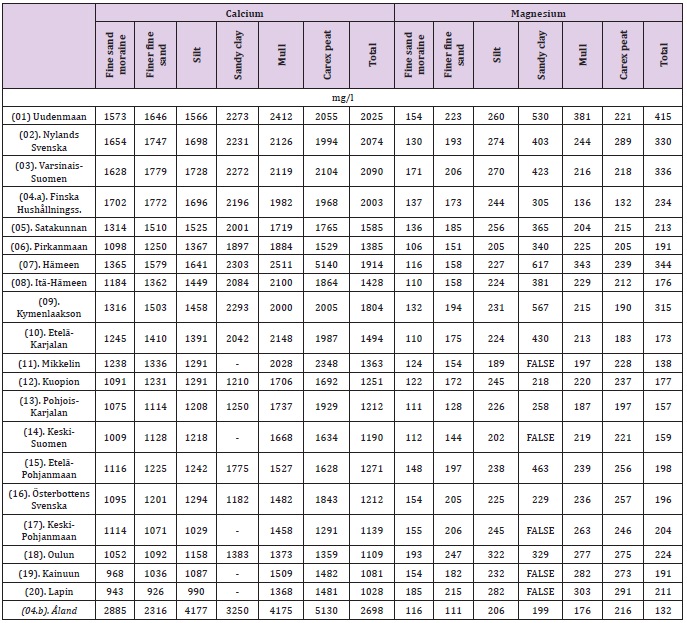
Table 3: Soluble calcium and magnesium contents of different soil-types (and total) in Finnish Rural Centers in 1986-90.
Note: ”-” means that both values are missing.
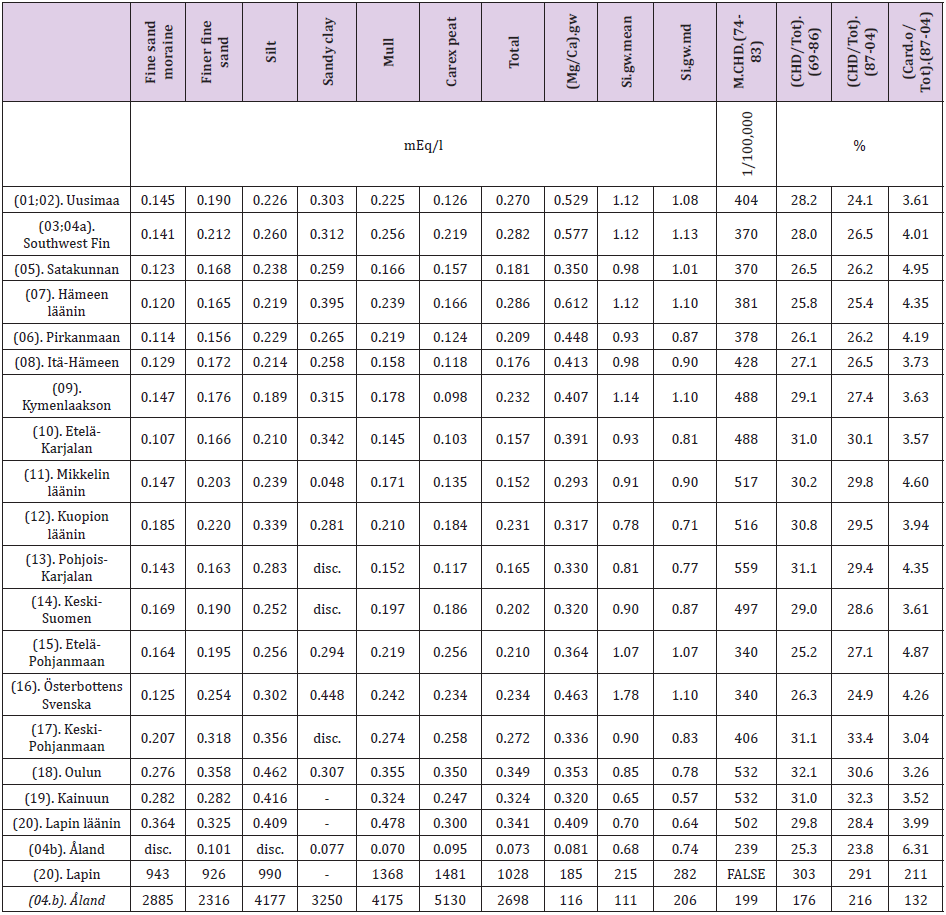
Table 4: Mg/Ca soil values from 1966-70, groundwater Si (mean and median) and Mg/Ca ratio and approximate age-adjusted male CHD from 1974-83 of Finnish Regions after combination data of the first RC’s and directly calculated proportions of CHD and other Cardiac causes of death pertotal mortality (Tot) in given periods (“disc.” = unpaired samples, “-“ = both values missing).
Pirkanmaan] and next by [(07). Hämeen läänin], which is moderately overlapping with MK05 Kanta-Häme. (It is important to harmonize their order before computing!) The part of RC.04, [(04b).Åland] has its own Region: MK21. Because it was supposed that instead of the water factors cropland factors could be of importance, data for MK01 and MK02 are constituted by weighting parameter values of [RC’s (01), (02), (03) and (04a)] by their areas of arable/cultivated land in 1969 [17,18] and 1988 [19,20]. Only cropland parameters from 1966-70 are weighted by the arable land area of 1969. Although this weighting system is disputable, it is not treated in Discussion. Data on provincial CHD mortality of men (M) aged 35-64 years for period 1974-83 (“74-83”) are from [21], processed in [4] and their adjustments for RC’s is represented in [22]. Approximate province figures for period 1974-83 are attained from Table 1 in [4] by weighting the values of the last three columns by 1, 2 and 2 (Table 4). Regional death-rates of whole population attained from [23], of which are calculated ratios (CHD/Tot): [27 Ischaemic heart diseases (I20-I25)/01-54 Total] for period 1969- 86 (“69-86”) and (Card.o/Tot): [28 Other heart diseases excl. rheumatic and alcohol-related (I30-I425, I427-I52)/01-54 Total] for periods 1969-86 (“69-86”) and for period 1987-2004 (“87-04”) are in (Table 4).
Table 2 shows the manufactured data from [12]. The soil data [12,13] includes 22 soil-types from 21 Rural Centers. For each selected soil-type there are 21 cells, together 147 cells for selected 7 columns (incl. Total). Number (N) of Calcium (and other basic, pH etc.) samples was originally 379, 922, Number of Mg samples (N.Mg) “only” 33,353. First each Ca and Mg pair was tested by soiltype, in every RC, whether both values were available, i.e. (N.Ca*N. Mg >0), else both values got value “FALSE”, which protects against statistical bias caused by “0”. After that N.Ca and N.Mg got the same “residual” N (“N.ba”) values (for calculating regional Total values). Two sample pairs of Silty clay (in the North) were missing (cells marked by “-“). Unpaired cells: 3 Silty clay samples (from SE and North Finland), two in Åland, and one in [(04a).Finska H…] were discarded; their cells got value “FALSE” (Table 2). The residual number of the selected (N.sel): Fine sand moraine was 45,525, Finer fine sand 62,117, Silt 40,493, Sandy clay 33,661, Mull 53,641, Carex peat 14,818 (together 250,255) and Total (N.tot) 379,152. Regional Ca.tot is by paired (ad 22 separate) N.ba’s calculated weighted mean of (ad 22 separate) Ca.soil-type values. (Especially here value “FALSE” is important.) Regional Mg.tot values are calculated respectively. Table 3 shows data from [13].
Mg was included in basic samples, no adjustments were needed, no samples were discarded. Empty cells (five) were only in Sandy clay, all from SE or North Finland. Number of samples from Fine sand moraine was 89,539, Finer fine sand 143,449, Silt 69,565, Sandy clay 60,962, Mull 83,048, Carex peat 7,415 and Total 621,134 (N.total selected 453,972). Finer fine sand, Mull, Carex peat and Total provided complete data for both periods. Table 4 shows Regional (Mg/Ca) soil and gw values, Si.gw means and medians (mEq/l), as well as age-adjusted male CHD. The first two lines are area-weighted means from 1969 (Table 1). (CHD/Tot) and (Card.o/ Tot) are directly attained as divided means [23]. Four area groups are formed: RC’s (as such or combined) (01-08; 15-16) compose SW, (09-11; 13-14) SE, (12; 17-20) North Finland, Åland alone forms the fourth area, with carbonate/limestone (“Dystri-lithic leptosol”) soil-type [24] and higher pH [12,13]. Table 5 shows Regional Mg/ Ca ratios of six soil-types and Total, as well as soil-type proportions of moraines per coarse mineral soils and coarse mineral soils per mineral soils total in 1986-90.
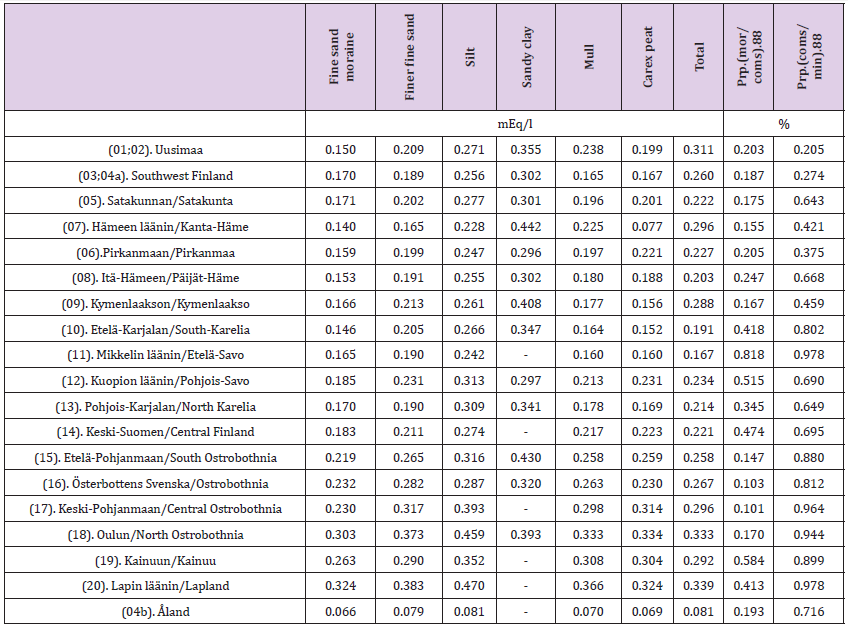
Table 5: Regional Mg/Ca ratios of six soil-types and Total, as well as soil-type proportions of moraines per coarse mineral soils and coarse mineral soils per mineral soils total in 1986-90. (“-“ = both values missing, no unpaired samples).
Results
Table 6 shows means of (Mg/Ca) of six soil-types, 1966-70 (Figure 2) and cardiac parameters from 4 areas of Finland and medians of the 19 Regions. Regional (Mg/Ca) medians increased in order: Fine sand moraine, finer fine sand, and Silt and Sandy clay. Soil (Mg/Ca) indicates soil-type coarseness. Table 7 shows (Mg/Ca) means and cardiac parameters from 3 areas as percents of their respective values in the North. (Mg/Ca) ratio was highest in the North, excluding Sandy clay. M.CHD. (74-83) was slightly lower in the North than in SE. (CHD/Tot) was highest in the North, (Card.o/Tot) remarkably lowest in the North. Table 8 shows (Mg/ Ca) means of 6 soil-types and Total from 4 areas of Finland in 1986- 90 (Figure 3) and medians of the 19 Regions. Regional (Mg/Ca) medians increased in order: Fine sand moraine, Finer fine sand, Silt and Sandy clay. Table 9 shows (Mg/Ca) means of six soil-types from 3 areas as percents of their respective values in the North. (Mg/Ca) ratio was highest in the North, excluding Sandy clay.
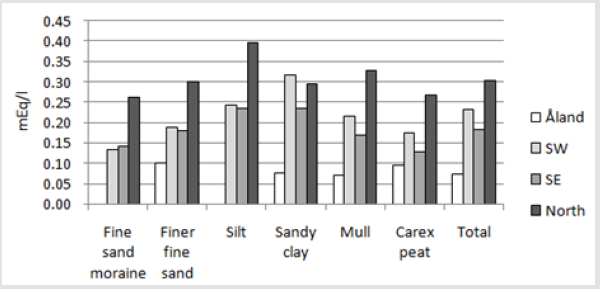
Figure 2: Cropland Mg/Ca ratio of six soil-types and Total in 1966-70.
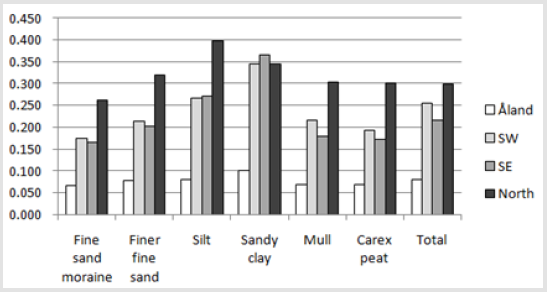
Figure 3: Cropland Mg/Ca ratio of six soil-types and Total in 1986-90.
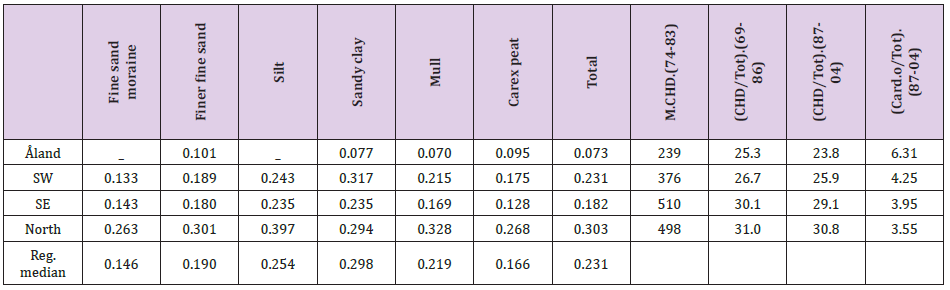
Table 6: Areal Mg/Ca means of six soil-types, 1966-70, approximate age-adjusted male CHD from 1974-83, as well as proportions of CHD and other Cardiac causes of death per total mortality in separate periods.
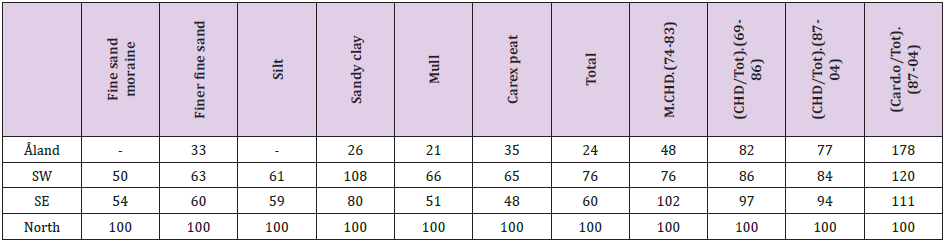
Table 7: Cropland Mg/Ca of six soil-types and Total in four areas of Finland, 1966-70, and cardiac parameters as percents of respective values of North Finland.
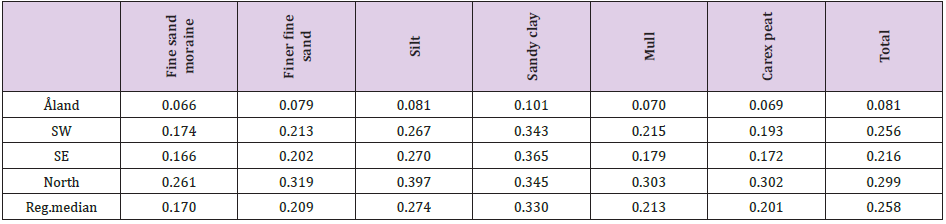
Table 8: Cropland Mg/Ca ratio of six soil-types and Total in Åland, SW, SE and North Finland in 1986-90.

Table 9: Cropland Mg/Ca ratio in six soil-types and Total of Åland, SW and SE Finland in 1986-90 as percents of respective values of North Finland.

Figure 4: Mg/Ca changes in different soil-types between periods 1966-70 and 1986-90 in SW, SE and northern Finland.
Figure 4 shows Regional (Mg/Ca) changes in different soiltypes between periods 1966-70 and 1986-90. Åland as a special case with missing or small number of samples is excluded. (Total increase in Åland was 11 %.) Remarkable is that Finer fine sand, Mull, Carex peat and Total provided complete data for both periods. Because Si.gw value in MK15 Ostrobothnia/Österbottens Svenska was exceptional (mean/median ratio 1.62, cf. on average 1.08), Si.gw regression was calculated by Si.gw.md: It was in whole country 62.8 % and after exclusion of Ostrobothnia (white column) 93.2% (Figure 5). After that preferred Si.gw median (Si.gw.md) for regressions and rejected Si.gw. Si.gw regression by Prp.(mor/ coms) gave similar result, why mean Si.gw was rejected from the following analyses. In other words Si.gw.md can be used as an indicator of Si.gw – it does not cause bias outside of Ostrobothnia. Figure 6 shows that exclusion of northern Regions (white columns) increased cropland [(Mg/Ca).tot.(66-70)] regression by [(Mg/Ca). gw] remarkable ad 87.2 %. In other words: no compliance between cropland and groundwater (Mg/Ca) in North, but good compliance in other parts of Finland, even in Åland.
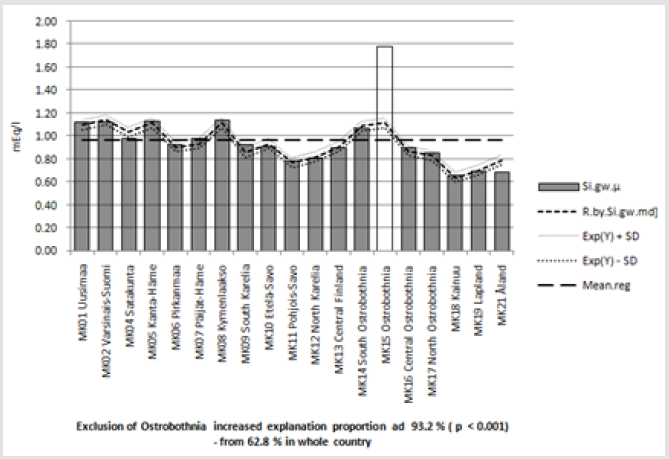
Figure 5: Regional Si.gw mean and its regression by Si.gw median.
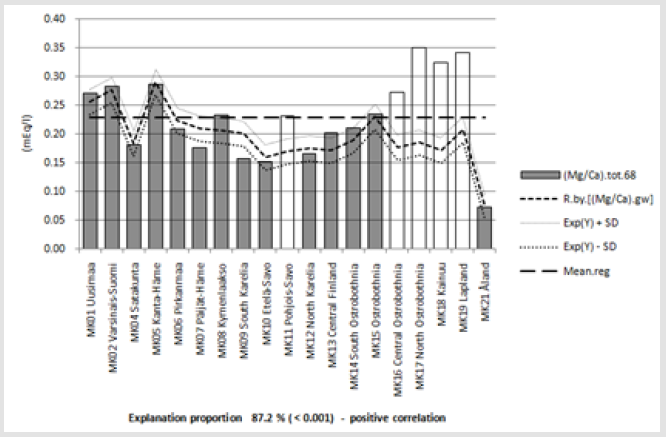
Figure 6: Cropland (Mg/Ca) in 1986-90 and its regression by groundwater (gw) (Mg/Ca). Nordic Regions - white colums - with longer dolomite history excluded from regression.
Figure 7 shows that exclusion of northern Regions (white columns) increased cropland (Mg/Ca).tot.(66-70) regression by [Si. gw.md] gw (ad 71.7 %, p < 0.001). In other words: no compliance between cropland (Mg/Ca) and groundwater Si in North, but good compliance in other parts of Finland, bu not in Åland. Figure 8 shows that soil-type proportions (Moraines/Coms) and (Coms/ Miner) explained [Si.gw.md] distribution in continental Finland 48.4% (p=0.007). (Coms = coarse mineral soils, i.e. Moraines + Sands). Figure 9 shows inverse association between [Si.gw.md] and age adjusted CHD mortality of male, aged 35-64 years. Explanation proportion was 53.5 % (p=0.001). Figure 10 shows represents [Si. gw.md] and its regression by CHD mortality proportion (in 1987- 2004) - with CHD mortality proportion in continental Finland. Explanation % was 54.6. Fig. 10 shows even that, if Åland included, association would be weaker. Figure 11 represents [Si.gw.md] and its association with [(Mg/Ca).gw] in continental Finland. Explanation proportion 39.2% (p=0.005). Åland was excluded because of obvious difference between Si.gw and plant available Si in carbonate soils.
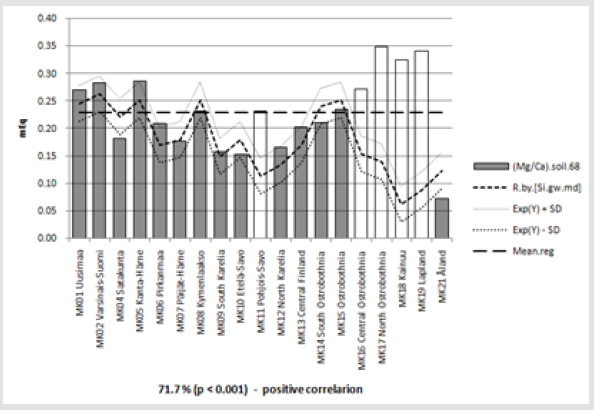
Figure 7: Cropland (Mg/Ca) in 1966-70 and its regression by ground water Si. Nordic Regions - white colums - with longer dolomite history excluded from regression.
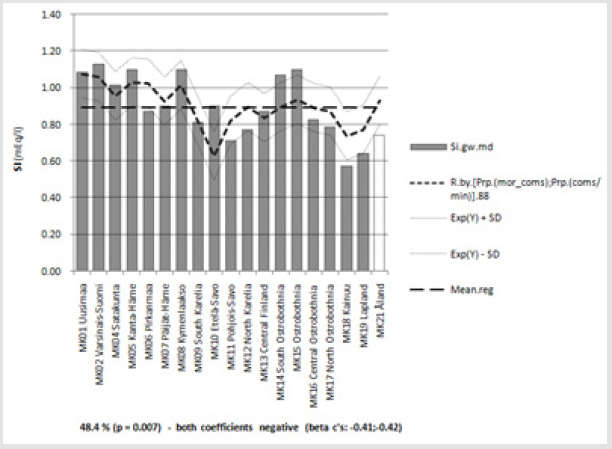
Figure 8: Groundwater Si content in continental Finland and its regression by relative mineral soil-type proportions [(moraine/ (coarse); (coarse/mineral total)] in 1986-90.
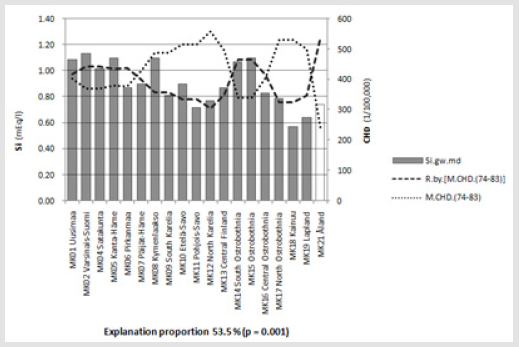
Figure 9: [Si.gw.md], its regression by [M.CHD.(74-83)] and [M.CHD.(74-83)].
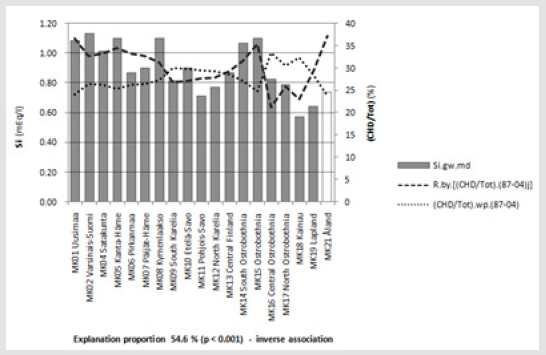
Figure 10: [Si.gw.md], its regression by [(CHD /Tot).(87-04)] and [(CHD /Tot).(87-04)] in continental Finland.
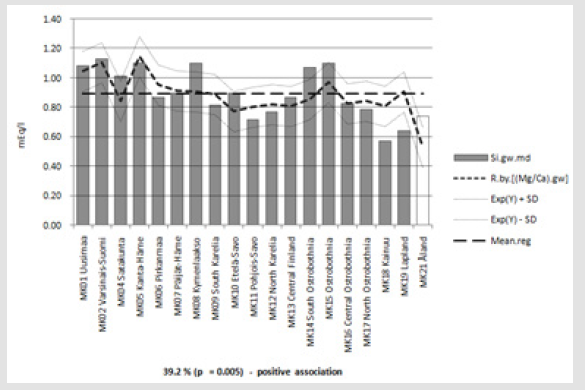
Figure 11: [Si.gw.md] and its association with [(Mg/Ca).gw] in continental Finland.
Figure 12 shows inverse association between proportions of “Other-than-CHD-Cardiac” and CHD of total mortality in whole population in 1987-2004. Figure 13 shows inverse association between [Card.o/Tot).(87-04)] and cropland (Mg/Ca) in 1986- 90, explanation proportion 45.2 % (p = 0.002). During this timeperiod (Card.o/Tot) was explained better than by less coincidental cropland [(Mg/Ca)] from 1966-70 (by 40.9 %, p = 0.003). Figure 14 represents age-adjusted CHD mortality of males, aged 35-64 yrs in 1974-83 and its regression by proportional CHD mortality in whole population- [(CHD/Tot).(69-86)] . Explanation proportion 72.5 % (p < 0.001). This is possibly explained by relative areal stability of both parameters. Figure 15 represents male CHD mortality in 1974-83 and its regression by ratios of soil-type proportions [(moraines/ (coarse minerals) and (coarse minerals/mineral soils total) in 1986-90, in continental Finland. Explanation proportion 47.8 % (p = 0.008)-positive association. Figure 16 represents male CHD mortality in 1974-83 and its regression by [(Mg/Ca).gw] in continental Finland. Explanation proportion 34.6% (p = 0.010). [After inclusion of Åland explanation proportion is 0.1 %]. Figure 17 represents male CHD mortality in 1974-83 and its regression by cropland (Mg/Ca) ratio from 1966-70 in continental Finland. Nonsignificant association. Figure 18 represents male CHD mortality in 1974-83 and its regression by [Si.gw.md] in continental Finland. Explanation proportion 53.5 % (p = 0.001). [In whole Finland explanation proportion is 22.6 % (p = 0.040)].
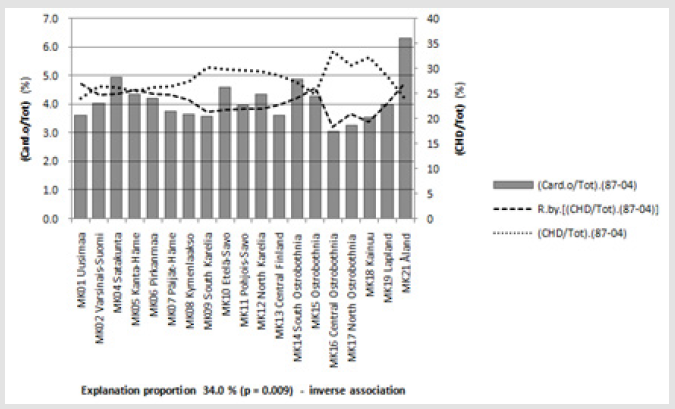
Figure 12: [Card.o/Tot).(87-04)], its regression by [(CHD/Tot).[87-04)] and [(CHD/Tot).[87-04)].
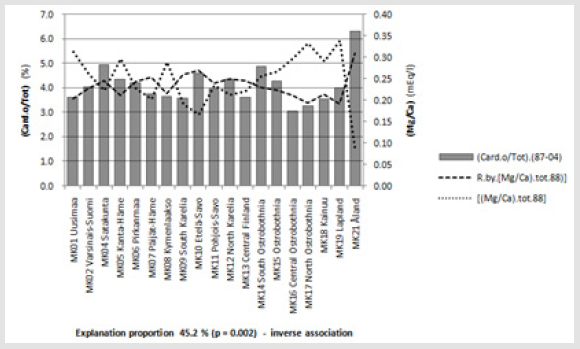
Figure 13: [Card.o/Tot).(87-04)], its regression by soil [(Mg/Ca).tot.88] and [(Mg/Ca).tot.88]. Inverse association between [Card.o/Tot).(87-04)] and cropland (Mg/Ca) in 1986-90, explanation proportion 45.2 % (p = 0.002). During this time-period (Card.o/Tot) was explained better than by less coincidental cropland [(Mg/Ca)] from 1966-70 (by 40.9 %, p = 0.003).
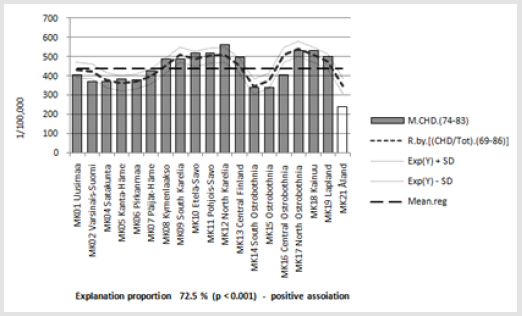
Figure 14: Age-adjusted CHD mortality of males, aged 35-64 yrs in 1974-83 and its regression by proportional CHD mortality in whole population - [(CHD/Tot).(69-86)] . Explanation proportion 72.5 % (p < 0.001). This is possibly explained by relative areal stability of both parameters.
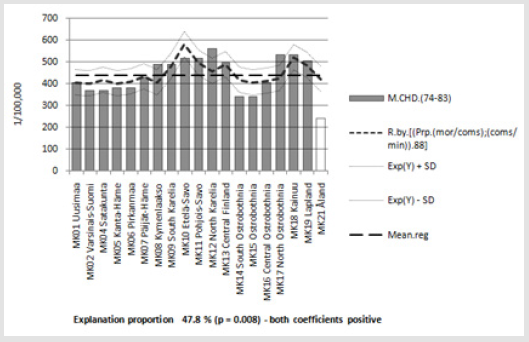
Figure 15: [M.CHD.(74-83)] and its regression by ratios of soil-type proportions [(moraine/(coarse mineral) and (coarse mineral/mineral soils total) in 1986-90, in continental Finland. Explanation proportion 47.8 % (p = 0.008) positive association.
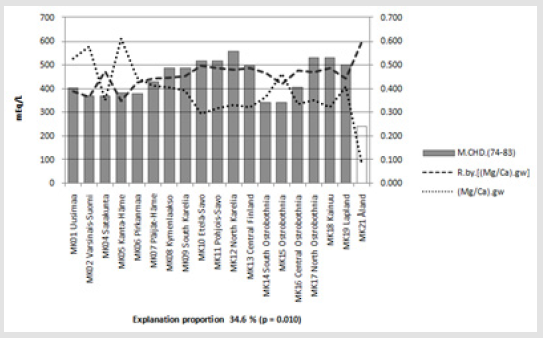
Figure 16: [M.CHD.(74-83)], its regression by [(Mg/Ca).gw] and [(Mg/Ca).gw] in continental Finland. Explanation proportion 34.6 % (p = 0.010). [After inclusion of Åland explanation proportion is 0.1 %]
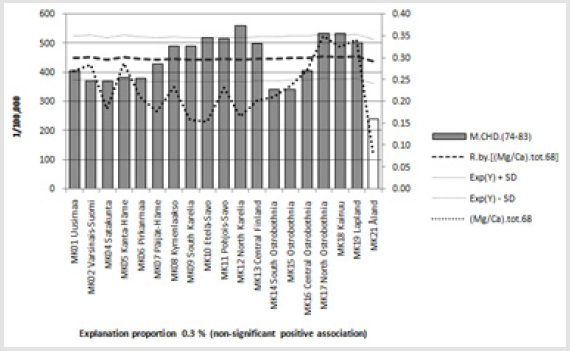
Figure 17: [M.CHD.(74-83)], its regression by [(Mg/Ca).tot.68] and [(Mg/Ca).tot.68] in continental Finland.
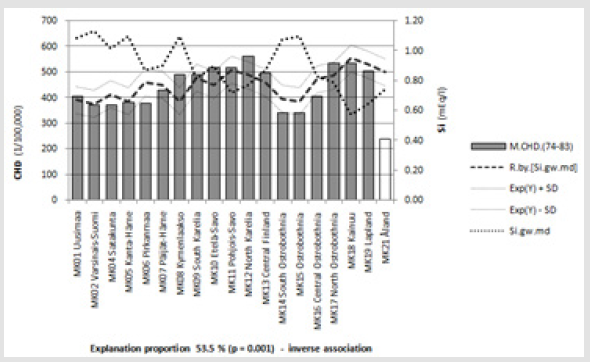
Figure 18: [M.CHD.(74-83)], its regression by [Si.gw.md] and [Si.gw.md] in continental Finland.
Discussion
This study shows association with long-term dolomite application and cropland high Mg/Ca ratio in the North Finland (Tables 4-9), which explains the bias between cropland and groundwater Mg/Ca ratio in the North Finland (Figure 6). Exceptional mean Si.gw in Ostrobothia and high association of Regional means and medians of Si.gw outside of Ostrobothnia was observed and Si.gw results are given by medians. [(Mg/Ca).gw], as well as Si.gw, outside of Lapland, were associated similarly and significantly with cropland (Mg/Ca) (Figures 6 & 7). Significant (inverse) association of [Si.gw.md] with soil-type coarseness is represented in Fig.8 by two parameters. Similarly those parameters explained [(Mg/Ca).gw] (not represented in Results). Factors explaining [M.CHD.(74-83)] in continental Finland can be put in order: [Si.gw.md] ( by 54.6 %) (Figure 18 as Figure 9), soil-type proportions [(mor/coms);(coms/min)] (by 47.8 %, p = 0.008) (Figure 15) and [(Mg/Ca).gw] (by 34.6 %) (Figure 16) and cropland [(Mg/Ca).tot.68] (by 0.3 %) (Figure 17). Figure 14 represents that [M.CHD.(74-83)] was explained by proportional CHD mortality in whole population - [(CHD/Tot).(69-86)] by 72.5 % ( p < 0.001). It is slightly surprising, because time-related CHD and CHD/Tot differ from each other [21]. High explanation proportion can be explained by local stability of both parameters (gw & cropland). Separate assessing of Åland can be justified by different soil-type (carbonate soils [24]), small proportion of Finnish agricultural area (0.5 %) [18,20], low number of soil samples [12,13], as well as deaths [6] and very low number (six) gw samples (!). Especially (Card.o/Tot), which is ca 1/6 from (CHD/Tot) (Figure 12) is very sensitive to statistical bias. Predicting plant available Si in carbonate soils by Si.gw [25], can be misleading, why Si associations are generally given by continental Finland, without Åland (or North).
[(Card.o/Tot).(87-04)] was explained (inversely) better by cropland [(Mg/Ca).tot.88] (45.2 %) (Figure 13) than by [(CHD/ Tot).(87-04)] (34 %) (Figure 12). Even less coincidental [(Mg/Ca). tot.(68)] explained it better (by 40.9 %) (no Fig’s.) than [(CHD/ Tot).(87-04)] [26]. So it is supposed that inverse association of (Card.o/Tot) with (CHD/Tot) were better a consequence of higher Mg availability, which could have stronger effect on more dynamic (Card.o/Tot) than on more regionally and physiologically stable, Si associated, CHD or (CHD/Tot). Although Mg can e.g. prevent coronary artery spasms and cardiac arrhythmias [27] and plateletdependent thrombosis [28] and so be the killer of CHD patients, these mechanisms are supposedly nowadays less fatal: better treated and prevented. These results in (Figures 12 & 13) are not influenced by the change of WHO coding rules [6] (first column, line 1641) (as partially in Figure 1) [5]. About data details: Cropland Ca and Mg data in Tables 2 & 3 were tested for improper data (lapsus, etc): first whether soil-type figure is at least 25 % and not maximally 5-fold to the Total value. All, but one passed the test: In Table 2 Mg from (02).Nylands Svenska (33 mg/l) in Fine sand moraine is only 12.7 % of Total (257). Because Ca 459 mg/l with 186 samples was low, too and N of Mg samples was anyhow 3, acceptance was selected from other choices.
Exceptional Mg (40 mg/l) from (11).Mikkeli was observed (Table 2), but not rejected. So no one of paired samples was discarded. For whole country soil-type comparing was used medians in order to wash out effects of single exceptions. Sandy clay is an important soil-type in SW Finland (and Åland), but rare in other areas (with exclusions of RC.09 & RC10). (Mg/Ca) of Sandy clay was increasing in SW. These results are in accordance with earlier studies: Regional cropland (Mg/Ca) ratio cannot explain regional CHD mortality (Figure 17), [4] - but can explain inversely [(Card.o/Tot)] (Figure 13), [5]. Si.gw (Figure 18) explains regional CHD better than (Mg/Ca).gw (Figure 16) [2]. Explanations, which are working only in continental Finland and by gw, have only statistical value [1], if they cannot explain exceptional statistics of Åland. Association of low Si.gw with low CHD (Figure 18) in Åland could be explained by different micro-milieu around the roots and groundwater [25], although strong data concerning Si contents of foodstuffs is still missing. Low (Mg/Ca) ratio in gw and cropland (Figures 16 & 17) associated with with low CHD seems to be more difficult to explain.
Conclusion
CHD and [(CHD/Tot)] mortality associated stronger with parameters of soil weathering ability, indicated by soil-type distribution, groundwater Si and (Mg/Ca). (Card.o/Tot) associated stronger with cropland (Mg/Ca) and was affected by long-term dolomite application.
Acknowledgement
I am grateful to Professor Osmo Hänninen and late veterinary surgeon Seppo Haaranen for several discussions.
P.S. Exceptional (acid soluble) silicon value of milk [29] suggests on re-analyses of liquid food stuffs (but obviously not solid ones).
References
- Hardness in Drinking-water. Background document for development of WHO Guidelines for Drinking-water Quality. WHO/HSE/WSH/10.01/10/Rev/1. p. 10.
- Schwarz K, Ricci BA, Punsar S, Karvonen MJ (1977) Inverse Relation Of Silicon In Drinking Water And Atherosclerosis In Finland. The Lancet 309(8010): 5538-5539.
- A Kousa, E Moltchanova, M Viik-Kajander, M Rytkönen, J Tuomilehto, et al. (2004) for the Spat Study Group. Geochemistry of ground water and the incidence of acute myocardial infarction in Finland. J Epidemiol Community Health 58: 136-139.
- Toysa T, Hänninen O (2015) Agro-Geology and CHD in Finland. J J Agriculture 1(2): 006.
- Töysä T (2019) Commentary on Association of Regional “Non-CHD Cardiac Mortality” with Cropland Mg/Ca Ratio. Biomed J Sci & Tech Res 22(1).
- Statistics Finland. ‘http://pxnet2.stat.fi/PXWeb/pxweb/fi/StatFin/’ > English > Health > 020_11bt_2017 --Deaths by underlying cause of death (54-group short list) and region, 1969-2017. (WHO coding system: line 1641).
- Jokinen R (1981) Requirements for Magnesium fertilization in Finland. J Sci Agricultural Society in Finland 53(4): 239-268.
- Toysa T (2018) Associations of K/Mg fertilization ratio with non-CHD mortality in Finland during 1952-99. Biomed J Sci &Tech Res 5(3).
- Heinonen R (1956) On Magnesium Requirements on Finnish Agricultural Soils [in Finnish]. Agrogeological Publications 65. Helsinki, Finland p.14.
- Official Statistics of Finland: Farm Register [printed product]. ISSN = 0784-8404. 1988. Agriculture and forestry 1990:2. Helsinki: National Board of Agriculture, map on page 16.
- Pajunen P, Torppa J, Huohvanainen M, Salomaa V, Vartiainen V (2004) Sepelvaltimotautikuolleisuuden itä-länsiero kaventunut 30 vuoden seuranta-aikana miehillä. Suomen Lääkärilehti 59: 5013-5016.
- Kurki Martti (1972) Suomen peltojen viljavuudesta II. Viljavuuspalvelu Oy. Helsinki . Yhteiskirjapaino Oy.
- Eurofins Viljavuuspalvelu Oy. Liite_1.2. Eri maalajien keskimaarainen happamuus ja_86_90. xls 117.50 KB [in Finnish]. (Attachment 2, Acidity and mineral element contents by soil-types in Finnish Rural Centres 1986-1990.)
- Lahermo P, Tarvainen T, Hatakka T, Backman B, Juntunen R, et al. (2002) One thousand wells - the physical-chemical quality of Finnish well waters in 1999. Geological Survey of Finland, Report of Investigation 155. Groundwater database © Geological Survey of Finland 2017.
- (2019) Rajamäki S, Eurofins Viljavuuspalvelu Oy, Personal communication.
- Web: Wikipedia. Finnish Regions.
- Helsinki (1970) Census of Agriculture, Data Per Commune. Suomen Virallinen Tilasto - Finlands Officiella Statistik - Official Statistics Finland II(67): 18-23.
- Central Statistical office: Statistical Yearbook of Finland 1970, Tabl. 69. Area of farms under cultivation according to type of land in 1969 p. 76.
- Official Statistics of Finland: Farm Register [printed product]. ISSN = 0784-8404. Agriculture and forestry 1990:2. Table 2.7.: Land use on farms by Agricultural Advisory Centre according to municipality 31.12.1988 (“Maatilojen maankäyttölajit maatalouskeskuksittain ja kunnittain 31.12.1988”). National Board of Agriculture, Helsinki, Finland.
- Central Statistical Office of Finland: Statistical Yearbook of Finland 1991. Tabl 90. Area of farms under cultivation according to type of land and owner group, 1988. (on p. 106) (especially Åland in 1988).
- Valkonen T, Martikainen P (1990) Development of mortality from ischaemic heart disease in subgroups of the population in Finland. Sosiaalilääketieteellinen Aikakauslehti. Journal of Social Medicine 27: 273-288.
- Töysa T (2018) Rainy Days Geographic Coordinates, Vitamin D, Silicon, Selenium and CHD in Finland in 1962-2014. Biomed J Sci & Tech Res 10(1).
- Statistics Finland. http://pxnet2.stat.fi/PXWeb/pxweb/fi/StatFin/ > English > Health > 020_11bt_2017 --Deaths by underlying cause of death (54-group short list) and region 1969-2017.
- Jones A (2005) Soil Atlas of Europe, European Soil Bureau Network, European Commission, Office for Official Publications of the European Communities, L-2995 Luxembourg. Catalogue Number LB-37-01-744-EN-C. ISBN 92-894-8120-X. EUR 21676 EN. pp. 41,50,51.
- Toysa T, Osmo Hanninen (2016) Soil Weathering, Silicon and CHD in Finland. J J Agriculture 2(1): 008.
- Toysa T (2018) Associations of K/Mg fertilization ratio with non-CHD mortality in Finland during 1952-99. Biomed J Sci & Tech Res 5(3).
- Bloom S (1986) Effects of magnesium deficiency on the pathogenesis of myocardial infarction. Magnesium 5(3-4): 154-164.
- Shechter M (2000) The role of magnesium as antithrombotic therapy. Wien Med Wochenschr 150(15-16): 343-347.
- Töysä T (2020) Discussion on Different Seasonal Variation of Serum Cholesterol in East and West Finland 1956-57 - Milk, Magnesium and Acid Soluble Silicon. Biomed J Sci & Tech Res 25(3).
