Impact Factor : 0.548
- NLM ID: 101723284
- OCoLC: 999826537
- LCCN: 2017202541
Mohd Hazani Mat Zaid1 and Jaafar Abdullah1,2*
Received: November 14, 2018; Published: November 26, 2018
*Corresponding author: Jaafar Abdullah, Department of Chemistry, Faculty of Science, Malaysia
DOI: 10.26717/BJSTR.2018.11.002082
Here we report the PNA surface density and ratio of EDC/NHS was used as coupling agent in electrochemical application based on methylene blue (MB) accumulation charge. In this study, chronouclometry technique has been used to calculate PNA probe density to obtain optimum PNA surface density for electrochemical sensor application. Furthermore, kinetic behavior of PNA electrochemical biosensor also have been investigated to determine the rate electron transfer of MB before and after hybridization. The obtained data revealed that the PNA bound to modified electrode at optimum probe concentration activated at 5/5 mM of EDC/NHS to give highest electrochemical signal. Meanwhile the MB rate electron transfer was obtained in this study was about 2.9 s−1 before and 2.5 s-1 after hybridization by using laviron approach. These result demonstrated that MB has intercalated into DNA through long range charge transfer
Keywords: PNA; Electrochemical Biosensor; Methylene Blue
Abbreviations: NHS: N-Hydroxy Succinimide; MB: Methylene Blue; CC: Chronocoulometric; EDC: Ethyl Dimethylaminopropyl Carbodiimide; Ks: Electron Rate Transfer; FTIR: Fourier Transform Infrared Spectroscopy
Probe density is one of important factor in order to improve detection signal in electrochemical biosensor [1]. Instead of DNA, PNA has difference properties due to its neutral backbone and proper interbase spacing, PNA binds to its complementary nucleic acid sequence with higher affinity and specificity compared to traditional oligonucleotides [2]. The use cross-linking and conjugation of method to immobilization of NH2-containing biomolecules onto carboxyl-containing substrates via covalent amide bond by using EDC and NHS most widely used to control over the immobilization of the probe oligonucleotides. However, the amount of EDC and NHS been used to bound amine biomolecule in previous study seem different between modified electrode. In previous report, wide range of EDC/NHS concentration from M to the mM range from one study to another has been studied. Voicu, et al. [3] used 0.1M NHS and 0.4 M EDC in order to activate silicon surface. In another study, equal amounts of EDC and NHS (100mM) were used for activation of carboxylic acid terminated self-assembled monolayers [4]. Therefore, in this study, we shared result obtained of amount of 1-ethyl-(dimethylaminopropyl) carbodiimide hydrcholoride (EDC) and N-hydroxy succinimide (NHS) used as controlling agent to determine PNA probe density on SPCE modified graphene quantum dots nanomaterial once the carboxyl groups to produce NHSS-ester [5] (Figure 1). Additionally, the rate of methylene blue (MB) also been investigated.
Seven different concentration of EDC will be examined while concentration of NHS was maintained to 5mM. For this purpose, the PNA surface density was determined by using chronocoulometric (CC) method based on that reported by Steel et al. [6]. Chronocoulometry is a useful method for studying homogeneous chemical reactions that are coupled to the heterogeneous electron transfer reactions. These method will determine the amount of methylene blue (MB) as redox molecule that was adsorbed into ssPNA then was translated to the ssPNA surface density according to equation
TPNA = TMBΧZ / M (Na)
where ƬPNA is PNA surface density, Z is the charge of MB and M is the number of bases in PNA (5_-CTCGTCCAGCGCCGCTTCGG-3), NA is Avogadro’s number and Ƭ is MB surface coverage, where ƬMB value was calculated from Equation:
Q = nFAT
where Q is the charge which was obtained from choronouclometry measurement, n is the number of electrons in the reaction, and A is the surface area of fabricated electrode (0.12cm2). While based on scan rate study, calculation on laviron approach [7] to determine the electron transfer rate has been determined by cyclic voltammetry. The measurement was carried out by Autolab PGSTAT30 (Netherlands) which is con-trolled using computer.
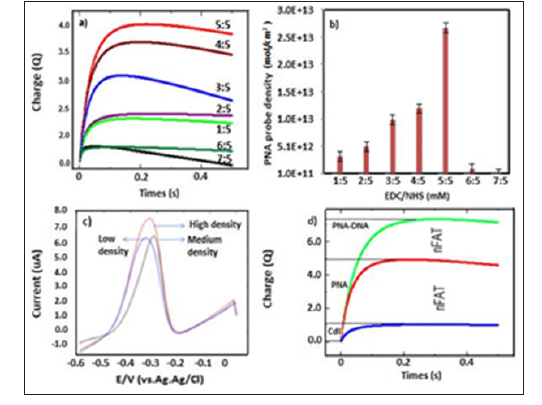
Figure 2: a. Chronouclorogram response with difference EDC/NHS concentration;
b. Bar graph PNA probe density (ƬPNA) against EDC/NHS concentration (mM);
c. DPV response at difference PNA probe desnity;
d. Chronouclorogram response before and after hybridization with target DNA.

In this study, screen printed electrode modified NH2-graphene have been used as transducer material which composed of carboxyl groups on the surface of nanomaterial is important functional group to be activate by EDC/NHS. These were proven by characterization using fourier transform infrared spectroscopy (FTIR) analysis which a broad absorption band at 3340 cm-1 appeared attributed to (O-H) stretching of -COOH group [8] Subsequently, as shown in Figure 2a the highest chronouclorometry response was accomplished at concentration of EDC/NHS were 5mM:5mM with PNA surface density (ƬPNA) calculated was 2.68 x 10¹³ ± 0.32mol/ cm2 (n=3) and the lowest value obtained at concentration of EDC/NHS were 7mM:5mM with surface density (ƬPNA) calculated was 1.94 x 10¹¹ ± 0.71 mol/cm2 (Figure 2b). In order to prove effectiveness probe density on our fabricated electrode, DPV measurement has been carried out with target DNA. In Figure 2c, three selected electrode condition with high, medium and low PNA probe density have been introduce with 1μM of target DNA, the result shows that at high PNA probe density, the highest MB peak current was obtained indicated successfully hybridization has occurred. This result contrary in most cases by using DNA as a probe in previous studied which showed decreasing of DNA probe density has led to increasing electrochemical signal due to lack of bulk steric effect [9].
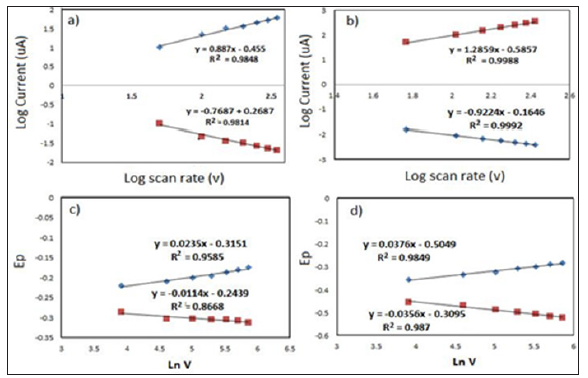
In addition, PNA is also well known with the natural charge contradict with DNA properties typically with carry negative charge, therefore electrostatic repulsion would not be an issue at high density probe. Therefore, higher probe density ought to yield higher MB accumulation charge and enhanced sensor signal. This can be seen in chronouclometry response studies which had shown larger accumulation charge was obtained after hybridization events on modified electrode as shown in Figure 2d. Moreover, PNA-DNA surface density approximately about 74.8% more than PNA surface density on modified electrode. Furthermore, kinetic analysis of the ET reactions in the system MB-PNA-modified electrodes was performed by processing the CV data within the Laviron formalism in Figure 3. The plotted on the cathodic and anodic peak currents of MB increased gradually with the increase of scan rate which were linearly proportional to scan rate in the range from 50 to 350 mV s- 1. Beside two linear regression equations based on anodic log peak current (ipa) and log scan rate were plotted before and after hybridization stage. The result has shown that slope exhibit more than 0.5 as Ipa (μA)= 1.026x-1.2105 (R2=0.996) and Ipa (μA)= 0.7884x + 0.004 (R2=0.997) (Figures 3a & 3b) suggest that the electrochemical the electron transfer process of MB in fabricated electrode before and after hybridization was a typical surfaceconfined electrochemical behavior or absorption control process [11].
Figure 3: Plotted graph log of scan rate (V) vs log of peak current (ip) at 50-350 mV/s) before and after hybridization (a-b); Ln scan rate.

In Figures 3c & 3d, plot of Ep versus ln V yields two straight lines (Epa (V)= 0.0234x-0.3151(R2=0.960 (R2=0.98); Epc(V)=0.0114x-0.2439(R2=0.866) before hybridization and Epa(V)=0.0323x-0.383) ;Epc(V)=-0.0182x-0.2455 (R2=0.98) after hybridization respectively. Thus, the value of αn can be easily calculated from the slope of Epa againt Ln V. According Laviron equation, the slope of Epa are equal to RT/(αnf), while Epc equal RT/ (1-α)nf respectively. Where α is transfer coefficient, n is electron transfer number involved in the rate determining step, and V is scan rate, R, T and F have their usual meanings (R = 8.314 J mol−1 K−1, T = 298 K, F = 96,480 C mol−1). Thus the value of αn was calculated to be 1.11 and 0.80, respectively. It well known that the transfer electron number in MB to LB involves two-electron transfer [11] therefore the rate coefficient (α) were determine is 0.55 and 0.34 respectively before and after hybridization. The value α is assumed to be 0.5 before hybridization indicated that symmetry behavior of transition state between reactant and product. However, the value of 0.34 suggesting that asymmetry transition state between MB to LB occurred due to external force influence activated complex at the transition state after hybridization with DNA target [12].
These result suggested that effect of hybridization with DNA target has led to unbalance driving force energy in MB electrochemical reaction. Subsequent, the electron transfer rate constant (ks) was calculated to be 2.9 s−1 and 2.5s-1 before and after hybridization. The difference in the Ks value before and after hybridization indicate that the average distance between MB and surface modified electrode significantly increases in the double helix form compared to that of the single stranded form [13]. This information supported the developed theory of long electron transfer range of MB through the PNA-DNA duplexes [14]. Additionally, the impact of probe surface density toward electron rate transfer constant (Ks) also can be seen the reason to the increasing of Ks value after hybridization state. PNA-DNA with high density relatively densely packed oligonucleotide layer, which likely hinders target accessibility and limits the rate of target-probe hybridization.
In this study, chronoucolometry has been successful to study the effect of EDC/NHS as coupling agent to attach PNA probe on modified electrode. An equal amount of EDC and NHS needed approximately about 5mM/5 mM for activation of COOH group on modified electrode graphene quantum dots which excess EDC amount led to lower surface coverage. It also observes the highest electrochemical signal was obtained in this study at larger surface PNA density compared to lower surface coverage. Furthermore, calculated electron rate transfer (Ks) due to methylene blue (MB) reduction approximately about 2.5s-1 - 2.9s-1 can be used to justify the ability of MB as redox indicator.


