info@biomedres.us
+1 (502) 904-2126
One Westbrook Corporate Center, Suite 300, Westchester, IL 60154, USA
Site Map
Received: October 14, 2017; Published: October 24, 2017
Corresponding author: Suman Gehlot, College of Pharmacy, Dr. APJ Abdul Kalam University, Indore, India
DOI: 10.26717/BJSTR.2017.01.000459
The objective of this study was to design and evaluate oral sustain release drug delivery system for Cinnarazine using hydrophilic polymers such as and HPMC (K100M), PVP (K) batches. Four batches were prepared by using HPMC (K100M) in drug: Polymer ratio of 1:1, 1:1.5, 1:2, 1:3 and five batches using PVP (K) in ratios of 1:1, 1:1.25, 1:1.5, 1:1.75 and 1:2. Further formulation F9 was modified by varying the ratios of diluents i.e F10, F11, F12 and F13 to check the effect of diluents on drug release. Matrix tablets were prepared by wet granulation method and were evaluated. Among the formulations studied, formulation F9 containing HPMC K100M (1:2) showed sustained release effect for 20 h with cumulative percent release of 88% similar to that of the research listed drug. The kinetic treatment showed that the optimized formulation follow first order kinetic with release exponent (n) 0.579 and having good stability as per ICH guidelines. Key Words: Sustained release, Hydrophilic gums, HPMC (K100M)/ (PVP (K), Magnesium stearate, Lactose and drug Cinnarazine.
Keywords : Sustain release; Matrix tablet; Cinnarazine
Abbreviations : DSC: Differential Scanning Calorimetry; FTIR: Fourier Transform Infrared
Sustained release, sustained action, prolonged action controlled release, extended action, timed release, depot and repository dosage forms are terms used to identify drug delivery system that are designed to achieve or prolonged therapeutic effect by continuously releasing medication over an extended period of time after administration of a single dose. On exposure to aqueous fluid, hydrophilic matrices take up water, and the polymer starts hydrating to form a gel layer. Drug release is controlled by a gel diffusion barrier and/or by surface erosion. An initial burst of soluble drug may occur due to the surface leaching. When a matrix containing a sellable glassy polymer comes in contact with an aqueous medium, there is an abrupt change from a glassy to a rubbery state, which is associated with the swelling process.
Through visual inspection, the physical appearance of pure drug was carried out as per United State Pharmacopeia XV. The Melting point was determined by the capillary method using Melting point apparatus. The capillary tube was filled by pressing the open end gently into pure drug sample by tapping the bottom of the capillary on a hard surface so that the drug pack down into the bottom of the tube. When the drug was packed into the bottom of the tube, the tube was place into the slot behind the eye-piece on the Melttemperature. Make sure the units were plug in and set to zero, and then turn it on. Temperature range was noted when sample start melting. Triplicate observations were recorded for melting range
A definite quantity (10 mg) of drug was dissolved in 10 ml of each investigated solvents at room temperature. The solubility was observed only by UV method.
The partition coefficient of drug was determined in n-octanol: water system (50:50) in triplicate by standard technique. A weighed amount of drug (10mg) was added into 10 ml each of n-octanol and water. The mixture was shaken for 24hrs until equilibrium was reached. Phase was separated in separating funnel and aqueous and non-aqueous phase was filtered (through 0.2μ filter) and analyzed by using UV spectrophotometer. The partition coefficient (Po/w) of drug was calculated from the ratio between the concentrations of drug in organic (Coil) and aqueous phase (Caq.) using following equation [2].
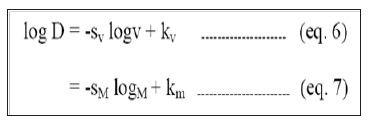
Diffusivity, the ability of a drug to diffuse through the membranes, is inversely proportional to molecular size. For most polymers it is possible to relate log D, Empirically to some function of molecular size as follows.
Figure 4 :
Cinnarazine was accurately weighed 10mg of cinnarazine in 10ml volumetric flask. The volume was then made upto 100ml by using 0.01N HCL solution to obtain the solution of 100μg/ml. From the Cinnarazine stock solution (100 μg/ml) 1ml was pippeted and diluted to 10ml by using 0.01N HCL solution into different volumetric flask and made upto 10ml with 0.01N HCL solution so as to get concentration of 1.0 to 10.0 μg/ml
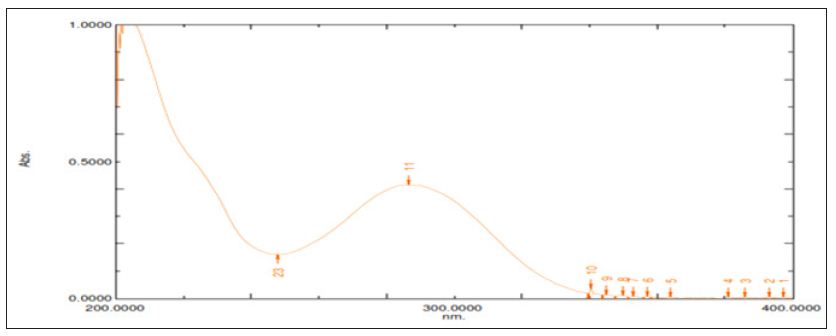
From the standard stock solution 1ml was pippeted into a volumetric flask. The volume was made upto 10ml with 0.01N HCL solution. The resulting solution containing 10μg /ml was scanned between 200-400 nm the λmax was found to be 252nm [3].
From the Cinnarazine stock solution (100 μg/ml) 1 ml was pippeted and diluted to 10ml by using 0.01N HCL solution. From the solution appropriate aliquots was taken into different volumetric flask and made up to 10 ml with 0.01N HCL solution so as to get concentration of 1.0 to 10.0 μg/ml [4].
The Drug (Cinnarazine), polymer HPMC (K100M), PVP (K), all the excipients magnesium stearate and lactose were passed through sieve no. 80 separately. Nine different formulations with polymer ratios were prepared i.e. 1:1, 1:1.5, 1.2, 1:2.5, 1:3, 1:3.5, 1:4, 1:4.5 and 1:5 by keeping the amount of lactose at 30 mg and Cinnarazine at 375 mg constant with magnesium stearate 2% w/w. After sieving all ingredients were mixed in mortar. Prepared mixture was passed through sieve no.40 and transferred the ingredient mixture in clean mortar. Added isopropyle alcohol sufficient quantity in mixed powder for preparing dump mass. The dump mass mixture was passed through sieve no. 22. After sieving this mixture was dried in hot air oven for 30 min.
It can be done by taking the accurately weighed powder blend and allowing it to flow freely through the funnel, fixed to a stand at definite height. The height (h) and diameter (d) of the powder cone are measured and the angle of repose can be calculated by the formula, tanθ = h/r (or) θ = tan−1h/r .
Bulk density (Db) is the ratio of weight of the untapped powder sample to its initial volume & it was determined by following formula. (w = weight of the untapped powder, Vb = initial volume)
Bulk density (Db) = W/Vb .
Tapped density (Dt) is the ratio of weight of the powder sample to its tapped volume & it was determined by following formula. (w = Weight of powder sample, Vt = Tapped volume).
It is calculated using following formula: Tapped density (Dt) = W/Vt .
The Carr’s compressibility index (also called as Carr’s Consolidation index or Carr’s Index) was calculated using following formula: Carr’s Compressibility index = (Dt–Db)/Dtx100 .
Hausner’s ratio was calculated from the measured values of tapped density (Dt) and bulk density (Db), as follows, Hausner’s ratio = Dt/Db .
Preformulation studies are very important for the successful formulation of any dosage form. Differential Scanning Calorimetry (DSC), Fourier Transform Infrared (FTIR) Spectroscopy studies (Joshi et al.,) and HPTLC were used for the evaluation of physicochemical compatibility and interactions, which helps in the prediction of interaction of the drug with polymers, diluents and lubricants used in case tablet formulations. Positive interactions sometimes have a beneficial effect as far as desired release parameters are concerned. The earlier investigations recommended that the ratio of drug to excipients used in study was 1:5 for diluents, 3:1 for binders or dis-integrants, 5:1 for lubricants and 10:1 for colorants etc, but it is observed that 1:1 ratio of drug excipients maximizes the possibility of interaction and helps in easier detection of incompatibilities 17. Therefore, in the present study 1:1 ratio was used for preparation of physical mixtures and analyzed for compatibility studies [5].
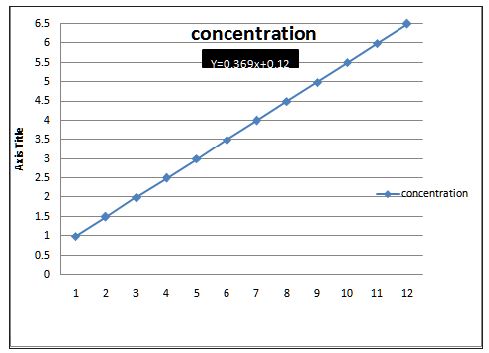
10mg drug was dissolved in 100ml of 0.1N HCl & from these different dilutions were prepared in concentration range of 5, 10, 15, 20, 25, 30, 35, 40, 45, 50, μg/ml & absorbance was taken at 252 λmax nm (Figure 1).
Figure 1 : Standard plot of Cinnarazine in 0.1 N HCL solution.
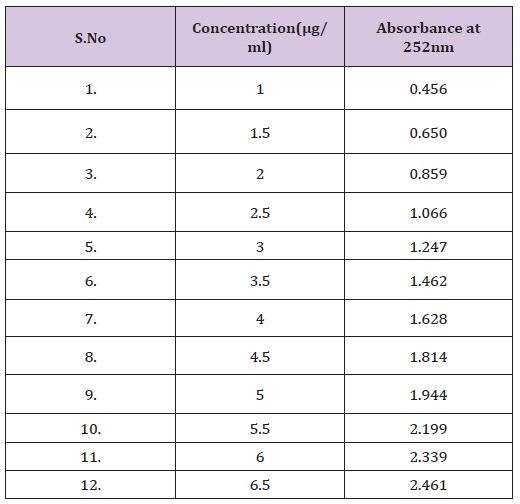
10mg drug was dissolved in 100ml PBS from these different dilutions were prepared in concentration range of 5, 10, 15, 20, 25, 30, 35, 40, 45, 50 μg/ml & absorbance was taken at 252 λmax nm (Table 1).
Table 1 : Standard plot of Cinnarazine in 0.1 N HCL solution.
All the excipients and drug was weighed and sieved properly and triturated with the help of isopropyl alcohol according to geometric dilution. This mixture was passed through sieve no. 22. After sieving this mixture was then dried [6].
The matrix tablets of the above formulations were compressed in a single punch tablet compression machine. A weighted amount of the sustain release granules was introduced in the die and the die capacity was adjusted as required. Compression force was adjusted to obtain the required hardness. A batch of 9 tablets was prepared for all formulations (Tables 2-4).
Table 2 : Formulations Containing Drug & HPMC (K100M).
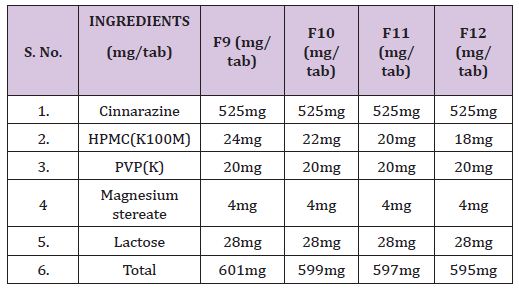
Table 3 : Formulations Containing Drug & PVP (K).
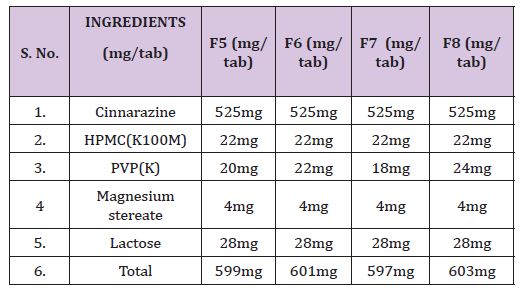
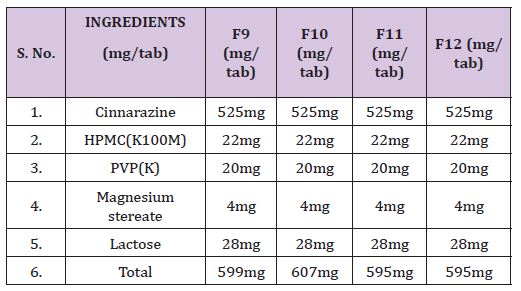
Table 4 : Formulations containing drug, HPMC (K100M) & various concentrations of excipients.
The various characteristics of powder blend like bulk density, tapped density, angle of repose, particle size and drug content were studied. The formulated tablets were evaluated for hardness, friability, uniformity of weight and drug content.
The thickness of tablets was determined by using vernier caliper. Five tablets from each batch were used & average values were calculated [7].
The test was carried out on six tablets using disintegrating apparatus in distilled water medium at 37 ± 1ºC. The average D. T. was recorded [8-15].
The hardness test was done for five tablets using Monsanto hardness tester, & the average value was recorded [16].
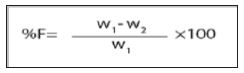
This test was performed on 20 tablets using Roche friabilator. The tablets were weighed and put in the friabilator, after 100 revolutions, the tablets was redusted and weighed. Percent loss in weight will be recorded. This can be calculated with the help of following formula, %F = Loss in weight/ Initial weight x 100 [17].
Figure 5 :
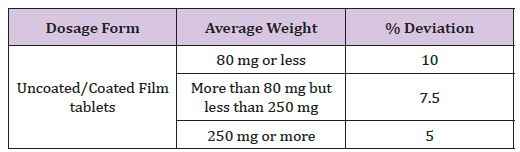
This test was done as per the guidelines of USP, tablets will randomly sampled and take individual weight of 20 tablets in analytical balance and determine standard deviation (Table 5).
Table 5 : Limits for weight variation (USP - XV).
Five tablets were weighed and triturate, from that transfer an accurately weighed portion of the powder equivalent to about 95mg of cinnarazine to a 100ml volumetric flask containing buffer solution and then concentration is measured at λmax i.e 252 nm.
The influence of compression force could only be observed in lag time. Tablets made at lowest crushing strength (compression force 3 KN) with Methocel K4 M showed an initial burst effect due to initial partial disintegration. Once the polymer was swollen, the dissolution profile became similar to the tablets compressed with a higher crushing strength. It has been reported that changes in compression force or crushing strength appeared to have minimal effect on drug release from HPMC matrix tablet once a critical hardness is achieved. Increased dissolution was only observed when tablets were too soft and it was attributed to the lack of powder compaction or consolidation (3 KP) [18].
The size and shape of tablet for the matrix system undergoing diffusion and erosion might affect the drug dissolution rate. Modification of surface area for metoprolol tartarate tablets formulated with Methocel K100 LV from standard concave shape (0.568 sq in) to caplet shape (0.747 sq in) showed an approximately 20-30% increase in dissolution at each time point.
The dissolution studies were performed in triplicate for all the batches in a USP XXIII dissolution rate test apparatus (type II). The release studies were performed at 75 rpm in 900 ml of 0.1 N HCl buffer pH 1.2 at 37 ± 0.2οC. Five milliliters aliquots were withdrawn at predefined intervals, and the volume of the dissolution medium was maintained by adding the same volume of fresh prepared warmed dissolution medium. The absorbance of the withdrawn samples was measured spectrophotometer at 252 nm.
The optimized formulation was subjected for two month stability study according to ICH guidelines. The selected formulations were packed in aluminum foils, which were in wide mouth bottles closed tightly. They were then stored at 40ºC / 75% RH for 2 months and evaluated for their drug release study.
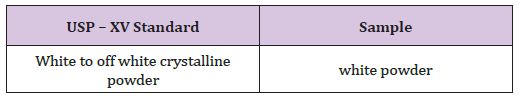
Physical appearance of Cinnarazine sample complies the USP standard (Table 6).
Table 6 : Physical Appearance of Cinnarazine.
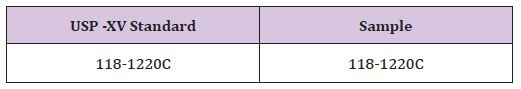
According to USP XV the melting point of Torsemide (Standard) is 163-1640 C and melting of sample was found to be in the range of 161-1640 C (Table 7).
Table 7 : Determination of Melting Point of Cinnarazine.
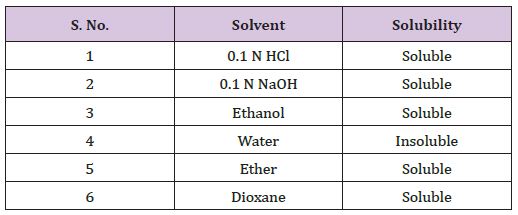
Solubility of cinnarazine was determined in solvents given the table (Table 8).
Table 8 : Determination of Melting Point of Cinnarazine.
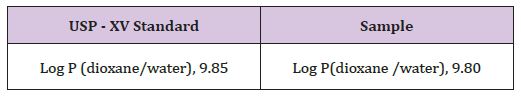
The partition coefficient of Cinnarazine was determined (Table 9).
Table 9 : Determination of Melting Point of Cinnarazine.
The UV absorption maxima were determined by scanning solution of Cinnarazine in the range of 200-400 nm by Shimadzu – 1800 UV/Visible spectrophotometry, and it was found to be 252 nm (Figures 1 & 2).
Figure 2 : Absorption Maxima of Cinnarazine in 252nm.
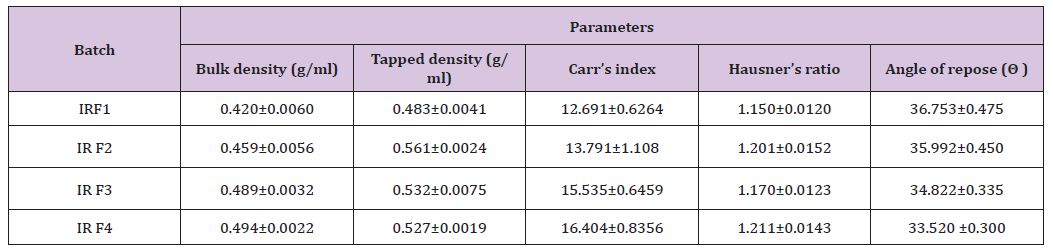
The characterizations of different SR release granules were done for determination of mass‐volume relationship parameters. The evaluated parameters are bulk density, tapped density, compressibility index, and angle of repose, Carr’s index, Hausner’s ratio (Table 10).
Table 10 : Determination of Melting Point of Cinnarazine.
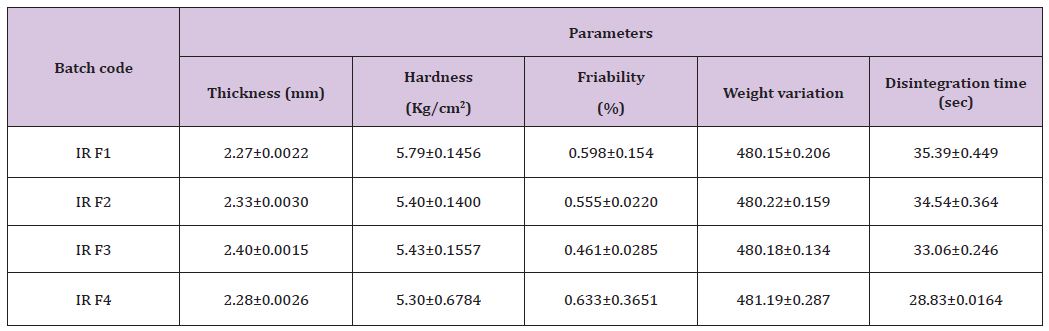
The characterizations of sustain release tablets were done. The evaluated parameters were thickness, hardness, friability, weight variation, disintegration which are given in table (Table 11).
Table 11 : Post-compression Studies of Sustain Release Tablets.
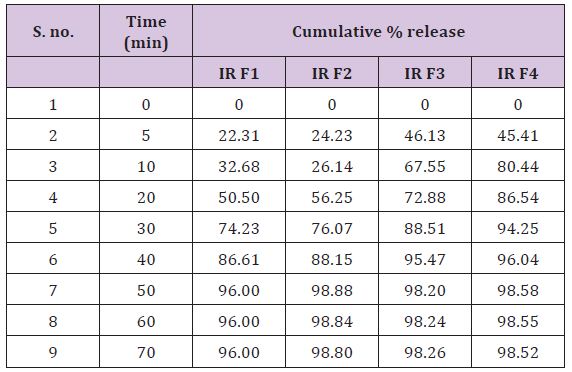
HCL: In-vitro drug release studies were performed & drug release data of different formulation are given in table (Table 12) (Figure 3).
Figure 3 : In-vitro Drug Release Profile of SR-Release Matrix-Type Tablet of Cinnarazine.
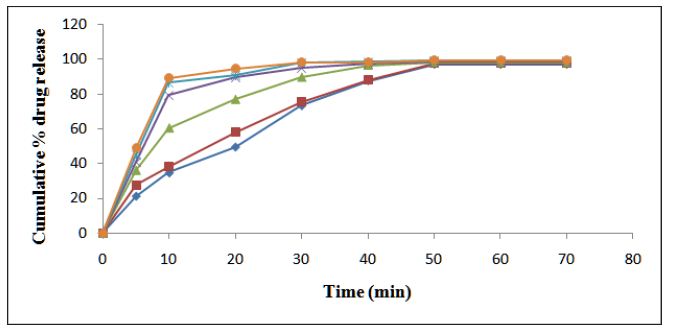
Table 12 : In-vitro Release for SR-Release Matrix-Type Tablet of Cinnarazine in 0.1N HCl.
Cinnarazine Sustain Release matrix-Type Tablets, In preliminary studies various formulation combinations and parameters such as concentration of lactose, magnesium stearate, HPMC & PVP were varied during the drug loading stage, PVP(K) they are responsible to produce increase solubilization & fast release of drug and to produce immediate effect in GIT. For SR, Four different SR release batches using HPMC(K100m) (F1,F2,F3,F4) and Four SR release formulation using PVP (K) (F5, F6, F7, F8) and two SR release formulation using excipeint lactose & magnesium stearate (F9, F10, F11, F12) was prepared. After performing the pre and post formulation studies on these batches it was found that IR-6 shows the best immediate release profile and SR F-2 shows the best sustained release profile. So by taking IR-6 & SR F-2 a final batch (M1) of Sustain Release matrix-Type Tablet was prepared.
Post formulation studies on the batch (M1) were performed. The average thickness of the tablets was found to be 2.51±0.0012 mm, the average hardness was found to be 5.11±0.1024 kg/cm2, the average friability was found to be 0.43±0.0051 % & it passed the friability test. The SR tablet also passed the weight variation test and the average disintegration time was found to be 25±0.0015 seconds. The in-vitro dissolution studies were carried out & the SR tablet released 95.45% of drug over the time period of 10 hours.


