info@biomedres.us
+1 (502) 904-2126
One Westbrook Corporate Center, Suite 300, Westchester, IL 60154, USA
Site Map
Received: March 11, 2026; Published: March 24, 2026
*Corresponding author: Zhang Jiren, Huangzhou Yuxianghu Future Hospital, Huangzhou, China
DOI: 10.26717/BJSTR.2026.65.010145
Objective: To establish a quantitative system for the safety thresholds of bloodletting therapy based on modern
physiology, biophysics, and mathematical modeling, providing scientific and individualized operational standards
for traditional bloodletting therapy and promoting the modernization transformation of traditional Chinese
external treatments. Methods: Using principles of fluid dynamics, hemodynamics, cybernetics, and systems
biology, the mathematical relationships between blood pressure, hemoglobin, heart rate, blood oxygen saturation,
and blood loss were derived to establish a multiparameter comprehensive safety threshold model; infrared
thermography technology was integrated to construct a local stasis assessment system, forming a “local-systemic”
dual-layer safety monitoring framework. Results: A comprehensive model was constructed, including quantitative
assessment of local stasis  and systemic physiological safety monitoring
  ,
proposing an individualized bloodletting volume calculation formula
,
proposing an individualized bloodletting volume calculation formula  . This model
introduces a Traditional Chinese Medicine (TCM) syndrome differentiation correction coefficient, achieving an
organic integration of the traditional principle “reduce excess” with modern physiology. Conclusion: The mathematical-
physical model established in this study provides a quantifiable, reproducible, and verifiable scientific
basis for the safe implementation of bloodletting therapy, marking an important transition from “empirical medicine”
to “precision medicine,” with demonstrative significance for the modernization of TCM.
. This model
introduces a Traditional Chinese Medicine (TCM) syndrome differentiation correction coefficient, achieving an
organic integration of the traditional principle “reduce excess” with modern physiology. Conclusion: The mathematical-
physical model established in this study provides a quantifiable, reproducible, and verifiable scientific
basis for the safe implementation of bloodletting therapy, marking an important transition from “empirical medicine”
to “precision medicine,” with demonstrative significance for the modernization of TCM.
Keywords: Bloodletting Therapy; Safety Threshold; Mathematical Model; Hemodynamics; Precision Medicine; Integration of Traditional Chinese and Western Medicine; Infrared Thermography
Abbreviations: TCM: Traditional Chinese Medicine; LBNP: Lower Body Negative Pressure; CRM: Compensatory Reserve Measurement; IgG: Immunoglobulin G; MAP: Mean Arterial Pressure; CO: Cardiac Output; TPR: Total Peripheral Resistance; HR: Heart Rate; SV: Stroke Volume; EDV: End-Diastolic Volume; SBP: Systolic Pressure; DBP: Diastolic Pressure; MCFP: Mean Circulatory Filling Pressure; PRA: Right Atrial Pressure; Hb: Hemoglobin
Research Background and Significance
Bloodletting Therapy is one of the oldest therapeutic methods in the history of human medicine, with applications traceable to ancient Egypt and Greece around 1500 BC [1]. In China, the “Huangdi Neijing Ling Shu” clearly states the therapeutic principle “remove the congested and stagnant,” laying the theoretical foundation for bloodletting therapy [2]. However, with the development of modern medicine, due to the lack of quantitative standards and safety guarantees, bloodletting therapy has gradually been marginalized, limited to therapeutic phlebotomy for a few specific diseases (such as polycythemia vera) [3]. In recent years, with the rise of systems biology, mathematical modeling technology, and precision medicine, the modernization transformation of traditional medicine has encountered a historic opportunity. As an important component of TCM external therapies, bloodletting therapy has unique efficacy in promoting blood circulation and removing stasis, dredging meridians and activating collaterals, clearing heat and purging fire, etc. However, its safety issues have always been the key bottleneck limiting its clinical promotion [4]. Traditional operations mostly rely on the physician’s personal experience, lacking objective physiological monitoring indicators and quantitative operational standards, leading to unstable efficacy and potential risks. This study aims to use modern physiology, biophysics, and mathematical modeling methods to establish a safety threshold mathematical model based on core physiological indicators such as blood pressure, hemoglobin, heart rate, and blood oxygen saturation, and to integrate infrared thermography technology to achieve quantitative assessment of local stasis, constructing a “local-systemic” dual- layer safety monitoring system, providing scientific, individualized, and standardized operational norms for bloodletting therapy.
Current Research Status at Home and Abroad
Research Progress in Hemodynamic Mathematical Models
Hemodynamic mathematical modeling began with the Windkessel model proposed by Stephen Hales in 1733. This model treats large arteries as an elastic chamber, describing the formation mechanism of the blood pressure waveform [5]. In 1899, Otto Frank developed it into a mathematical model, laying the foundation for cardiovascular system modeling [6]. In the 1960s, Guyton et al. established the famous circulatory physiology model, proposing the theory that the intersection of the venous return curve and the cardiac function curve determines cardiac output, providing an important framework for understanding the compensation mechanism of blood loss [7]. In recent years, important progress has been made in the mathematical modeling of hemorrhagic shock. Hirshberg, et al. [8] proposed a simplified hemorrhagic shock model capable of describing the temporal evolution of blood pressure, heart rate, and cardiac output after blood loss [8]. This model achieves a good balance between simplicity and clinical relevance and is widely used in combat casualty care and emergency medicine research [9]. Cecconi, et al. [10] published an international consensus on circulatory shock and hemodynamic monitoring, emphasizing the important role of mathematical models in guiding fluid resuscitation [10]. In the study of blood loss tolerance, the Lower Body Negative Pressure (LBNP) model has become the gold standard for simulating hemorrhagic shock [11]. This model induces central hypovolemia through lower limb negative pressure suction, allowing the study of the human body’s compensatory response to blood loss under safe and controllable conditions. This difference is closely related to autonomic nervous regulation ability, baroreceptor sensitivity, and cerebrovascular autoregulation function [12].
Compensatory Reserve Measurement (CRM) and Early Warning
Traditional vital signs (blood pressure, heart rate) often remain
normal in the early stages of blood loss, not showing significant
changes until compensatory mechanisms are exhausted, leading to
delayed diagnosis [13]. To address this issue, the U.S. Army Institute
of Surgical Research developed Compensatory Reserve Measurement
(CRM) technology, quantifying the body’s compensatory capacity for
hypovolemia by analyzing arterial waveform morphological features
[14]. CRM is defined as  where BLV is blood
loss volume, and BLVHDDis the blood loss volume required to reach
hemodynamic decompensation [15]. Studies show that CRM can predict
the occurrence of hemorrhagic shock 30-60 minutes before traditional
vital signs become abnormal, providing a time window for
early intervention [16]. Latimer et al. (2023) validation study in prehospital
trauma patients showed that CRM<0.4 has high specificity
for predicting hemorrhagic shock [15].
where BLV is blood
loss volume, and BLVHDDis the blood loss volume required to reach
hemodynamic decompensation [15]. Studies show that CRM can predict
the occurrence of hemorrhagic shock 30-60 minutes before traditional
vital signs become abnormal, providing a time window for
early intervention [16]. Latimer et al. (2023) validation study in prehospital
trauma patients showed that CRM<0.4 has high specificity
for predicting hemorrhagic shock [15].
Modern Research on Bloodletting Therapy
Modern research has revealed the mechanism of action of bloodletting therapy from multiple perspectives. At the microcirculation level, bloodletting can improve local hemorheological status, reduce platelet aggregation rate and plasma viscosity, and promote vascular endothelial repair [17]. At the immunomodulation level, bloodletting can stimulate local and systemic immune responses, increase immunoglobulin G (IgG) content, and regulate lymphocyte subset levels [18]. At the neurohumoral regulation level, stimulating specific acupoints can regulate the autonomic nervous system through neural reflexes, releasing endogenous analgesic substances [19]. In terms of clinical application, Meta-analysis shows that bloodletting therapy for gouty arthritis is superior to conventional Western medicine treatment in terms of total effective rate (RR=1.15, 95% CI: 1.10-1.21), reduction in blood uric acid (SMD=-1.54), and pain score (SMD=- 0.77), with fewer adverse reactions [20]. In the treatment of psoriasis vulgaris, combined bloodletting can improve clinical effective rate (RR=1.15), reduce PASI score (MD=-0.96), and decrease recurrence rate (RR=0.41) [21].
However, existing studies generally suffer from insufficient standardization of bloodletting volume. Literature-reported bloodletting volumes range from 0.1 mL to 200 mL, with most relying on the practitioner’s experience and lacking physiological-based quantitative standards [22]. A study found through data mining that 0-10 mL or 0-15 drops is the most commonly used bloodletting volume, but the overall distribution is scattered, with no clear concentration trend [23]. This lack of standardization not only affects efficacy reproducibility but also poses safety risks.
Application of Infrared Thermography in TCM Diagnosis
Infrared thermography technology provides an objective quantitative
tool for TCM “observation diagnosis” by detecting body surface
temperature distribution. Research shows that infrared thermography
can accurately capture the body surface temperature characteristics
of TCM syndrome patterns, such as the significant specificity
of temperature distribution in patients with Chaihu Guizhi Ganjiang
Decoction syndrome [24]. In the study of meridians and acupoints,
infrared thermography can display temperature abnormalities along
meridian pathways, providing visual evidence for the theory “where
the meridian passes, it governs” [25]. In stasis assessment, infrared
thermography can quantify the local temperature difference (ΔT)
and abnormal area (A), reflecting the degree of microcirculation impairment
[26]. The thermographic stasis  is positively correlated with the degree of local blood flow reduction,
providing an objective basis for bloodletting site selection and dosage
determination [27].
is positively correlated with the degree of local blood flow reduction,
providing an objective basis for bloodletting site selection and dosage
determination [27].
Research Objectives and Innovations
The main objective of this study is to establish a safety threshold system for bloodletting therapy based on mathematical-physical models, achieving the following innovations:
1. Theoretical Innovation: Integrating fluid dynamics, hemodynamics with TCM “Qi and Blood theory,” constructing a mathematical model of “stasis-blood loss-compensation,” providing a modern physiological interpretation of the “reduce excess” principle.
2. Methodological Innovation: Integrating multiparameter monitoring of blood pressure, hemoglobin, heart rate, blood oxygen, etc., establishing an individualized safety threshold calculation formula; introducing infrared thermography technology to achieve quantitative assessment of local stasis.
3. Application Innovation: Proposing a dual-constraint model of “local demand-systemic safety,” formulating hierarchical and graded bloodletting operation standards, providing quantifiable and reproducible operational standards for clinical practice.
Physical-Physiological Basis of Blood Pressure Formation
The Fluid Dynamic Nature of Blood Pressure
Blood pressure is the lateral pressure exerted by blood flow on the vessel wall, and its physical essence conforms to the basic laws of fluid dynamics. According to Pascal’s principle and Newton’s law of fluid dynamics, blood pressure can be expressed as:
 Where F is the force exerted by
blood on the vessel wall, S is the vessel wall area, ρis blood density, v is
blood flow velocity, g is gravitational acceleration, h is liquid column
height, R is vascular resistance, and Q is blood flow [28].
In the cardiovascular system, the formation of blood pressure
requires three basic conditions: a closed circulatory pipeline system
(cardiovascular system), a driving pump (heart), and a resistive pipe
network (vascular system). According to the fluid dynamics analogy
of Ohm’s law, mean arterial pressure (MAP) is jointly determined by
cardiac output (CO) and total peripheral resistance (TPR):
Where F is the force exerted by
blood on the vessel wall, S is the vessel wall area, ρis blood density, v is
blood flow velocity, g is gravitational acceleration, h is liquid column
height, R is vascular resistance, and Q is blood flow [28].
In the cardiovascular system, the formation of blood pressure
requires three basic conditions: a closed circulatory pipeline system
(cardiovascular system), a driving pump (heart), and a resistive pipe
network (vascular system). According to the fluid dynamics analogy
of Ohm’s law, mean arterial pressure (MAP) is jointly determined by
cardiac output (CO) and total peripheral resistance (TPR):

Cardiac output is further expressed as the product of heart rate (HR) and stroke volume (SV):

Frank-Starling Mechanism and Cardiac Pump Function
troke volume is determined by cardiac preload, afterload, and myocardial contractility. The Frank-Starling law describes the relationship between initial myocardial fiber length and contractile force:

Or simplified to a linear relationship:

where EDV is end-diastolic volume, directly related to blood volume; V0 is the theoretical zero volume; and k is the myocardial compliance coefficient [29,30].
Recent multiscale modeling studies have revealed that the Frank-Starling mechanism involves complex interactions between cellular length-dependent activation, ventricular geometry, and cardiovascular system dynamics [31]. This multiscale nature explains why simple linear approximations are valid only within physiological ranges.
The Elastic Cavity Model of Blood Pressure (Windkessel Model)
Model Construction and Differential Equations
The Windkessel model treats large arteries as an elastic chamber, describing the dynamic changes of the blood pressure waveform. The basic assumption of this model is: the compliance (C) of the arterial system stores blood during cardiac ejection and releases it during diastole, maintaining continuous blood flow [32].
The model’s differential equation is:
 where:
• P=arterial blood pressure (mmHg)
• Qin=instantaneous ventricular ejection volume (mL/min)
• R=peripheral resistance (mmHg⋅min/mL)
• C=arterial compliance (mL/mmHg), defined as
where:
• P=arterial blood pressure (mmHg)
• Qin=instantaneous ventricular ejection volume (mL/min)
• R=peripheral resistance (mmHg⋅min/mL)
• C=arterial compliance (mL/mmHg), defined as
 The solution to this equation gives the quantitative relationship
between systolic pressure (SBP), diastolic pressure (DBP), and stroke
volume, resistance, and compliance:
The solution to this equation gives the quantitative relationship
between systolic pressure (SBP), diastolic pressure (DBP), and stroke
volume, resistance, and compliance:
 The time constant
τ = R⋅C determines the decay rate of the pressure waveform, approximately
1.0-1.5 seconds in normal adults [33].
The time constant
τ = R⋅C determines the decay rate of the pressure waveform, approximately
1.0-1.5 seconds in normal adults [33].
Physiological Significance of Arterial Compliance
Arterial compliance reflects the elastic reservoir function of the arterial system and is closely related to age, blood pressure, and vascular wall structure. With age, arterial wall collagen fibers increase, elastic fibers break, leading to decreased compliance (arteriosclerosis), increased systolic pressure and decreased diastolic pressure, and widened pulse pressure [34]. In the state of blood loss, changes in arterial compliance affect the buffering capacity of blood pressure. During hypovolemia, vascular smooth muscle contracts, compliance decreases, blood pressure fluctuation amplitude increases, which enhances stimulation to baroreceptors, triggering compensatory responses [35].
Guyton’s Venous Return Theory and the Blood Volume- Blood Pressure Relationship
Venous Return Curve and Cardiac Function Curve
The core view of Guyton’s theory is: in a steady state, venous return must equal cardiac output. Therefore, the actual blood pressure and cardiac output can be determined by the intersection of the venous return curve and the cardiac function curve [36].
Venous return formula:

where:
MCFP (Mean Circulatory Filling Pressure) = mean systemic filling
pressure
PRA = right atrial pressure
RVR =venous return resistance
MCFP is proportional to blood volume (BV):

Impact of Blood Loss on Venous Return
Acute blood loss leads to a reduction in blood volume ΔBV, and MCFP decreases accordingly:

The venous return curve shifts left and downward, and the intersection with the cardiac function curve moves down, leading to a decrease in cardiac output and blood pressure. However, the body maintains stable blood pressure through a series of compensatory mechanisms (increased heart rate, peripheral vasoconstriction, venous constriction mobilizing unstressed volume) until blood loss exceeds the compensatory limit [38].
Mechanism of Blood Loss’s Impact on Blood Pressure and Mathematical Modeling
Immediate Effects and Compensatory Responses
The process of blood pressure change caused by acute blood loss ΔBVcan be divided into two stages:
Immediate effects (seconds to minutes after blood loss):
Direct reduction in blood volume, decreased venous return, leading to:

Without considering compensation, the blood pressure drop is:

Compensatory responses (minutes to hours after blood loss):
1. Increased heart rate: via baroreceptor reflex, sympathetic excitation, vagal inhibition

2. Increased peripheral resistance: arteriole constriction maintains blood pressure

3. Venous constriction: mobilization of unstressed volume increases venous return

The compensated blood pressure change can be approximated as:

Compensation Limit and Decompensation Threshold
When compensatory mechanisms saturate, blood pressure begins to drop sharply. Let the maximum heart rate increase coefficient be αmax , and the maximum peripheral resistance increase coefficient be βmax . Then the critical blood loss proportion fc satisfies:

For healthy adults, typically fc ≈ 0.15∼0.20 , meaning decompensation occurs when 15-20% of blood volume is lost [39]. This is highly consistent with the Advanced Trauma Life Support (ATLS) classification standard for Class II hemorrhagic shock (blood loss 15- 30%, heart rate 100-120 bpm, blood pressure begins to drop) [40].
Mathematical Formula for Blood Pressure Hazard Threshold Based on Blood Loss Volume
Definition of Basic Hazard Threshold
The blood pressure hazard threshold is defined as: the minimum blood loss volume that, when reached, renders the body’s compensatory capacity unable to maintain blood pressure within a safe range (e.g., MAP drop exceeding 20% or systolic blood pressure <90mmHg).
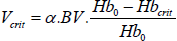
Let the initial blood pressure be P0 , and the allowable maximum blood pressure drop proportion be θ (usually 0.2). Then the critical blood loss volume V_”crit” satisfies:

 = Where K is the comprehensive compensation coefficient,
reflecting the proportion of blood pressure drop per unit blood
loss, determined by the compensation efficiency of heart rate, peripheral
resistance, and stroke volume.
= Where K is the comprehensive compensation coefficient,
reflecting the proportion of blood pressure drop per unit blood
loss, determined by the compensation efficiency of heart rate, peripheral
resistance, and stroke volume.
Corrected Model Considering Chronic Disease Status
Patients with chronic diseases have reduced compensatory capacity, requiring the introduction of a compensation retention coefficient α (0<α≤1):
 Where K0 is the comprehensive compensation
coefficient for healthy individuals.
Where K0 is the comprehensive compensation
coefficient for healthy individuals.
Based on clinical observation and physiological data, the blood loss volume at which blood pressure begins to drop significantly (MAP drop >10%) in healthy adults is approximately 15% of blood volume, i.e.:

Considering individual differences and chronic disease factors, the clinically practical formula is:

BV=blood volume (L), BV=body weight (kg) ×c, c male 0.075, female 0.065
α=chronic disease compensation coefficient (healthy 1.0, mild disease 0.8, moderate disease 0.6, severe disease 0.4) β=age correction coefficient (<60 years 1.0, 60-75 years 0.9, >75 years 0.8)
Formula for Estimating Blood Loss Volume Based on Magnitude of Blood Pressure Drop
If the blood pressure drop ΔPis known, the blood loss volume can be estimated:

where k is the blood pressure-blood loss proportionality coefficient, approximately 0.15-0.20 for healthy individuals.
Based on therapeutic bloodletting, clinically using the absence of significant blood pulsation as a reference, the allowable blood volume loss after blood pressure drops of 10%, 5%, and 1% is calculated respectively: Blood loss (mL) = blood loss proportion x blood volume (L)×1000 Safe bloodletting volume per kg body weight:
• Male:
10% BP drop →11.25mL/kg
5% BP drop →5.625 mL/kg
1%BP drop →1.125 mL/kg
• Female:
10% BP drop→9.75mL/kg
5% BP drop→ 4.875 mL/kg
1% BP drop→ 0.975 mL/kg
Clinical Common Standard
Male, 70kg
Blood volume =70×0.075=5.25 L
BP drop 10%→15%×5.25 L=787.5 mL(decompensation
critical)
BP drop 5%→7.5%×5.25 L=393.75 mL(safe therapeutic)
BP drop 1%→1.5%×5.25 L=78.75 mL(very safe)
Female, 70kg
Blood volume =70×0.065=4.55L
BP drop 10%→15%x4.55L=682.5mL
BP drop 5%→7.5%x4.55L=341.25mL
BP drop 1%→1.5%x4.55L=68.25mL
Conclusion
Taking a 70kg adult as an example:
BP drop 10% → allowable bloodletting approx. 788mL
(male)/683mL (female) (decompensation critical)
BP drop 5% → allowable bloodletting approx. 394mL
(male)/341mL (female) (clinically safe therapeutic range)
BP drop 1% → allowable bloodletting approx. 79mL
(male)/68mL (female) (minimal fluctuation, very safe)
Physiological Functions and Physicochemical Characteristics of Hemoglobin
Molecular Mechanism of Oxygen Transport
Hemoglobin (Hb) is the metalloprotein in red blood cells responsible for oxygen transport. Each Hb molecule contains four heme groups and can reversibly bind four oxygen molecules. The oxygenation process has a synergistic effect, manifesting positive cooperativity: after the first oxygen molecule binds, Hb conformation changes, promoting the binding of subsequent oxygen molecules [41].
The oxygen dissociation curve is S-shaped, mathematically described by the Hill equation:
 where:
• Y=oxygen saturation (0-1)
where:
• Y=oxygen saturation (0-1)
• P=oxygen partial pressure (mmHg)
• P50 =half-saturation oxygen partial pressure (normally approx. 26.6mmHg)
• n = Hill coefficient (approx. 2.7-3.0, reflecting cooperative effect strength)
Recent studies have shown that modified Hill equations with Lorentz or Gauss distributions provide better approximations to experimental oxyhemoglobin dissociation curves, with coefficients of determination ( r2 )exceeding 0.9999 [42].
Carbon Dioxide Transport and Blood Buffering
Hb transports about 20% of CO₂ in the form of carbaminohemoglobin, while binding H⁺ through imidazole groups, maintaining blood pH stability. Hb’s isoelectric point is approximately 6.8; at physiological pH (7.4) it is weakly alkaline and can accept H⁺, making it an important blood buffer pair [43].
Physicochemical Parameters of Hemoglobin
(Table 1).
Table 1:

Key Factors Affecting Hemoglobin Concentration
“Container-Flow” System Model
Hemoglobin concentration is the result of dynamic equilibrium,
influenced by multiple factors: production, destruction, loss, and fluid
volume regulation. From a systems theory perspective, it can be
viewed as a state variable of a “container-flow” system:
 where:
M = Hb ×BV=total hemoglobin mass (g) G=generation rate (g/day) D = physiological destruction rate (g/day) L = blood loss rate (g/day)

Principle of Hemodilution After Acute Blood Loss
Assuming acute blood loss volume is  , pre-bleeding blood
volume is BV, and hemoglobin concentration is Hb0 . At the moment
of blood loss, the lost blood has the same composition as the whole
body’s blood, so the lost hemoglobin mass is
, pre-bleeding blood
volume is BV, and hemoglobin concentration is Hb0 . At the moment
of blood loss, the lost blood has the same composition as the whole
body’s blood, so the lost hemoglobin mass is  .
.
At this time, the remaining hemoglobin mass in the body is
 , and blood volume is also reduced to loss
  , so
the immediate hemoglobin concentration remains unchanged:
, so
the immediate hemoglobin concentration remains unchanged:

However, the body subsequently restores blood volume to the initial
level BV through capillary refill (tissue fluid entering vessels at
approx. 1 mL/kg/h), iatrogenic fluid replacement, and renal sodium
and water retention mechanisms. When blood volume is restored to
the initial level BV, the hemoglobin mass remains  ,
so the new hemoglobin concentration is:
,
so the new hemoglobin concentration is:

Definition of Blood Loss Hazard Threshold Based on Hemoglobin
Physiological Basis of Tissue Oxygen Delivery
Hemoglobin drop leads to a decrease in arterial oxygen content (CaO₂):

Tissue oxygen delivery (DO₂)is the product of cardiac output (CO) and CaO₂:

When Hb decreases, if CO cannot increase accordingly, DO₂ decreases. Healthy individuals can compensate by increasing CO (increased heart rate, increased stroke volume) and oxygen extraction ratio (O₂ER), but there is a limit [44].
It is generally believed that when DO₂ drops below 50% of baseline at rest, tissue hypoxia may occur. The critical Hb value corresponding to this depends on the CO compensation capacity.
Threshold Reference from Clinical Transfusion Guidelines
Clinical transfusion guidelines often use absolute Hb thresholds:
a. General patients: consider transfusion at Hb<70 g/L
b. Cardiovascular disease patients: consider transfusion at Hb<80−100 g/L
c. Elderly: thresholds appropriately raised
These thresholds are based on evidence from large-scale clinical trials (e.g., TRICC trial), balancing transfusion risks and anemia risks [45].
Mathematical Definition of Blood Loss Hazard Threshold
Define the hazard threshold as: the minimum blood loss volume leading to Hb dropping to a certain critical value Hbcrit :

Correction Factor Considering Individual Differences
Introduce a chronic disease index α(0<α≤1) reflecting the patient’s reduced tolerance to anemia:

Clinical hazard thresholds cannot serve as safety thresholds for
therapeutic bloodletting therapy. Clinically, the allowable bloodletting
volume corresponding to each 1g/L~10g/L drop in Hb from the
original concentration needs to be calculated, forming a quantitative
change list to aid clinical analysis. From 0. loss  , the calculation
formula is derived:
, the calculation
formula is derived:

• Vloss: bloodletting volume (L)
• BV: total blood volume (L)
• ΔHb:hemoglobin drop value (g/L)
• Hb0: initial Hb(g/L)
Clinical Common Standard
Male: BV=0.075×body weight (kg)
Female: BV=0.065×body weight (kg)
Most commonly used: 70kg adult
Assume initial Hb=140 g/L(mid-range for healthy adults)
Male, 70kg
Blood volume BV=70×0.075=5.25L
Initial Hb₀=140 g/L
Hb drop per 1~10 g/L →corresponding bloodletting volume (mL)
1. Hb↓1 g/L→37.5 mL
2. Hb↓2 g/L→75 mL
3. Hb ↓3 g/L → 112.5 mL
4. Hb ↓4 g/L → 150 mL
5. Hb ↓5 g/L → 187.5 mL
6. Hb ↓6 g/L → 225 mL
7. Hb ↓7 g/L → 262.5 mL
8. Hb ↓8 g/L → 300 mL
9. Hb ↓9 g/L → 337.5 mL
10. Hb ↓10 g/L → 375 mL
Female, 70kg
Blood volume BV=70×0.065=4.55L
InitialHb₀=140 g/L
Hb drop per 1~10 g/L →corresponding bloodletting volume (mL)
1. Hb ↓1 g/L → 32.5 mL
2. Hb ↓2 g/L → 65 mL
3. Hb ↓3 g/L → 97.5 mL
4. Hb ↓4 g/L → 130 mL
5. Hb ↓5 g/L → 162.5 mL
6. Hb ↓6 g/L → 195 mL
7. Hb ↓7 g/L → 227.5 mL
8. Hb ↓8 g/L → 260 mL
9. Hb ↓9 g/L → 292.5 mL
10. Hb ↓10 g/L → 325 mL
• Conclusion: According to the hemodilution model after acute blood loss, taking a 70kg healthy adult with initial Hb₀=140g/Las an example:
• In therapeutic bloodletting, for each 1g/L drop in Hb, a male can let approx. 37.5mL, female approx. 32.5mL.
• A 5g/L Hb drop corresponds to a safe bloodletting volume of approx. 188mL (male)/163mL (female).
• A 10 g/LHb drop corresponds to a bloodletting volume of approx. 375 mL(male)/ 325 mL(female).
This quantitative relationship can serve as a clinical basis for the individualized and precise application of therapeutic bloodletting, completely avoiding shock hazard thresholds, and is only used for safe, controllable, small-dose bloodletting.
Physiological Function and Regulatory Mechanism of Heart Rate
Core Role of Heart Rate
Heart Rate (HR) is the most fundamental dynamic parameter of the cardiovascular system. Its core functions include:
1. Determining cardiac output: CO=HR×SV; when stroke volume is relatively stable, HR is the primary means of regulating CO.
2. Reflecting autonomic nervous balance: HR is regulated dually by sympathetic nerves (accelerating) and vagus nerves (decelerating).
3. Compensatory response indicator: In circulatory volume changes, increased HR is the earliest compensatory mechanism to appear [46].
Cybernetic Model of Heart Rate Regulation
From a cybernetics perspective, HR can be seen as an output variable influenced by multiple factors:

Linear Relationship Model Between Blood Loss and Heart Rate
Baroreceptor Reflex Mechanism
Blood loss leads to reduced effective circulating blood volume, affecting heart rate through the following pathways:
1. Baroreceptor reflex: Arterial blood pressure drops, afferent impulses from carotid sinus and aortic arch baroreceptors decrease, vagal inhibition, sympathetic excitation, heart rate increases.
2. Volume receptor reflex: Atrial and venous system volume receptors sense decreased venous return, reflexively increasing heart rate.
3. Chemoreceptor reflex: Severe blood loss causes tissue hypoxia, peripheral chemoreceptors are excited, further increasing heart rate [47].
Mathematical Relationship Derivation
Within the compensatory range, the heart rate increase is approximately
linearly related to the blood loss proportion. Let the blood
loss proportion  , then:

Where k is the proportionality coefficient, reflecting individual sensitivity of heart rate response to blood loss. For healthy adults, k is approximately 1.0-1.5 (i.e., 1% blood volume loss leads to approx. 1%-1.5% heart rate increase). This linear relationship originates from the following physiological logic chain:

Safety Bloodletting Volume Formula Based on Stable Heart Rate
Safety Threshold Definition
In therapeutic programs, if heart rate is required to remain stable (i.e., no significant increase), the blood loss volume must be controlled within the range before heart rate begins to increase significantly. Clinically, the fluctuation range of heart rate at rest is approx. ±5 to 20 bpm. Define the safety upper limit as a heart rate increase not exceeding ΔHRsafe = 5 to 20 bpm.
Formula Derivation

Considering the impact of chronic disease on overall compensatory capacity, introduce correction coefficients αand β. Then the safe bloodletting volume is:

Parameter description:
BV: blood volume (L)
• HR0 : baseline heart rate (bpm)
• k: heart rate response coefficient (healthy 1.0-1.2, beta- blocker users 0.5-0.8, heart failure patients 0.5)
• α: chronic disease compensation retention coefficient (healthy 1.0, mild 0.8, moderate 0.6, severe 0.4)
• β: age correction coefficient (<60 years 1.0, 60-75 years 0.9, >75 years 0.8)
• ΔHRsafe : allowable upper limit of heart rate increase (recommended 5 bpm)
Using 70 kg healthy male as unified calculation parameters, derive bloodletting volumes corresponding to heart rate changes of 1%, 5%, 10%, 15%, 20%:
• Gender: male
• Weight: 70 kg
• BV=70×0.075=5.25L
• Baseline heart rate: HR₀=70bpm
• Healthy individual: k=1.0; α=1.0, β=1.0

From formula  , simplified calculation results:
1. Heart rate increase 1% → bloodletting volume 52.5 mL
2. Heart rate increase 5% → 262.5 mL
3. Heart rate increase 10% → 525 mL
4. Heart rate increase 15% → 787.5 mL
5. Heart rate increase 20% → 1050 mL
Clinical recommendations:
1. The proportion of heart rate increase and bloodletting volume are in a perfect linear relationship, consistent with the “unified multi-model” academic logic.
2. Clinical therapeutic bloodletting is recommended to be controlled at heart rate increase ≤1-5%, corresponding to bloodletting ≤262.5mL (70kg male). This range is safe, with no significant palpitations, no significant blood pulsation, and no over-compensation; parameters can also be adjusted based on baseline Hb concentration.
Physiological Significance and Influencing Factors of Blood Oxygen Saturation
Basis of Tissue Oxygen Supply
Blood oxygen saturation ( SpO2or SaO2 ) is the percentage of oxygenated hemoglobin to total hemoglobin in the blood, a core indicator reflecting the body’s oxygenation state. Arterial oxygen content and oxygen delivery are respectively:
Impact of Acute Blood Loss on SpO2
Acute blood loss has a weak direct effect on SpO2, but can affect it indirectly through the following pathways:
1. Decreased cardiac output → reduced pulmonary blood flow → ventilation/perfusion mismatch → SpO2drop (only occurs in severe blood loss)
2. Tissue hypoxia → chemoreceptor excitation → deepened and accelerated respiration → may cause a brief rise in SpO2 (if lung function is normal) Therefore, SpO2 is insensitive to blood loss and is usually a late indicator [48].
Mathematical Relationship Between Blood Oxygen Saturation and Blood Loss Volume
Empirical Linear Model
Establish an empirical linear model:

Where KSpO2 is very small in healthy individuals (0.01-0.05), meaning a 10% blood volume loss results in a 0.1%-0.5% drop in SpO2 . In patients with chronic diseases (e.g., COPD), KSpO2 can be 0.1- 0.2.
Safety and Hazard Threshold Formulas

For healthy individuals, the safety threshold can exceed 50% of blood volume, indicating that SpO2 is extremely insensitive to blood loss and is usually not a limiting factor. However, for patients with respiratory system diseases, close monitoring is required [49].
Physiological Basis and Integration Concept
The human body’s tolerance to blood loss is determined by multiple physiological systems. The characteristics of each indicator are as follows:
• Blood pressure: reflects circulatory volume status
• Heart rate: reflects autonomic nervous compensatory response
• Hemoglobin: reflects oxygen delivery capacity
• Blood oxygen saturation: reflects pulmonary gas exchange function
Quantitative relationships exist between changes in these indicators and blood loss volume, but their sensitivity and time windows differ. Heart rate changes earliest (seconds to minutes), blood pressure changes next (minutes to tens of minutes), hemoglobin changes later (hours to tens of hours), and blood oxygen saturation changes latest (in severe blood loss) [50].
Therefore, the comprehensive safety threshold should take the minimum value of each indicator’s threshold, following the principle of “the most sensitive indicator determines the risk.”
Summary of Safety Threshold Formulas for Each Indicator
(Table 2).
Table 2:

Comprehensive Safety Threshold Formula

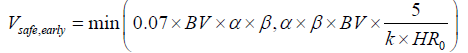
Comprehensive Mathematical Formula Based on Blood Pressure and Heart Rate Changes as Early Rapid Detection Parameters
Blood pressure and heart rate are the most sensitive monitoring indicators for early blood loss. Combining them to build an early rapid detection comprehensive formula for real-time monitoring and immediate assessment during bloodletting:
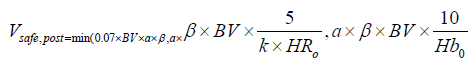
Comprehensive Mathematical Formula Based on Blood Pressure, Heart Rate, and Hemoglobin as Post-Treatment Monitoring Parameters
Hemoglobin is the core indicator of oxygen delivery capacity in the long term after bloodletting. Combined with the short-term compensatory indicators of blood pressure and heart rate, a post-treatment monitoring comprehensive formula is constructed for efficacy assessment and subsequent treatment planning after bloodletting:
Physical Model of Local Stasis
Pathophysiological Nature of Stasis
TCM believes “stasis” (blood stasis) is a pathological state caused by obstructed Qi and blood flow, with blood accumulating locally. Modern research shows the essence of stasis is microcirculation disorder, manifested as:
• Abnormal constriction or dilation of arterioles
• Slowed or stagnant capillary blood flow velocity
• Abnormal hemorheology (increased viscosity, enhanced aggregation)
• Tissue hypoxia and metabolic waste accumulation [51].
Relationship Between Thermographic Parameters and Stasis Degree
Infrared thermography can quantify local microcirculation status. Core parameters are:
• Abnormal temperature area A (cm²): reflects the spatial extent of stasis
• Average temperature difference ΔT(°C) compared to the contralateral or surrounding normal tissue: reflects the degree of microcirculation disorder
Studies show that the temperature difference ΔTis positively correlated with the degree of local blood perfusion abnormality. The thermographic stasis index is defined as:

Equivalent Volume Estimation of Stagnant Blood
Assuming the stasis area in subcutaneous tissue approximates a uniform-thickness thin layer with physical thickness h (cm), obtainable via ultrasound measurement or anatomical site empirical values. Since not all tissue in the stasis area is blood, the actual blood volume fraction participating in stasis is ϕ(usually 0.3-0.5). The equivalent volume of stagnant blood is:

Derivation of Local Bloodletting Volume Formula
Bloodletting Coefficient K per Unit Area-Temperature Difference Introduce the unit area-temperature difference bloodletting coefficient K (mL·cm⁻²·℃⁻¹), defined as:

where:
• β = drainage proportion coefficient (mild stasis 0.1, moderate 0.2, severe 0.3)
• heff =φ ⋅ h = stasis equivalent thickness (cm)
Physical meaning of K: the blood volume (mL) that needs to be let out per unit stasis area (1cm²) and per unit temperature difference (1℃).
Common site K value reference (based on anatomical thickness and volume fraction estimation): (Table 3).
TCM Syndrome Differentiation Correction Coefficient α_local TCM emphasizes treatment based on syndrome differentiation. The nature of stasis and therapeutic response differ among syndrome patterns. Therefore, introduce the TCM Syndrome Differentiation Correction Coefficient α_local to achieve individualized local bloodletting volume adjustment. Specific values are as follows: (Table 4).
Table 3:

Table 4:

Local Bloodletting Volume Formula
Combining the TCM Syndrome Differentiation Correction Coefficient, unit area-temperature difference bloodletting coefficient, and stasis area and temperature difference detected by infrared thermography, derive the core local bloodletting volume formula:

This formula achieves the integration of TCM syndrome differentiation with modern thermographic quantification technology, precisely matching the bloodletting demand to the local stasis degree.
Integration of Systemic Safety Threshold
Bloodletting therapy must balance local stasis clearance with systemic physiological homeostasis. Therefore, on the basis of local bloodletting volume, systemic indicators such as blood pressure, heart rate, and hemoglobin are integrated to construct the systemic safety threshold formula, ensuring no significant abnormality in systemic physiological state during bloodletting:

where:
α_systemic: systemic chronic disease compensation coefficient (same as blood pressure model, healthy 1.0, mild disease 0.8, moderate 0.6, severe 0.4);
β age: age correction coefficient (<60 years 1.0, 60-75 years 0.9, >75 years 0.8);
ΔHbsafe: safe hemoglobin drop value, clinically recommended ⩽10 g/L.
Final Comprehensive Bloodletting Volume Formula
The actual bloodletting volume for a single bloodletting treatment must take the minimum of local stasis demand, systemic physiological safety, and also set an absolute upper limit of 10 mL (based on the conventional safe dose for clinical bloodletting). Finally, the individualized comprehensive bloodletting volume formula is obtained:
Clinical supplementary principle: If local demand exceeds the systemic safety threshold, treatment should be divided into sessions, each not exceeding , with treatment intervals of 3-7 days, until infrared thermography shows significant improvement in local stasis.
Comparative Validation with Classic Literature and Clinical Data
The safety threshold model for bloodletting therapy constructed in this study, through comparative validation with classic physiological theories and clinical diagnostic and treatment norms, confirms the model’s scientificity and rationality.
Comparison with Guyton Physiology
Guyton’s classic circulatory physiology textbook states: 10% blood volume loss, blood pressure can be maintained; 20% blood loss, blood pressure begins to drop; 30% blood loss, shock occurs [53]. The blood pressure hazard threshold for healthy adults derived in this model,  (15% blood volume), and safety threshold  (7% blood volume), are highly consistent with Guyton’s theory. Moreover, the model provides refined classification of bloodletting volume into safe-critical-hazardous, better fitting clinical treatment needs.
Comparison with Blood Donation Medicine
Clinical voluntary blood donation standards are 400-500 mL per donation (approx. 8%-10% of a healthy adult’s blood volume). Most donors show no significant blood pressure or heart rate fluctuation; a few experience dizziness and other mild discomfort. This dose falls within the safety threshold range (7% BV) of this model.
Simultaneously, hemoglobin typically drops 10-15 g/L after donation, consistent with the prediction of the linear relationship between hemoglobin drop and blood loss volume in this model [54].
Comparison with Therapeutic Phlebotomy
Clinical therapeutic phlebotomy for polycythemia vera is usually 300-500 mL per session, with intervals ranging from days to weeks, targeting hematocrit (Hct) <45% [55].
This model calculates for a healthy individual (Hb₀=150 g/L, target Hb=130 g/L):

For a 70kg male (BV=5.25L), V≈700mL, divided into 2 sessions, 350 mL each, consistent with clinical practice, validating the model’s clinical applicability.
Calculation Examples and Clinical Decision Support
To intuitively demonstrate the model’s clinical application method, using a healthy adult and an elderly chronic disease patient as cases, the safe dose for a single bloodletting session is completely calculated, and clinical decision advice is given.
• Example 1: Healthy Adult Bloodletting
Patient info: 30-year-old male, 75kg, no underlying disease, local stasis in waist/back (infrared thermography: A=50 cm², ΔT=1.2℃), TCM syndrome differentiation: Qi Stagnation Blood Stasis.
Basic parameters: BV = 0.075×75 = 5.63, HR0 = 65bpm , 0 Hb =150 g/L, k =1.1, αlocal=1.0,K=0.064(mid-range K value for waist/back), αsystemic=1.0, βage=1.0.
Step-by-step calculation:
1. Local bloodletting volume: Vlocal=1.0×0.064×50×1.2=3.84 mL 2. Systemic safety threshold:
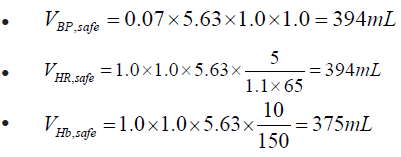

Final bloodletting volume: V=min(3.84,375,10)=3.84 mL. Clinical decision: Select 2 stasis acupoints on the waist/back, let approx. 2mL per point. No need to monitor systemic vital signs; observe local bleeding post-procedure.
• Example 2: Elderly Chronic Disease Patient Bloodletting Patient info: 70-year-old female, 60kg, coronary heart disease, hypertension (mild chronic disease compensation).
Basic parameters: BV=0.065×60=3.9 L, HR0 = 72bpm ,
HR0 =130g / L , k=1.0, α=0.7, β=0.9.
Waist/back stasis: A=80 cm²,ΔT =1.50C ,Syndrome pattern: Qi Deficiency Blood Stasis (αlocal=0.6)
Step-by-step calculation:

Final bloodletting volume: V = min (4.6,171,10) = 4.6mL Clinical decision: Select 2 Back-Shu points, let 2-3mL per point, strictly monitor vital signs.
Limitations of the Model and Future Research Directions
Although the safety threshold model for bloodletting therapy constructed in this study achieves “local-systemic” quantitative monitoring, it still has certain limitations. Subsequent improvements are needed from theoretical, methodological, and clinical dimensions.
“Incommensurability” of Theoretical Frameworks
TCM “stasis” and modern medicine “microcirculation disorder” have overlaps but are not equivalent. TCM emphasizes the dynamic “state” of Qi and blood flow, while Western medicine focuses on static “accumulation.” This model quantifies TCM “stasis” as thermographic parameters, potentially neglecting intangible stasis like Qi mechanism stagnation [56].
Limitations of Linear Assumptions
In reality, the relationship between stasis degree and bloodletting volume may be nonlinear: mild stasis may be cleared with a small amount, severe stasis may have a “threshold effect”—beyond a certain amount, efficacy no longer increases, instead damaging healthy Qi [57].
Individual Differences and Dynamic Changes
Model parameters (k, α, β) need calibration through clinical experience and cannot be precisely unified. Future research should conduct multicenter real-world studies, use machine learning for dynamic model optimization, and establish a “learning-type” clinical decision support system [58].
Lack of “Healthy Qi” Assessment
The model does not sufficiently incorporate TCM indicators of internal injury to healthy Qi like “Qi following blood loss” and “injuring Yin consuming fluids.” Future research should establish a “Healthy Qi” multidimensional scale (Qi deficiency, blood deficiency, Yin deficiency, Yang deficiency) to expand the safety threshold system.
This study, based on principles of fluid dynamics, hemodynamics, cybernetics, and systems biology, constructed a multiparameter mathematical-physical model for the safety thresholds of bloodletting therapy. Main contributions include:
1. Established a mathematical model of the blood pressure-
blood volume relationship, derived the hazard threshold formula
 , highly consistent with Guyton physiology
and ATLS shock classification.
, highly consistent with Guyton physiology
and ATLS shock classification.
2. Constructed a hemoglobin dynamic change model, proposed
an individualized threshold based on oxygen delivery theory
3. Integrated compensatory indicators like heart rate and
blood oxygen saturation, established a multiparameter comprehensive
safety threshold system 
4. Innovatively introduced infrared thermography technology,
proposed the local stasis quantification formula  , achieving objectification of TCM syndrome differentiation.
5. Constructed a “local-systemic” dual-layer safety monitoring
model  , providing quantifiable, reproducible,
and verifiable scientific standards for bloodletting therapy.
, providing quantifiable, reproducible,
and verifiable scientific standards for bloodletting therapy.
This model marks an important transition of bloodletting therapy from “empirical medicine” to “precision medicine,” with demonstrative significance for the modernization of TCM external therapies.
Future research should focus on: conducting large-scale multicenter clinical trials to validate model effectiveness; establishing a “Healthy Qi” assessment system to improve safety standards; developing intelligent decision support systems for dynamic optimization; exploring the modern biological essence of “stasis” to deepen theoretical understanding.
All authors participated in research design, mathematical derivation, literature analysis, and paper writing.
Authors declare no conflicts of interest.
This study is theoretical modeling research, not involving human trials, but the proposed formulas require clinical validation before application.


