info@biomedres.us
+1 (502) 904-2126
One Westbrook Corporate Center, Suite 300, Westchester, IL 60154, USA
Site Map
Received: February 25, 2026; Published: March 09, 2026
*Corresponding author: Mukul Das, Analytical Bio-Science Division, Shriram Institute for Industrial Research, 19, University Road, North Campus, Delhi - 110007, India; Email:mukuldas@shriraminstitute.org
DOI: 10.26717/BJSTR.2026.65.010127
Ayurvedic medicines are being used in India for different diseases. These medicines need to be ensured that they are free from allopathic medicines. In this communication a simple, accurate, economical, faster and greener analysis compared to conventional methods has been developed for quantitative estimation of metformin hydrochloride in Ayurvedic medicines. The developed HPLC method is an isocratic phase chromatographic method using ammonia phosphate buffer: acetonitrile (95:5), pH adjusted to 2.80 with o-phosphoric acid and the linearity was observed in concentration range of 3.5-10.5 μg/ml for Metformin hydrochloride. Prior to quantification, detection of Metformin in Ayurvedic sample was carried out by FTIR. The FTIR spectra of Ayurvedic sample showed vibrations at 740, 935, 1063, 1075, 1580 and 1620 cm-1, which are exactly similar to that of standard Metformin, confirming the adulteration of Metformin in Ayurvedic samples. To quantify the content of Metformin in Ayurvedic samples the HPLC analysis showed the linear regression coefficient for Metformin to be 0.9995, while precision was found to be acceptable and accurate with a recovery of 99-101%. Limit of Detection (LOD) for Metformin was found to be 0.013 ppm while Limit of Quantification (LOQ) was found to be 0.040 ppm. Further, the developed method was applied on six different Ayurvedic samples which showed the presence of Metformin to an extent of 15-27%. This simple HPLC technique is very useful for the quantitative detection for adulteration of Metformin in Ayurvedic samples.
Keywords: Ayurvedic Medicine; Metformin Hydrochloride; HPLC; Method Validation
Abbreviations: LOD: Limit of Detection; LOQ: Limit of Quantification; NIH: National Institute of Health; PCOS: Polycystic Ovary Syndrome; FTIR: Fourier Transform Infrared Spectroscopy; HPLC: High Performance Liquid Chromatography; IR: infrared; RT: Retention Time; SST: System Suitability Testing; RSD: Relative Standard Deviation
Ayurvedic medicines have been used in India for the past hundreds of years [1]. Even the National Institute of Health (NIH), USA has recognized the Ayurvedic system as an alternative and complementary medicine to Allopathy. During the past several years Ayurvedic herbs have been investigated for the active chemical ingredients along with their pharmacological efficacy and safety [1]. It is to be noted that in India, the same food and drug regulations not only apply to conventional pharmaceuticals but also to the Ayurvedic pharmaceuticals [2]. In spite of having strict regulations, unscrupulous traders find their own way of making an adulterated product, may it be related to food or drug [3-5]. Concurrent use of prescribed metformin and products containing undeclared metformin could result in inadvertent exposure to excessive cumulative doses in the absence of any medical guidance. Having this in mind, it was conceived that Ayurvedic medicine that is being given to diabetic or pre-diabetic patients, should be free from any allopathic medicine including Metformin (Figure 1) and should have sugar depleting activity due to Ayurvedic herbs.
Figure 1

The antidiabetic allopathic medication, Metformin HCl is categorised as an anti-hyperglycemic agent [6,7]. It lowers triglyceride and low-density lipoprotein cholesterol levels and is also used to treat Polycystic Ovary Syndrome (PCOS) [8]. The anti-diabetic property has been identified by decreasing hepatic glucose synthesis thereby causing enhanced glucose absorption and also prevents cardiovascular system problems. Also, the uncertainty surrounding metformin use in people with prediabetes, questions whether it offers a genuine preventive benefit or constitutes unnecessary overtreatment in delaying progression to Type 2 diabetes [9]. The Indian and US pharmacopoeias only mention UV and potentiometric techniques for estimating Metformin HCl for allopathic drugs [5,6,10]. However, these techniques are not sensitive to determine Metformin HCl in Ayurvedic medicine. Many more studies have shown that Metformin can also be measured by HPTLC [11], HPLC [12-14], UV [15,16] and LC-MS/MS [17] methods in Allopathic drugs. All these studies are related to estimation of Metformin in allopathic drugs but not in Ayurvedic medicine.
Only some published work is however found for estimation of Metformin in ayurvedic or other natural anti-diabetic herbal products. Some of them involve LC-MS/MS in MRM mode as an analytical technique [18], screening method using HPTLC & FTIR [19] and detection using color test, TLC & FTIR analysis [20].
Since none of the methods were based on HPLC as an instrumental technique, therefore in the present investigation a new extraction – cum – HPLC technique was developed to quantify the amount of Metformin HCl in Ayurvedic samples. This HPLC method was assessed for a number of characteristics, including linearity, sensitivity, LOD, LOQ, accuracy, precision & selectivity, and finally, the method was used to quantify Metformin HCl in Ayurvedic samples. The proposed study also involves FTIR Spectrophotometer as a qualitative cum confirmatory analytical technique for identification & confirmation of metformin HCl in ayurvedic samples.
Reagents and Materials
Monobasic Ammonium phosphate from Loba Chemie Pvt Ltd., Mumbai, India; Acetonitrile from J.T. Baker Chemical Pvt Ltd, Mumbai, India; CRM (Certified Reference Material) of Metformin Hydrochloride Standard with a Purity of 99.6% from Asian Research Foundation, Delhi, India; HPLC grade Methanol from SDFCL; IR grade Potassium Bromide from Merck and Ultrapure water produced from Milli-Q Water Purification System of Merck Life Science Pvt Ltd.
Instrumentation
FTIR (Fourier Transform Infrared Spectroscopy): Model IR Affinity 1S from Shimadzu, Kyoto, Japan with Lab solution software and in-built library database for pharmaceutical and others was used for the study. The unit achieves this level of sensitivity by using a high-energy ceramic light source; temperature-controlled, high-sensitivity DLATGS detector; and high-throughput optical elements. Also, the IRAffinity-1 includes optimized electrical and optical systems to minimize noise levels. The optical system spectral range of 4000 – 350 cm-1 with KBr windows data and resolution of 0.5 cm-1 detected all the frequencies simultaneously at higher speed. The fast scans enable the co-addition of multiple scans to lower the random measurement noise level, and the detectors are highly sensitive with lower noise levels. This instrument is suitable for background subtraction.
High Performance Liquid Chromatography (HPLC): The present investigation employed a liquid chromatographic system that included a Shimadzu LC - 50 gradient pump, a model SPD- 50 with auto sampler, and a UV detector. Column used in this study is: USP - L9 (cation exchange), Agilent Zorbax 300-SCX A, Dimension: Length -150 mm, width- 4.6 mm, particle size- 5 μm.
Sample & Standard Preparation
For FTIR analysis
Metformin Standard Pellet: With precautions to prevent moisture absorption, Potassium Bromide (KBr) was dried in an oven before analysis. Accurately weighed 1 mg of Metformin HCl standard was weighed with 100 mg of KBr. It was then ground gently but thoroughly in an agate mortar until a fine, homogeneous mixture was obtained to make a pellet.
Sample Pellet: A sample solution of about 3 % was prepared in methanol by diluting 3g of weighed ayurvedic sample to 100 ml of Methanol, which was first sonicated for 5 minutes and later on filtered using Whatman No. 41 filter paper. The obtained filtrate was then dried in an oven at 100 ⁰ⁱC, to obtain a dried mass of sample. The prepared dried sample was scratched out of the moisture dish and weighed in accordance with section 5.3.1.1. to make a sample pellet. For HPLC Analysis: Taking Green analytical chemistry principles forward by using solvent free diluent, Milli-Q water was used for both standard and sample preparation. Milli-Q water when compared with methanol which is widely used as diluent for Metformin analysis, was found to be appropriate as a diluent, based on HPLC baseline response with a very low UV cut-off of 190 nm and good solubility for polar compound of Metformin HCl [21].
Standard of Metformin HCl
5 milligram of Metformin hydrochloride CRM was accurately weighed and transferred in a 100 ml calibrated volumetric flask, in which further 20 ml of Milli-Q water was also added. This solution was sonicated for 10 minutes at 25°C to dissolve Metformin hydrochloride reference standard completely. Volume was made up of this solution to 100 ml using Milli-Q water. It was then gently mixed and filtered through a 0.45 μm nylon filter and stored as Metformin standard stock solution having a concentration of 50 ppm.
• Calibration Standard Solution of Metformin HCl: Calibration standards for linearity at concentration levels of 3.5, 5.0, 7.0, 8.5 and 10.5 μg/ml were prepared from stock standard of 50 μg/ml, by adding an aliquot of 0.7, 1.0, 1.4, 1.7 and 2.1 ml in 10 ml volumetric flask each and diluting with Milli-Q water, to make respective solutions of Metformin HCl.
Sample Solution Preparation: Accurately weighed 1 gram of Ayurvedic medicine sample (in powder form) was transferred to a 200 ml calibrated volumetric flask and 50 ml of Milli-Q water was added to it. It was then sonicated for 20 minutes at 25°C to aid in dissolution of Metformin present in the Ayurvedic medicine sample and then made up to 200 ml of volume with Milli-Q water. The solution was then mixed gently and filtered through a 0.45 μm nylon filter. This obtained solution serves as an Ayurvedic medicine sample stock solution. An aliquot of 5.0 ml of the stock sample solution prepared above was pipetted into a 100 ml volumetric flask and then diluted with Milli-Q water to the appropriate level. It was again mixed gently and filtered through a 0.45 μm nylon filter.
FTIR Studies
The FTIR technique is shown to be successfully established for quantification of Metformin HCl with effective calibration models and satisfactory accuracy and reproducibility in pharmaceutical formulations [22,23]. The FTIR instrument in this work is employed not only for qualitative analysis of Metformin HCl in ayurvedic samples but also as confirmatory analysis for presence of Metformin HCl based on its distinct spectra and matching with simultaneous run CRM of Metformin HCl. Also, FTIR is having advantage over HPLC & other instruments in terms of selective identification & confirmation based on functional group pertaining to its chemical structure and is also greener technology than HPLC, with respect to solvent consumption. Using a wavenumber range of 2000 to 400 cm−1, an average of 25 scans with a resolution of 4 cm−1 were run to evaluate the sample spectra by averaging scans of 25 runs. The peak positions were picked with Lab solutions operating software using an appropriate ‘Threshold’ and ‘Noise level’. The FTIR (Fourier Transform Infrared) spectrum of Metformin hydrochloride is indicated in Figure 2.
Figure 2

It was observed that the different peaks in the FTIR spectra of the positive Ayurvedic sample resembled those of standard Metformin HCl. The reference standard of Metformin HCl was found to be free of contaminants as validated by the results. The wavenumber at 740, 935, 1063, 1075, 1580, and 1620 cm-1 are observed in the reference standard of Metformin HCl in the infrared (IR) scan. The wave number 740 and 935 cm-1 refers for N-H wagging vibrations, 1063 and 1075 cm-1 for C-N stretch vibration, 1582 and 1620 cm-1 for C=N stretch vibrations, while the C-N stretching vibration is typically found in the 1500-1000 cm-1 range. The positive Ayurvedic sample IR results showed similar spectra when compared to the reference standard of Metformin HCl (Figure 2) confirming the presence of Metformin in Ayurvedic sample. The duplicates of each sample were performed in FTIR (data not shown here) and a representative sample with control is depicted in (Figure 2).
HPLC Method Development
After conducting qualitative detection of Metformin in Ayurvedic samples using FTIR, it was essential to quantify the accurate levels of Metformin in Ayurvedic samples. Hence, the HPLC method validation was performed for Metformin in Ayurvedic samples. HPLC is selected as an analytical technique for quantification of metformin in the present study based on its working range in concentration, detection limits, wider accessibility across laboratories over other instruments like HPTLC and LC-MS/MS and adoption of green chemistry principles. Greenness assessment principles indicate that though HPLC methods are environmentally benign, there is space for improvement in terms of lowering the usage of harmful solvents and waste production [24]. A critical review by Mohan et al. underscores the necessity for more sustainable analytical practices in greener quantification of metformin and charts a course for future research to develop eco-friendly and efficient methods for pharmaceutical quality control [25]. HPLC scores better since it necessitates the least amount of solvent, requires less time for analysis, has a lower energy consumption, and results in reduced costs of running [26]. For this, HPLC chromatographic conditions were optimized for the present study and finalized to as described in Table 1. Figure 3 shows the chromatogram of standard Metformin and the Ayurvedic sample with a Retention Time (RT) of 2.8 minutes.
Figure 3

Table 1: Chromatographic conditions used for analysis.

Method Validation
The linearity, precision, accuracy, LOD, LOQ, specificity, and robustness of the developed method were tested in accordance with ICH recommendations Q2 (R1) [27], as detailed below.
Specificity: The prepared solutions i.e. Blank (Milli-Q water), Metformin HCl Standard solution of lowest calibration standard concentration i.e. 3.5 μg/ml and Ayurvedic sample solution prepared as per method detailed in section 2.4, were all injected into the HPLC. All the chromatograms with Metformin show a peak at retention time of 2.8 minutes. Table 2 displays the results showing that there is no principal peak in blank solution occurring at the same retention time, when compared to principal peak obtained in Metformin HCl standard solution.
Table 2 Specificity studies.

Limit of Detection and Limit of Quantification: Limit of Detection (LOD) is expressed as a concentration that gives a signal to noise ratio of 3:1 and Limit of Quantitation (LOQ) is expressed as a concentration that gives a signal to noise 10:1. LOD and LOQ are terms used to describe the minimum concentration of a substance that is reliably detected and quantified. LOD and LOQ is calculated using following formula:
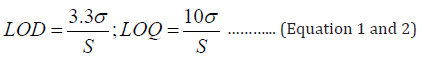
Where S and σ are slope and standard deviation, respectively.
The values for LOD & LOQ were derived using linear regression with Analysis ToolPak. The plotted chart for linear regression is given in Figure 4 and Table 3. LOD of Metformin was found to be 0.013 ppm and LOQ of Metformin was found to be 0.040 ppm. The details of calculation for LOD and LOQ through regression statistics is provided in supplementary data.
Table 3 Plot for Linear regression for Limit of Detection and Quantification of Metformin (By HPLC).

Figure 4

Precision: Repeatability of the developed methodology is assessed with two levels of precision including System precision using standard solution and Method precision using prepared sample solutions, based on single laboratory validation study.
System Precision: System Precision, also referred to as system suitability testing (SST) is a crucial validation parameter that ensures reliable performance of an instrument (in this case, HPLC) which will serve as foundation for establishing the analytical procedure, fit for the intended purpose by not introducing any unacceptable variability. It was performed using six replicate injections of Metformin HCl standard stock solution with a concentration of 50 μg/ml. Six replicate injection average areas of Metformin HCl standard and percentage of relative standard deviation (%RSD) results are mentioned in Table 4.
Table 4 Precision of Metformin peak at a particular concentration.

Method Precision: Method precision was performed using the same Ayurvedic sample with six repeated experiments at 100% of test concentration, results for which are mentioned in Table 5 showing Metformin value ranging from 15.82 to 15.90 % with a RSD of 0.2% which falls well within the acceptable values.
Table 5 Method precision of Metformin peak in Ayurvedic sample.


Linearity: According to ICH guidelines, the linearity curve was constructed using five different concentrations of Metformin. The different calibration standards of concentrations from 3.5, 5.0, 7.0, 8.5 and 10.5 μg/ml were run on HPLC, as prepared from the stock solution (Section 2.3.2) covering from 50% to 150% of concentration targeted. The peak area of Metformin was considered for plotting the linearity graph as shown in Table 6 and Figure 5, which showed a good linear response with acceptable correlation coefficient, r2 of 0.9993.
Figure 5

Table 6 Method precision of Metformin peak in Ayurvedic sample.


Accuracy: Accuracy was carried out using three different concentrations of Ayurvedic samples i.e. 50%, 100% and 150% levels and recovery was calculated against Metformin HCl standard of 50 μg/ml, in accordance with ICH guidelines. In this case, recovery was found to be 99 -101 % which is within the limits of 80 to 120% as shown in Table 7.
Table 7 Accuracy of Metformin estimation with respect to different concentration.


Case Study
Various Ayurvedic samples were analysed for the quantification of Metformin HCl content. The samples were marked as product A, B, C, D, E, F. Results in Table 8 showed that the six Ayurvedic preparations have varying degrees of adulteration of Metformin (15.07- 27.43%). Metformin HCl is the primary Allopathic drug to treat diabetes (Type 2). The medicine is also used to treat polycystic ovary syndrome (PCOS) and is well tolerated for adverse effects including diarrhoea, nausea and abdominal pain. The mechanism(s) of action of Metformin is through decreased glucose production in the liver, or by increased insulin sensitivity, or by increased GDF15 secretion that leads to reduction in appetite and calorie intake [28]. Metformin is a biguanide derivative, known to possess antihyperglycemic activity because it does not normally cause hypoglycaemia. Nowadays, various Ayurvedic medicines are available in the market which are used for the treatment of diabetes. These Ayurvedic medicines are sometimes adulterated by addition of allopathic medicines such as Metformin HCl to increase the efficacy and quick response.
Table 8 Quantitative analysis of Metformin in Ayurvedic products.


This kind of treatment by adulterated Ayurvedic medicine to patients who are already consuming allopathic medicine may adversely affect the glucose metabolism in the body that may result in hypoglycaemia like condition. Thus, an efficient method is developed to determine and quantify Metformin HCl content in Ayurvedic formulation. The qualitative determination of Metformin has been optimized by FTIR and quantitative analysis by HPLC with method validation including Precision, Accuracy, Linearity, LOD & LOQ. Finally, the developed method was applied on 6 Ayurvedic samples showing different concentrations of Metformin (15.07% to 27.43%) by HPLC method and found positive with FTIR analysis, thus, suggesting the applicability of the method.
Reproducibility
The six samples of Ayurvedic preparation that were analysed (Table 8) were further analysed by different analysts on different days. The results showed that the degree of adulteration of Metformin in Ayurvedic samples ranged from (15.60 - 27.70 %) (Table 9). These results are in close proximity to the data presented in Table 8 (15.07 - 27.43 %), suggesting the reproducibility and accuracy of the method.
Table 9 Reproducibility Quantitative analysis of Metformin in Ayurvedic products.


The developed HPLC method can determine Metformin HCl content in all Ayurvedic medicine because of a good separation of chromatographic peaks with optimum retention time of 2.8 minutes. The proposed method offers improved sensitivity, selectivity, higher throughput, lower solvent consumption, accurate, precise, simple, reproducible, economical and based on the principles of green chemistry for the quantification of Metformin HCl in Ayurvedic preparation. The confirmation of the presence of Metformin HCl in Ayurvedic sample was also carried out by FTIR by comparing with the spectra of reference standard Metformin HCl. These findings highlight the need for stricter quality control measures for Ayurvedic medicine to protect public health. The developed method can be a valuable tool for regulatory agencies to monitor the quality and safety of Ayurvedic products. Manufacturers can use this method for routine quality control to ensure the absence of adulterants in their products.
Authors wish to thank the management of Shriram Institute for Industrial Research, Delhi for providing necessary infrastructure for undertaking the research work presented here. The manuscript is SRI communication # SRI-MS#20250107-01.
Authors state that there is no conflict of interest
PKT- experimental work & writing, MR- planning & experimental work, NG- experimental work (FTIR) & writing, MD- Conceptualizing, planning, guiding, writing & editing.


