info@biomedres.us
+1 (502) 904-2126
One Westbrook Corporate Center, Suite 300, Westchester, IL 60154, USA
Site Map
Received: May 29, 2025; Published: November 26, 2025
*Corresponding author: Ying Zhou, Department of Pharmacy, Peking University First Hospital, Beijing 100050 China
Zhenming Liu, School of Pharmaceutical Sciences, Peking University, Beijing 100191, China
DOI: 10.26717/BJSTR.2025.64.009979
Purpose: To extract potential drug combinations from the FAERS (FDA Adverse Event Reporting System) database
that may increase the risk of acute kidney injury and establish a predictive model to determine whether a
combination of two small-molecule drugs is likely to increase the risk of acute kidney injury.
Method: Data from the FAERS database, spanning from the first quarter of 2014 to the fourth quarter of 2024,
was selected. This data was combined with drug information from the DrugBank database and underwent standardized
cleaning to remove duplicate information and match DrugBank IDs. The disproportionality analyze
was employed to identify potential drug combinations that could increase the risk of acute kidney injury. Subsequently,
on this set of combination data, a predictive model for acute kidney injury risk was established. This
was done by using an Extended Connectivity Fingerprint (ECFP) with 1024 bits to represent drug molecules for
training.
Conclusion: In this study, we employed the reporting odds ratio method to identify 6,869 potential drug combinations
that may increase the risk of acute kidney injury. We constructed and trained a structure-based deep
neural network predictive model, which demonstrated favourable performance under a five-fold cross-validation.
This literature review has identified obstacles across four primary domains: operational, technological, security and ethical. By identifying and understanding the obstacles that hinder the effective integration of AI in healthcare, leaders in the field will be more prepared to tackle these issues and adopt reliable AI technologies to improve patient care and the healthcare system as a whole. Therefore, it is essential to advance comprehensive and well-informed HTAs in the appraisal of ΑΙ systems to guarantee transparency and thoroughness of healthcare systems.
Keywords: Acute Kidney Injury; Drug-Induced Kidney Injury; Prediction Model; Drug Combinations; FAERS
Abbreviations: FDA: Food and Drug Administration; FAERS: FDA Adverse Event Reporting System; ECFP: Extended Connectivity Fingerprint; AKI: Acute Kidney Injury; NSAIDs: Non-Steroidal Anti-Inflammatory Drugs; OHDSI: Observational Health Data Sciences and Informatics; IMEDS: Innovation in Medical Evidence Development and Surveillance; OMOP: Observational Medical Outcomes Partnership; CDM: Common Data Model; ROR: Reporting Odds Ratio; PRR: Proportional Reporting Ratio; BCPNN: Bayesian Confidence Propagation Neural Network; QSAR: Quantitative Structure-Activity Relationship
Acute Kidney Injury (AKI) is a clinically common syndrome, with an incidence of nearly 23% among hospitalized patients and as high as 60% among critically ill patients [1], Globally, approximately 13 million people suffer from acute kidney injury each year, and about 1.7 million individuals die due to acute kidney injury and its complication [2,3]. One significant risk factor for acute kidney injury is the use of nephrotoxic drugs, which is associated with 60% of cases of acute kidney injury [4]. Some commonly used drugs associated with acute kidney injury include furosemide, metformin, vancomycin, and non-steroidal anti-inflammatory drugs (NSAIDs) [5-7]. Hospitalized patients, especially those in critical condition, often receive multiple drug treatments, and a quarter of these drugs have potential nephrotoxicity [8]. In cases of hospital-acquired acute kidney injury, patients may be exposed to multiple nephrotoxic drugs, which can cause kidney damage through various mechanism [9]. Complex drug regimens are more likely to increase the risk of acute kidney injury.
A systematic review highlighted the lack of adequate research and reliable evidence to confirm the association between drug combinations and the development of acute kidney injury, emphasizing the need for further research on drug combinations related to acute kidney injury [10]. Currently, there is very limited evidence regarding drug combinations that can cause acute kidney injury. Therefore, this study aims to explore potential drug combinations that may increase the risk of acute kidney injury using the Food and Drug Administration (FDA) Adverse Event Reporting System (FAERS) database through an imbalanced ratio approach. This research aims to provide reference and evidence support for clinical studies. Based on the data and results obtained from the exploration of drug combinations involving interactions, a predictive model using deep learning methods will be constructed to predict whether a combination of two small-molecule drugs increases the risk of acute kidney injury.
Database
The FAERS (FDA Adverse Event Reporting System) database contains information on adverse drug reactions and medication error events collected by the FDA [11]. FAERS is primarily used for post-market safety surveillance of drugs and biologics and is also widely used for mining drug interactions. The FDA’s FAERS database is updated quarterly, and each quarterly dataset includes seven tables:
i. DEMO table: Records personal information about patients.
ii. REAC table: Records adverse reactions reported in the events.
iii. DRUG table: Records information about the drugs used by patients.
iv. RPSR table: Records information about the source of the reports.
v. THER table: Records the start and end times of drug treatment for patients.
vi. INDI table: Records indications for drugs.
vii. OUTC table: Records the treatment outcomes for patients.
The data used in this study is from the FAERS database, spanning from the first quarter of 2014 to the fourth quarter of 2024. The primary tables utilized for this study are the DRUG table and the REAC table.
The DrugBank database is a comprehensive, freely accessible online repository of drug information, organized on a per-drug basis, encompassing details about drugs and drug target [12]. As a resource in the fields of bioinformatics and chemoinformatics, DrugBank combines detailed drug data, including chemical, pharmacological, and pharmaceutical information, with comprehensive drug target information, including sequences, structures, and pathways. In this study, version 5.1.7 of the DrugBank database was utilized. From this version, the following drug attributes were extracted: Generic Nam, Synonym, External ID, Salt, Brand, Produc, and Mixture. Observational Health Data Sciences and Informatics (OHDSI) is a global non-profit research organization supported by the FDA’s Innovation in Medical Evidence Development and Surveillance (IMEDS) program and the Reagan-Udall Foundation. Led by Columbia University and involving experts from various interdisciplinary fields, OHDSI conducts collaborative research with the aim of advancing the value of clinical healthcare data through large-scale data analysis and mining. It serves as a worldwide philanthropic research alliance, focusing on open-source solutions for comprehensive medical big data analysis.
The organization’s goal is to facilitate interdisciplinary and cross-industry collaboration. OHDSI’s mission is to build upon and expand upon the core research achievements of the previous Observational Medical Outcomes Partnership (OMOP) project. A central component of OHDSI’s work is the development of the OHDSI Common Data Model (CDM) [13]. In this study, the researchers utilized the RxNorm and RxNorm Extension standard terminology tables from the OMOP CDM. These tables include seven distinct components: CONCEPT, CONCEPT_ANCESTOR, CONCEPT_CLASS, CONCEPT_RELATIONSHIP, CONCEPT_SYNONYM, DOMAIN, DRUG_STRENGTH, RELATIONSHIP, and VOCABULARY. RxNorm and RxNorm Extension contain standardized and non-standardized drug names as well as mapping relationships between various drug names (CONCEPTs).
Data Processing Standardization
In FAERS, there are instances in the DRUG table where the same drug is listed under multiple names. Drugs can be recorded in various forms such as chemical names, generic names, brand names, abbreviations, and may even appear as part of a mixture listed under a compound name. Additionally, spelling errors, input errors, or non-drug names can further complicate the recognition of drugs. To address the issue of non-standardized drug names, this study conducted a standardization process on the drugs listed in the DRUG table. The primary processing steps are as follows:
i. Remove duplicate entries of the original drug names in the DRUG table and eliminate data that clearly represent input errors.
ii. Utilize text similarity comparisons and manual verification to match the original drug names to drug common names, synonyms, clinical trial IDs, salts, brand names, trade names, and compound names in the DrugBank database. This step allows for further matching to DrugBank IDs.
iii. For the remaining original drug names, employ text similarity comparisons and manual verification to match them to the CONCEPT_SYNONYM table in RxNorm and RxNorm Extension. Match these to unique CONCEPT_IDs and CONCEPT_NAMEs, and use the CONCEPT_RELETIONSHIP table to map these CONCEPTs to CONCEPT_CLASS as “Ingredient” or standard CONCEPTs as much as possible.
iv. Finally, use text similarity comparisons and manual verification to match these CONCEPTs to drug common names, synonyms, clinical trial IDs, salts, brand names, trade names, and compound names in the DrugBank database. This step results in the ultimate matching to DrugBank IDs.
At this stage, the goal is to match the original drug names in the DRUG table to DrugBank IDs as comprehensively as possible. This not only facilitates the decomposition of mixtures but also ensures that drugs of the same kind correspond to a unique DrugBank ID.
Disproportionality Analyses
Disproportionality analyses are commonly used methods for detecting adverse drug reaction signals both domestically and internationally [14]. Proportional imbalance analysis of drug safety data typically relies on the number of times a drug is reported together with a specific adverse reaction or event in a drug adverse reaction or event reporting database. It examines the statistical association between drugs and events reported in the database and quantitatively evaluates the relative frequency of reports involving both the target drug and the target event. The main approaches include the reporting odds ratio (ROR) method [15], the proportional reporting ratio (PRR) method [16], the Bayesian confidence propagation neural network (BCPNN) method [17], and the multiple item empirical Bayesian gamma Poisson shrinker (MGPS) method, among others. Among the four disproportionality analysis methods, the first two belong to the frequency- based approach, while the latter two belong to the Bayesian method. Frequency-based methods have simple formulas, are computationally convenient, and easy to understand, with high sensitivity but relatively low specificity. Bayesian methods involve complex calculations, have slightly lower sensitivity but higher specificity. Each of these methods has its own characteristics and advantages and disadvantages. In this study, we chose the computationally convenient ROR method to explore drug combinations related to acute kidney injury. The calculation method for ROR and its 95% confidence interval is as follows:
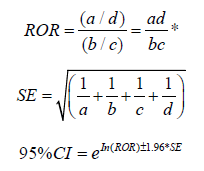
*a: Target drug combination of AKI; b: Other adverse effects of the target drug combination; c: Other drug combinations of AKI; d: Other adverse effects of other drug combinations.
Construction of Prediction Model for Acute Kidney Injury
From the combination of drug data in cases of acute kidney injury, biological macromolecule drugs were excluded, and small molecule drug combinations were retained. To reduce false-positive samples, a threshold of 1.5 was set, meaning that ROR values with a lower limit of the 95% confidence interval greater than 1.5 were categorized as positive samples, and ROR values with a lower limit of the 95% confidence interval less than or equal to 1.5 were categorized as negative samples. Subsequently, drug molecules were characterized using Extended Connectivity Fingerprints (ECFP) [18] ECFP is currently the most widely used molecular fingerprint for building Quantitative Structure-Activity Relationship (QSAR) models of compounds. In this study, Deepchem (2.4.0) was used to calculate ECFP with a radius set to 2 and a length set to 1024. The structure of this model consists of a fully connected neural network with an input layer, two feature extraction layers, and an output layer. The number of nodes in each layer is 2048, 1024, 128, and 1, respectively. Except for the last layer, which uses sigmoid as the activation function, the other layers use tanh as the activation function.
Model Evaluation
In this study, the method of Cross-Validation was adopted to evaluate the model performance with accuracy, precision, recall, F1 value, area under ROC curve (AUROC) and area under PR curve (AUPR) as evaluation indexes.
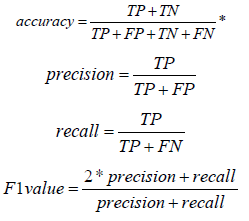
*TP: True Positive; TN: True Negative; FP: False Positive; FN: False Negative
Build Online Web Tools
The front-end follows web development standards, utilizes the Bootstrap framework, and is capable of adapting to different browsing devices. It incorporates jQuery and AJAX for interactive features and asynchronous updates, and it uses Bootstrap Table to present data. The back-end is built on the Flask framework to handle web page requests. It also includes model preloading and invocation. Nginx is employed as the web server, serving the dual roles of load balancing and reverse proxy.
Data Extraction Result
The data extracted from the DrugBank database is shown in Table 1. The results of resending are shown in Table 2. After resending, the number of items in DRUG table is 29035583, and the number of items in REAC table is 23699209.
Table 1: Data extracted from DrugBank database.

Table 2: FAERS data number of items before and after deduplication.

Standardization of Drug Names
After deduplication, the DRUG table from the 1st quarter of 2014 to the 4th quarter of 2024 contains 415,466 unique drug names with a total occurrence of 29,035,583. In the first matching round, through text similarity comparisons and manual verification, 70,772 original drug names were matched to the DrugBank database. These 70,772 original drug names had a cumulative occurrence of 26,070,476, accounting for 89.79% of the total occurrences. In the second matching round, through text similarity comparisons and manual verification, 20,236 original drug names were matched to RxNorm, with a cumulative occurrence of 866,868, representing 2.99% of the total occurrences. Additionally, 33,491 original drug names were matched to RxNorm Extension, with a cumulative occurrence of 1,468,912, accounting for 5.06% of the total occurrences. In total, 53,727 original drug names were matched to both RxNorm and RxNorm Extension, with a cumulative occurrence of 2,335,780, which makes up 8.05% of the total occurrences. Leveraging the CONCEPT_RELATIONSHIP table, the original drug names matched to RxNorm and RxNorm Extension were mapped to CONCEPTs with CONCEPT_CLASS as Ingredient or standard CONCEPTs in the third matching round. Through text similarity comparisons and manual verification, 48,002 out of the 53,727 original drug names were matched to the DrugBank database. These 48,002 original drug names had a cumulative occurrence of 2,254,287, accounting for 7.76% of the total occurrences.
In summary, after standardization, a total of 118,774 original drug names were matched to the DrugBank database, with a cumulative occurrence of 28,324,763, representing 97.55% of the total occurrences. Finally, the original drug names that couldn’t be matched to a DrugBank ID were replaced with DrugBank IDs, resulting in a new DRUG table. The new DRUG table contains 5,177 drugs from the DrugBank database, each corresponding to a unique DrugBank ID, including 3,377 marketed drugs and 1,800 drugs in clinical trials. The total occurrence in the new DRUG table is 29,121,678. The reason for the higher total occurrence of drugs in the new DRUG table compared to the original DRUG table is that mixtures were split into individual drugs during this process.
Drug Combinations in Cases of Acute Kidney Injury
Among the cases of acute kidney injury, 18.38% took one drug and 81.62% took two or more drugs. Among the cases of acute kidney injury, there were a total of 364,572 drug combinations, among which the top 20 drug combinations with the most frequent occurrence were shown in Table 3. In this study, the ROR value and 95% confidence interval were calculated for the top 10014 drug pairs with the most occurrence, in which the least occurrence was 84. Results There were 6869 drug combinations with the lower limit of 95% confidence interval greater than 1 and 4757 drug combinations with the lower limit of 95% confidence interval greater than 1.5. The top 15 drug pairs with the largest ROR value were shown in Table 4.
Table 3: The top 20 drug combinations that occur most frequently in cases of acute kidney injury.

Table 4: Top 15 drug pairs with the largest ROR values.

Prediction Model of Acute Kidney Injury Induced by Drug Combination
The above-mentioned interaction mining involved data for 10,014 drug combinations. After excluding biopolymer drugs, 9,012 pairs of drug combinations with small molecules were retained. Among these, 4,272 pairs with a lower 95% confidence interval of the ROR value greater than 1.5 were categorized as positive samples, and 4,740 pairs with a lower 95% confidence interval of the ROR value less than or equal to 1.5 were categorized as negative samples. The model takes the ECFP fingerprints of two drug molecules as input. This model utilizes the Adam optimizer and Gradient Clipping strategy, with cross-entropy chosen as the loss function. To prevent overfitting and enhance generalization performance, BatchNorm and Dropout layers were incorporated. Since the model takes the ECFP fingerprints of two drug molecules as input and to minimize the influence of the connection order on the model’s predictions, data augmentation was performed during model training. This augmentation ensured that the dataset included both possible connection orders for each drug combination with corresponding labels, as illustrated in Figure 1. The model was trained for a total of 50 epochs.
Figure 1

Model Evaluation Result
Under the Cross-Validation, the accuracy rate of model prediction is 89.61%, the recall rate is 89.36%, the accuracy rate is 88.80%, the F1 value is 89.08%, the area under ROC curve is 0.9619, and the area under PR curve is 0.9560, indicating that the model has achieved a good prediction effect.
Online Web
The online web tool developed based on the prediction model (http://192.168.114:2288/home, Figure 2) offers the following four major functionalities:
i. Data Export: There are three export options - “Export Selected,” “Export Current Page,” and “Export All.” Users can choose export formats such as JSON, XML, CSV, TXT, EXCEL, etc.
ii. Predicting the Risk of Acute Kidney Injury for Small Molecule Drug Combinations: Users can select drugs of interest from a pool of 10,741 small molecule drugs. After selection, the backend arranges these chosen drugs into combinations and uses the backend model for prediction. The tool returns the predicted risk probabilities for the selected drug combinations, ranging from 0 to 1. Higher values indicate a higher risk of acute kidney injury associated with these drug combinations.
iii. Predicting the Risk of Acute Kidney Injury for Combinations of Small Molecule Drugs and New Drug Molecules: Users can choose drugs of interest from the pool of 10,741 small molecule drugs and either draw or import the structures of new drug molecules. After submission, the backend model predicts whether the combination of the new drug molecules and the selected drugs will lead to acute kidney injury. The predicted results are given as probabilities between 0 and 1, with higher values indicating a higher risk of acute kidney injury associated with the combination.
iv. Data Download: Users can download files containing information about drugs, drug combinations related to acute kidney injury, ROR values, and other relevant data.
Requires Organizational Readiness and Workflow Integration
An AI-powered device may be technically sound but fail if it doesn’t integrate smoothly into clinical workflows. HTA assesses the organizational and human factors involved in implementing a new technology, ensuring developers consider training, resource allocation, and ease of use in their design.
Focuses on Value for Money: The economic component of HTA moves the conversation beyond just the technology’s performance to its overall value. It analyzes factors such as cost-effectiveness, longterm costs, and economic benefits, which encourages AI developers to build solutions that not only work but are also efficient and sustainable.
Encourages Data Quality and Integration
AI models trained on poor-quality or fragmented data will perform poorly. The HTA process forces a critical evaluation of data quality and the device’s ability to integrate with different healthcare data sources, pushing developers to improve their data infrastructure and management.
Promotes Continuous Monitoring and Reassessment
an AI system can evolve over time based on the data it processes. HTA and regulatory bodies must develop guidelines that mandate continuous monitoring and reassessment of AI performance, ensuring the technology remains safe and effective as it adapts.
Requires Robust Clinical Validation: Traditional HTA standards require rigorous clinical validation of medical devices. By implementing these standards in AI, developers are compelled to demonstrate the accuracy, sensitivity, and specificity of their products in practical environments and among varied patient demographics. This procedure aids in recognizing and rectifying performance problems and biases.
Figure 2

This study conducted data integration and cleansing of the FAERS data from the first quarter of 2014 to the fourth quarter of 2024. It standardized drug names and mapped them to unique DrugBank IDs among 5,177 drugs, including 3,377 marketed drugs and 1,800 drugs in clinical trials. Although only 118,774 original drug names matched the DrugBank database, accounting for 28.59% of the total original drug names, these 118,774 original drug names appeared a total of 28,324,763 times, representing 97.55% of the total occurrences. The remaining 296,692 original drug names that did not match the Drug- Bank database had an average occurrence of less than 3, which had little impact on statistical analysis. Drug names with fewer occurrences were more likely to be errors in data entry. In the new DRUG table, the total occurrences of drugs were 29,121,678, which was higher than the total occurrences in the original DRUG table (29,035,583). This indicates that after standardization, a significant number of mixtures were deconstructed. In comparison to previous studies that matched to RxNorm, the advantage of matching to DrugBank IDs lies in the fact that each DrugBank ID corresponds to a single drug molecule. It is easy to find drug-related information in the DrugBank database using DrugBank IDs, and conversely, it is straightforward to search for adverse reaction cases related to drugs in the FAERS database using DrugBank IDs. A total of 5,177 DrugBank IDs were ultimately matched in this study.
In contrast, previous studies matched to a larger number of Rx- Norm CONCEPT IDs, which included mixtures and lacked uniformity among drugs. Therefore, the standardization approach in this study is more reasonable and facilitates subsequent research. This study utilized the reporting odds ratio (ROR) method to identify 6,869 pairs of drug combinations that may increase the risk of acute kidney injury (P < 0.05). This finding has clinical significance. Due to computational cost limitations, ROR values and 95% confidence intervals were calculated only for the top 10,014 drug combination pairs with the highest occurrences in acute kidney injury cases. Further calculations will be conducted for the remaining drug combination pairs to provide more references for clinical research. Furthermore, a structure- based deep learning model was constructed using this data to predict whether combinations of two small molecule drugs would increase the risk of acute kidney injury. The model performed well under five-fold cross-validation. It relies on drug structures represented by extended-connectivity fingerprint (ECFP), making it suitable for predicting not only existing marketed small molecule drugs but also those in clinical trials or recently released. However, it is limited to predicting small molecule drugs and cannot predict biologic macromolecule drugs. The web-based prediction tool built in this study is user-friendly and does not require programming skills. It allows clinical researchers and related personnel to easily access the welltrained prediction model, simplifying the use of the research findings in clinical practice.
In this study, we employed the reporting odds ratio method to identify 6,869 potential drug combinations that may increase the risk of acute kidney injury. We constructed and trained a structure-based deep neural network predictive model, which demonstrated favourable performance under a five-fold cross-validation.
The authors declare no potential conflict of interest with respect to the research, authorship, and/or publication of this article.


