info@biomedres.us
+1 (502) 904-2126
One Westbrook Corporate Center, Suite 300, Westchester, IL 60154, USA
Site Map
Received: January 16, 2024; Published: February 11, 2025
*Corresponding author: Raiyan Mustavi Ahmed, Department of Electrical and Electronic Engineering,Islamic University of Technology, Bangladesh
DOI: 10.26717/BJSTR.2025.60.009464
Non-invasive electrolyte monitoring offers key benefits over traditional blood tests, including reduced discomfort and the ability to conduct continuous monitoring outside of healthcare settings. This chapter explores the applications of microstrip patch antennas for non-invasive electrolyte sensing, focusing on three designs: a basic patch, a spiral-engraved patch and a T- shaped slotted patch. These designs were modeled and analyzed to assess their performance by detecting varying concentrations of sodium chloride (NaCl) in sweat. The sensitivity, accuracy and precision were assessed using the reflection coefficient (S11 parameter). The results show the unique features of MPA sensors and their limitations in sensitivity to body electrolyte changes. Innovations in basic antenna design, such as RFID-inspired spiral and T-slotted patches, show potential for improving sensitivity and user comfort in continuous health monitoring; each having differing levels of accuracy and precision. Despite advancements, challenges like environmental interference and the need for greater sensitivity to small biological changes remain. The analysis emphasizes the need for innovative antenna designs to address challenges and ensure the effective use of non-invasive electrolyte sensors in healthcare monitoring. This research identifies optimal MPA design parameters to enhance non-invasive electrolyte sensing and improve integration into next-generation medical devices.
Keywords: Microstrip Patch Antenna; Sensors; Non-Invasive; Body Electrolyte; Sweat
The development of non-invasive electrolyte monitoring offers significant advantages over traditional blood-based tests, such as reduced discomfort and the potential for continuous monitoring outside clinical settings [1]. In recent years, microstrip patch antennas (MPAs) have emerged as promising components for wearable biosensors in these applications due to their planar design, lightweight nature and compatibility with integrated circuits. MPAs consist of a conducting patch placed over a ground plane, separated by a dielectric substrate. Known for their low profile and adaptability to various surfaces, these antennas are widely used in telecommunications and radar systems. In the context of biosensing, their performance is influenced by factors like patch size, shape and substrate properties, which in turn impact frequency, polarization and impedance characteristics [2]. Biomedical applications of MPAs have expanded, particularly for non-invasive health monitoring. Their small size and tunable resonance frequencies make them ideal for wearable devices capable of interacting with biological tissues or detecting biochemical changes. One area of interest is electrolyte monitoring in sweat, where variations in electrolyte levels reflect an individual’s health, which is applicable for athletic performance or medical condition assessment [1]. The antenna emits signals that interact with the targeted biological fluid and the altered return signal, influenced by the fluid’s chemical composition, is analyzed for health monitoring. Despite traditional MPAs’ advantages, specific demands in biomedical applications such as enhanced sensitivity, resilience against human tissue interference, flexibility and comfort require further innovations. Advanced designs like T-slotted patch antennas and RFID-inspired spiral engraved patches improve sensitivity and specificity, making them more suitable for non-invasive health monitoring [3,4]. By comparing simple microstrip patches (Model 1), T- slotted antennas (Model 2) and spiral engraved sensors (Model 3), this study aims to identify certain designs which are best for non-invasive electrolyte sensing, maximizing their potential in healthcare technologies. Several challenges limit the broader adoption of MPAs in biosensing. Low sensitivity to small electrolyte concentration changes, susceptibility to environmental interference (e.g., temperature, humidity) and the need for wearability without compromising performance remain key issues [5,6]. Achieving a balance between antenna performance and user comfort demands innovative design, new materials and improved integration techniques. This study seeks to address some of these issues by identifying performance of these non- invasive health monitoring devices.
Electrolytes (e.g., sodium, potassium, calcium, magnesium, chloride, phosphate and bicarbonate ions) are crucial for physiological processes, including fluid balance, acid-base balance, nerve impulse transmission and muscle contraction. Imbalances in electrolyte levels, caused by dietary deficiencies, excessive sweating or medical conditions can lead to health issues like muscle cramps, irregular heartbeat or edema [1]. Conventional monitoring methods, such as blood and urine tests, are either invasive or less accessible. Sweat- based monitoring, however, offers a non- invasive alternative, as sweat contains varying sodium chloride concentrations that can vary with different levels of physical activity [7]. For non-invasive monitoring, the MPA sensor is constructed with a copper patch and ground plane and a paper-based substrate. Changes in dielectric properties due to absorbed sweat alter the antenna’s resonant frequency and reflection coefficient, providing insights into electrolyte levels. Additional designs like T-slotted patch antennas and spiral-engraved antennas enhance sensitivity for specific electrolytic markers like NaCl [3], [4]. The microwave sensors are compact, durable and easy to manufacture, making them suitable for continuous, real-time health monitoring applications. Point-of-care (POC) instrumentation encompasses medical tools and technologies and are carefully designed to swiftly and accurately provide diagnostic results directly where patients are located, as opposed to the conventional centralized laboratory setting. A microstrip patch antenna sensor which can be utilized for non-invasive electrolyte monitoring is a great implementation of POC devices [1,8]. Electrolytes in human physiology, including their role in nerve function and fluid balance are essential to maintaining health [1]. Traditional electrolyte monitoring techniques include blood, sweat and urine tests, but a wearable MPA sensor represents a non- invasive, real-time solution ideal for point-of- care devices [1,7]. Sweat is composed of different substances but sodium chloride alone contributes to almost 1% W/V concentration of sweat, which is comparatively large. The composition of human sweat is influenced by temperature, humidity and other genetic and environmental factors [6]. For this study, three distinct antenna configurations: a simple microstrip patch antenna [1], patch antenna sensor with T- shaped slots [3] and a spiral engraved sensor patch [4] were specifically tailored for the application of non-invasive electrolyte sensing. These were common designs used in different MPAs and hence, were the ones analyzed. Then the performances were compared in terms of accuracy and precision. This includes utilizing the reflection coefficient (S11 parameter) derived from certain simulations.
In this study, a comparative analysis of three different microstrip patch sensors was conducted. The target was to find a non- invasive sensor which gives accurate results. For each sensor, various concentrations of sweat (for analytical case- sodium chloride) were used. The concentrations used for the study were- 0.05 mol/L, 0.10 mol/L, 0.15 mol/L and 0.20 mol/L for each and every model and the varying responses were noted. For the analysis, there were mainly two parts. The full simulation was performed using “COMSOL Multiphysics” software. The physics chosen was ‘Electromagnetic Waves, Frequency Domain’. This was done to solve time harmonic electromagnetic field distributions. Then ‘Adaptive Frequency Sweep’ was selected to perform simulations. This helps to compute responses of a linear model subject to harmonic excitation for several frequencies. Next, the results of the simulations were transferred for studying, analyzing and identifying the accuracies of the different models. After each of the models were built, the concentration of sweat (electrolyte) was changed. This was done by varying the relative permittivity and ionic conductivity of the electrolyte according to Table 1. Change in dielectric values result in a change in the electromagnetic properties. The overall working frequencies are in the range of 0.1 GHz to 5.5 GHz. These 4 different concentrations were used in the sensors (Figures 1-4). After the sensors were built, sodium chloride was added on the copper patch and paper substrate. Then the adaptive frequency sweep was selected and its range was from 0.1 to 5.5 GHz with increments of 0.02 GHz. For computing the results, direct solver was enabled to achieve the results faster. From here, the S11 versus Frequency plot was generated. S11 plots show the reflection coefficient’s amplitude and phase in relation to frequency. From the plots, the data of the frequency and S11 reflection coefficient values were extracted for each concentration (Figure 5). From the plots, data were collected and the derivative of the S11 values with respect to frequency was calculated. These were used to find sensitivity of each dataset and then these sensitivities were visualized against frequency. These showed how sensitivity varies with frequency and how sensitivity varies with concentration as shown in Figure 6 (Table 2).
Figure 1

Figure 2

Figure 3

Figure 4

Figure 5

Figure 6

Table 1: Sweat Concentrations and their Parameters. The reference values for different concentrations of sodium ion [Na+] and chloride ion [Cl-] in aqueous solution are used from variations of Cole–Cole model and Debye model parameters [3,4].

Table 2: Parameters of the Models.

The sensitivity data usually contains noise or irregularities that can possibly obscure meaningful information. By analyzing the S11 sensitivity components using the FFT, the noise components were filtered out, focusing on the dominant frequency components that were of interest. This helped in extracting meaningful information from the sensitivity data and reducing the impact of noise on the analysis. For different sets of concentration and relative frequency, the magnitude of FFT points were found to be in different ranges, so these were normalized and scaled accordingly for easy comparison of their characteristics. Normalization helped in eliminating duplicate points, anomalies and inconsistencies. This aided in simpler analysis. These FFT output mirrors after a certain point, so only one side (for this research purpose- the left side only) was extracted for analysis (Figure 7). From the relative frequency values, a specific one was chosen which would be used for further studies. This was done for all models and all 4 concentrations. For this, a particular threshold value of normalized sensitivity was chosen. Figure 7 shows the different threshold values that could be considered. However, only one threshold value could be chosen for each model. This was done with the help of Figure 8. The threshold value which was chosen had to be the most distinct from the rest. This means this value’s response is least overlapping in the various concentrations, which helps to identify certain points distinctly. Accordingly, it was seen that for model 1 and 3, the threshold value of 0.1 is most distinct and for model 2, the value is 0.2 and thus, they were selected. The value of frequency to be chosen is shown by Figure 9. The plot’s normalized sensitivity’s threshold value was considered to be 0.1 (shown by the dotted line). This line meets the plot at several points but the last point is chosen for convenience. Accordingly, the figure shows that the last point of the plot that meets the threshold is shown by an arrow. The corresponding relative frequency with respect to sensitivity frequency is the value of interest and used for further study. Once all the values have been collected for one model’s various concentrations, the best fit line was drawn. This is shown in Figure 10 and how the relative frequencies change with concentration. This was done with all 3 models. So, from this best fit line, if either of sweat concentration or relative frequency is known, the other corresponding parameter can be found from the graph. However, it is necessary to know whether the best fit line is good enough to predict corresponding frequency values of various concentrations. Accordingly, certain concentrations, particularly 0.07 mol/L, 0.12 mol/L and 0.18 mol/L were analyzed just like before. From them, the relative frequencies were determined from their corresponding graphs. Then the actual data from those plots were compared with values of relative frequencies from plots like Figure 10. At last, the error, accuracy and precision were determined. This gave an idea whether the best fit lines generated are actually good enough.
Figure 7

Figure 8

Figure 9

Figure 10

This chapter presents the findings from a comprehensive analysis of three distinct antenna designs utilized for non-invasive body electrolyte sensing. Conducted through detailed simulations, the performance of each antenna was meticulously evaluated based on their response to the S11 parameter as influenced by varying electrolyte concentrations. This investigation employed sophisticated methodologies, including frequency response analysis, sensitivity assessments, fourier transforms and curve fitting, designed to robustly gauge each sensor’s capability to accurately predict electrolyte concentrations. These findings not only highlight the scientific merit and technical sophistication of each design but also underscore the practical implications for advancements in non-invasive medical sensor technology.
Formulae used for Error Calculation
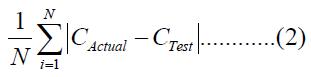
Mean Absolute Error (MAE) = Absolute value of the difference between the modeled sweat concentration values and those derived from the analysis of the S11 parameter

Mean Squared Error (MSE) = The average squared difference between the modeled sweat concentration values and those derived from the analysis of the S11 parameter
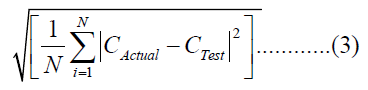
Root Mean Squared Error (RMSE) = The square root of the average squared difference between the modeled sweat concentration values and those derived from the analysis of the S11 parameter
Results Presentation and Comparative Analysis
Mean Absolute Error (MAE), Mean Squared Error (MSE), and Root Mean Squared Error (RMSE) (Figures 11-19). It is seen from Table 3, that the values of errors are very small. This shows that errors in the best fit lines of Figures 17-19 are minimal. Considering the RMSE values, Model 2 has slightly greater error than the other two models.
Table 3: Errors, Accuracy and Precision of the Models.

Figure 11

Figure 12

Figure 13

Accuracy and Precision
The performance analysis extended into evaluating accuracy and precision, each crucial for determining the practical applicability of the sensors in medical and health-monitoring contexts. Accuracy was evaluated based on the proximity of the sensor readings to the actual, known values of electrolyte concentrations, reflecting each sensor’s capability to deliver dependable data. From Table 3, it is seen that the accuracy values are significantly high. The average accuracies are good and Model 2 shows highest average accuracy. Comparatively, Model 3 has lower accuracy. Precision assessed the reproducibility of the sensors’ readings under identical experimental conditions, indicating the reliability and stability of each model. The precisions of the models were analyzed using standard deviation and variance. In this case, Model 2 had a little higher standard deviation and variance than Models 1 and 3. So, Model 2 showed a little lower precision. Comparative analysis across these metrics revealed varied performances among the antenna designs, with the patch antenna sensor with T-shaped slots often demonstrating superior overall results. This suggests that specific design features significantly enhance sensor functionality, compared to the other models. The comparative performance analysis clearly highlights the advantages and limitations inherent in each antenna design. The patch antenna sensor with T-shaped slots, in particular, showed promising results across most performance metrics, suggesting that its design is well-suited for advanced medical applications where accuracy and reliability are paramount.
Connection to Current Research and Broader Implications
This research intersects with ongoing developments in biomedical engineering and sensor technology, offering new insights that could facilitate the development of more effective non-invasive diagnostic tools. By aligning the study’s findings with current research trends, this discussion underscores the broader implications for patient care, potentially leading to more personalized and timely health interventions. This in-depth study provides a comprehensive evaluation of these three antenna designs for non-invasive electrolyte sensing which were not used previously in this sector, illustrating their potential to revolutionize the way physiological parameters are monitored and analyzed. The detailed comparison of their performance highlights the patch antenna sensor with T-shaped slots as particularly effective, combining high accuracy and low error rates, making it an excellent candidate for integration into next-generation wearable health technologies. However, this particular model uses a block of Barium Titanate, which might have influenced certain values. It could also have certain health problems and might increase the cost of these sensors. So, further work could be done to find out ways to avoid use of this material and also access models which are cheap. However, in that case, the sensor’s activity cannot be compromised.
As it is already seen that the three models that have been studied, have various types of responses. While some are better in accuracy, others are better in precision. One is more sensitive than the others with respect to certain changes. It might be desirable that one model should be highly accurate, with great precision and quite sensitive. Thus, a possible model could be constructed in the future by blending the three models. That particular model might be very good in every aspect and give fruitful results. Hence, we would not need to choose between models. One model should be enough to give all results as accurately as possible. Simulations were essentially done to get the idea of how these models would work in practical conditions. These antenna sensors could be internet connected for continuous monitoring of data, enabling remote detection of health issues. The sensors can be implemented in wearable medical sensor (WMS) based medical automation systems like drug infusion system, emotion recognition system, which can be further implemented into educational applications where emotion and stress of the student needs to be in healthy range [2]. These findings not only advance our understanding of antenna performance in medical applications but also pave the way for future innovations in non-invasive health monitoring technologies [7]. The ongoing refinement and testing of these sensors are crucial as we move towards more integrated and personalized healthcare solutions [8-12].
Overall, this analysis was initiated by choosing 3 particular and unique designs of MPAs. They were constructed and simulated in COMSOL Multiphysics. Moreover, various concentrations of NaCl were used. S11 plots were produced which were manipulated and used in the study. Later on, the performance of the MPAs were seen. The development and evaluation of three unique microstrip patch sensors designed to detect variations in salt concentrations have provided valuable insights into the capabilities and potential applications of this technology. While the initial results are promising, there is substantial room for enhancement and expansion. The primary aim of future work will be to build upon these foundational findings to optimize performance, broaden the scope of application and ensure the sensors are practical for real-world use. The highest amount of accuracy was achieved by ‘Model 2: Patch Sensor with T- Slotted Gaps’ which had an extra block composed of barium titanate. This barium titanate was used for a change in resonant frequency and an overall improvement in results. However, barium titanate is expensive and hazardous. So, a future aim should be finding a cheaper substance and a safer one to replace barium titanate without affecting the performance of the sensor. The potential for multiplexing and advanced computational modeling provides a pathway for these sensors to become integral components in complex monitoring systems [7], applicable in fields ranging from environmental science to healthcare. As we move forward, the focus will be on not only refining the technology but also ensuring it can operate effectively. The journey from laboratory research to commercial viability is challenging but crucial for realizing the full potential of microstrip patch sensors in contributing to safer, more efficient and technologically advanced societies. This small, non-invasive and portable device could be a major medical instrument in the near future.


