info@biomedres.us
+1 (502) 904-2126
One Westbrook Corporate Center, Suite 300, Westchester, IL 60154, USA
Site Map
Received: January 23, 2025; Published: February 04, 2025
*Corresponding author: Dereje Dobocha, Ethiopian Institute of Agricultural Research, Kulumsa Agricultural Research Center, P.O. Box 489, Asella, Ethiopia
DOI: 10.26717/BJSTR.2025.60.009458
The cultivation of faba beans is a common practice in the areas of Lemu Bilbilo. However, its productivity is
affected and limited by poor soil fertility and lack of alternative technologies such as application of optimal
phosphorus fertilizers for different varieties of faba beans. Against this background, a field trial was conducted
in farmers’ field during the 2017/2018 main growing season in Lemu Bilbilo, with the aim of determining the
response of faba bean varieties to different amounts of P fertilizer and their effects on the yield and yield components
of faba bean varieties. The treatments include the factorial combinations of three faba bean varieties
(Tumsa, Gebelcho and Dosha) and five phosphorus levels (0, 10, 20, 30 and 40 kg P ha-1). The experiment was
designed in a randomized complete block design with three replications. The experiment was laid out in a randomized
complete block design with three replications. The results showed that Tumsa variety had higher total
nodule number, effective nodule number and higher plant height. Total productive tillers per plant, number of
nodules per plant, thousand kernel weights, harvest index and biomass yield were significantly affected by main
effect of varieties. Higher total number of nodules per plant (63) and total productive tillers per plant (1.53)
were obtained from application of 30 kg P ha-1. Higher plant height (153 cm), biomass yield (14,158 kg ha-1) and
seed yield (6,323 kg ha-1) were obtained from application of 40 kg P ha-1.
Higher agronomic phosphorus use efficiency (569 kg grain kg-1P) was recorded from plots applied with 10 kg
P ha-1. The higher economic return of ETB 59,689 ha-1 with marginal rate of return of 502% was obtained from
application of 30 kg P ha-1. Therefore, it can be concluded that application of 30 kg ha-1 of P with Tumsa, Gebelcho
and Dosha faba bean variety was proved to be productive and superior both in seed yield as well as economic
advantage and might be recommended for Lemu Bilbilo area. Further study should be conducted in the future
both over locations and years in order to give full recommendation for practical application.
Keywords: Faba Bean; Fertilizer; Seed Yield; Nodules; Phosphorus Rate; Varieties
Faba bean (Vicia faba L.) is one of the most important legumes grown in various parts of Ethiopia including the Arsi zone [1]. It is grown on altitudes ranging from 1300 to 3800 m.a.s.l but mostly grown from 2000 to 2500 m.a.s.l [2]. The crop is well adapted to diverse soil types of Ethiopia where legumes are prominently used as traditional soil fertility maintenance crops in mixed cropping systems. It has also a great contribution for sustainable soil fertility management due to its ability to fix atmospheric N2 [3]. However, the average national productivity of faba bean (2.1 t ha-1) is low as compared to the world top producers [4]. [5] reported that faba bean productivity in Ethiopia is quite low compared to the UK where it is about 3 t ha-1. The production and productivity of faba bean is constrained by several biotic and abiotic stresses of which lack of improved varieties, shortage of certified seeds, diseases such as rust, powdery mildew and root rot, insect pests such as aphids and low soil fertility, acidity of the soil in high rainfall areas and low existence of effective indigenous rhizobia are the major ones and becoming a major challenge to food security. In addition to this, its production in Ethiopia is limited and fails to satisfy the increasing local consumption of seeds due to gradual decreases in its average yield. So, increasing crop production is the major target of the national agriculture policy and can be achieved by growing high yielding and stable varieties under favourable environmental conditions [6].
Improper use of inorganic fertilizers is a major cause of environmental degradation in Africa [7]. Low and unbalanced application rates per unit area, focusing mainly on urea and DAP fertilizers, with low fertilizer efficiency [2] and limited use of improved seeds [8] remain major obstacles for smallholder farmers to get the most out of them. Significant differences in yield between researcher and farmer- managed trials are known to occur due to the crop management and input use used [9], as well as other environmental factors. Improved agronomic practices increased seed yields by 88% compared to yields of conventional agricultural practices [10]. Likewise, there is a general consensus that improved varieties require high inputs of production to produce the potential yield. In addition, different varieties react differently to the production effort. Most cultivated lands of the Ethiopian highlands are characterized by heavy rainfall and prone to soil acidity due to removal of ample amount of exchangeable basic cations by leaching, crop mining and runoff as compared with grazing and forest lands [11-13]. Hence, soil acidity is now becoming a serious challenge for crop production in the highlands of Ethiopia where annual precipitation exceeds evapotranspiration [13,14]. [15] reported that soil acidity can lead to lower yields, poor nodulation of legumes and stunted root growth. The increasing trend of soil acidity and exchangeable Al3+ in arable and abandoned lands are attributed to intensive cultivation and continuous use of acid forming inorganic fertilizers [16].
The low yields in such soils could mainly be either due to the deficiency of nutrients, such as P, Ca and Mg [17,18], or toxicit of Al, Fe and Mn [19]. Moreover, [20] reported that acidic soils could expose faba beans there to more severe chocolate spot infection by reducing yield. The total amount of N bound by field beans is between 327 and 450 kg N ha-1 [21].The total amount of N bound by field beans is between 327 and 450 kg N ha-1 [21]. Faba bean is able to fix nitrogen, and it is used in crop rotation [22]. The use of faba bean in crop rotation had a significant effect by reducing the amount of chemical nitrogen applied to soil for crop production [23]. Faba bean also increases humus of soil [24]. In spite of the considerable addition of phosphorus to soil, the amount available for plant is usually low. Phosphate dissolving bacteria and soil microorganisms can play an important role in improving plant growth and phosphate uptake efficiency by releasing phosphorus from rock or tri-calcium phosphate. Phosphorus fertilization has a positive effect on faba bean yield components and yield [25]. The high variability of productivity among smallholder farmers can be attributed to soil characteristics, quality of field management, input use, geophysical characteristics such as altitude and weather conditions, demographic and market situations [26]. The use of mineral fertilizers to increase faba bean productivity by Ethiopian farmers is also low and this makes the farmers to produce faba bean below its potential.
The faba bean is a very important crop in the Arsi zone and is grown to break the monoculture-based wheat farming system, which always suffers from low inputs, poor management and attacks of new rusts with significant yield losses. In Ethiopia, research work regarding use of P and its role in legume growth, nodulation, N2 fixation and seed yield and yield components is relatively limited. Low crop yields coupled with predominantly nutrient soil limitations for crop production are undoubtedly a feature of subsistence farming systems throughout Ethiopia. Limited studies on the role of P on faba bean yield and yield components are reported in the case of Lemu Bilbilo conditions and studies on the effect of P fertilization are generally missing in the area. Apart from this, there is scanty information on the optimum P rates for faba bean to enhance yield and yield components. However, even though farmers do not use appropriate rate of P as an input and get a required yield, they produce faba ban in large scale and using it as rotation with cereals. The requirement of P by faba bean is relatively high as compared to other nutrients. Additionally, farmers have used fertilizer rates based on blanket recommendations. Therefore, the aim of this research was to determine the effects of different phosphorus fertilizer rates and varieties on the yield and yield components of faba beans in Lemu Bilbilo District, the highlands of Arsi zone in southeastern Ethiopia.
Description of the Study Area
A field trial was conducted in Lemu Bilbilo district, Arsi zone of Oromia National Regional State in southeastern Ethiopia during the 2017/2018 main growing season. The experimental site is located between 7.55 °N and 8.26 °E and 39.23 °E and 39.26 °E at an altitude of 2780 meters above sea level (Figure 1). Lemu Bilbilo District is located about 231 km southeast of Addis Ababa, the capital of Ethiopia, and about 56 km southeast of the city of Asella. According to the weather data documented at the weather station, Bekoji Substation of Kulumsa Agricultural Research Center, the District’s average annual rainfall in eleven years is 964.2 mm by quasi-bimodal dissemination, with the average extreme monthly rainfall (190.6 mm) happens in August (Figure 2). The average least and supreme temperatures for the dated 2007–2017 were 3.5 and 19.8 °C, correspondingly (Figure 2).
Figure 1

Figure 2

Soil Sampling and Analyses
Before the faba bean was grown, a soil sample was taken from the experimental site. First, soil samples were collected from the plowed and leveled field before liming and mixing at three locations using a zigzag method using an auger from top to 0 to 20 cm soil depth to obtain a representative composite soil sample. The composite soil representative was exposed to examination to determine soil physicochemical factors pre sowing and the result was revealed in Table 1.
Table 1: Selected physico-chemical characteristics of soil for the experimental site.

Experimental design and treatment procedures
The experiment consisted of two factors namely, three improved faba bean varieties (Tumsa, Gebelcho and Dosha) and five P-fertilizer contents (0, 10, 20, 30 and 40 kg P ha-1) were designed in a randomized complete block design with factorial combinations with three replicates. The total number of treatment combinations was 15. Three improved faba bean varieties Tumsa, Gebelcho and Dosha, released by the Kulumsa and Holeta Agricultural Research Centers, were used for the experiment. Lime (CaCO3) at a rate of 2,836 kg ha-1 was equally given to trial plots one-month pre sowing to adjust soil acidity. The land was prepared with the ox plow (farmer’s practice) using local maresha. Legumes require neutral to alkaline soils for maximum N fixation by nodule bacteria. According to [27], soils should be tested and limed to increase their pH to at least 6.0 for faba beans to grow safely. Lime was applied once evenly by spreading and worked into the soil with a hoe a month before planting to correct the pH of the highly acidic soil. The gross and net plot sizes of each plot were 2.6 m x 4 m (10.4 m2) and 2.6 x 2.4 m (6.24 m2), respectively. The distance between blocks and between plots was 1 m and 0.5 m, respectively. After preparatory soil cultivation, clean seeds of improved faba bean varieties were sown on June 15, 2017, in rows with 40cm inter rows and 5cm intra rows. The total number of rows per plot and the total number of plants per row are 10 and 52, respectively.
All triple superphosphate fertilizer was applied in different amounts as source of P fertilizer in the rows as per treatments at planting. All urea fertilizer (39.13 kg ha-1) was evenly applied as source of N-fertilizer when sowing in rows and mixed with the soil. Improved agronomic management practices (weeding, hoeing, disease management, etc.) were applied to faba beans during the growth period. In the current experiment, chocolate spot and rust diseases were observed, which were controlled with the fungicide Mancozeb 80 WP (Dithane M-45) at a rate of 2.5 kg a.i ha-1 three times as a foliar spray at weekly intervals. The crop was harvested in December at physiological ripeness.
Data Collection and Measurements
Total Number of Nodules: It was found by including the nodules of five central row plants arbitrarily sampled from each plot during flowering. The roots, including root mass and nodules, were cautiously detached utilizing a spade and hoe. The nodules were cautiously detached from the soil by washing in tap water and the overall amount of nodules was found by counting and averaged per plant.
Number Of Effective Nodule: It was found by observing the colors of a nodule cross section after its preparation with a blade. Nodules with a pink to dim red pigment were considered effective nodulation. The number was then found and the average per plant was made.
Plant Height (cm): Plant height was measured at physiological maturity of five randomly selected plants per plot by measuring the height from the ground to the top of the plant and averaging it.
Number of Productive Tillers Per Plant: The number of productive tillers was determined at maturity by counting all tillers who produced pods of five randomly selected plants from each plot and averaging to give values per plant.
Number of Pods Per Plant: The total number of pods per plant was determined by counting the number of pods per plant of five randomly selected plants from each plot at harvest and taking the average per plant into account.
Aboveground Biomass (kg ha-1): It was attained from plants reaped at ripeness from six central rows of each net plot and dried in the sunup to constant weight and then converted into kg ha-1.
Thousand Seed Weight (g): The thousand-seed weight of the plant was determined by weighing 1000 randomly selected seeds from the crop of each plot after the seeds were adjusted to a moisture content of 10%.
Seed Yield (kg ha-1): It was mowed from the net plot then threshed, winnowed, weighed and adjusting seed moisture content to 10%. Finally, the yield per plot was converted to per hectare and the average yield was given in kg ha-1.
Harvest Index (%): The harvest index was calculated as the ratio of seed yield (kg ha-1) to aboveground biological yield (kg ha-1) *100. Phosphorus Use Efficiency (PUE) (kg kg-1): PUE was determined as the economic production obtained per unit of P fertilizer applied [28].
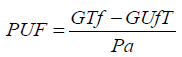
Where, GTf = grain yield of fertilized treatment (kg ha-1), GDWc = grain yield of unfertilized treatment (kg ha-1), Pa = P-fertilizer applied (kg).
Data Analysis
The collected data were subjected to analysis of variance using the General Linear Model method of R computer software version 4.3.0 [29]. Whenever treatment effects were significant, mean differences were separated using the LSD test at a 5% significance level [30].
Economic Analysis
At the end, based on the significant values, an economic analysis was carried out for different treatments. For economic evaluation, a marginal analysis was carried out using a manual developed by CIMMYT [31]. The official fees of urea and triple superphosphate and seed during the experiment were 1150 ,1250 and 2020 Birr per 100 kg, respectively. The cost of lime (CaCO3) was valued at ETB 350 Birr 100 kg-1.
Selected Physico-Chemical Properties of Soil of the Experimental Site The results showed that the textural class of the test site was clayey loam with a bulk density of 1.39 g/cm3, which is moderate according to the assessment [32] (Table 1). According to [33], a clay-loam soil texture is optimal for faba bean production. [34] also reported that medium-heavy soils with clay-loam structure are ideal for faba bean production. The moderate bulk density values indicate that the soil is not heavily compacted to inhibit root development. The pH (4.51) of trial place soil appeared to be highly acidic, as shown in Table 1. Therefore, based on the current laboratory results, the soils of the test sites are better suited for the growth and production of faba beans when enriched with lime. The soil of the experimental site had 1.33% organic carbon, 0.18% total nitrogen and 0.7 mg kg-1 available phosphorus, 14.1 cmol (+) kg-1 cation exchange capacity and 2.72 cmol (+) kg-1 exchangeable acidity. The results showed that available P was one of the main nutrients present in low proportions in the study area. It is below the requirements for field bean production and even for the undemanding crops. According to [35], plants’ need for available P varies, with low demanding plants requiring a P concentration of > 8 ppm, medium demanding plants > 14 ppm and high demanding plants > 21 ppm. This very low available phosphorus content was probably caused by the soil’s inability to adsorb or retain phosphorus, as the soils in the study area are acidic and clayey. Its deficiency is also attributed to human management systems such as deforestation, overgrazing, over-cultivation and erosion, which in turn reveals the prevalence of land degradation [36]. This justifies that the application of P fertilizers is decisive to exploit faba bean production in the experimental site.
Total Number of Nodules Per Plant
The result revealed that the main effects of varieties and P fertilizer rate were significantly (P < 0.05) affected for the overall nodules plant-1 whereas the interaction effects of varieties and P fertilizer rates had no significant influence on this trait (Table 2). Variety Tumsa gave expressively advanced overall nodules plant-1 (58.92) though it was not significantly different from that of Dosha, whereas the lowermost overall nodules plant-1 (48.65) occurred in the variety Gebelcho (Table 2). On the contrary, [37] suggested that the genotypes were similar in terms of nodulation and atmospheric nitrogen fixation, which was more important in meeting the nitrogen requirement of the crop. The use of P fertilizer at the rate of 30 kg ha-1 provided top overall nodules plant-1 (63.31), while the minimum overall nodules plant-1 (39.09) was noted from unfertilized plots. The overall nodules plant-1 increased by 62% as P rate increased from 0 to 30 kg ha-1 although it decreased with a further increase in P rate to 40 kg P ha-1. The result was coherent with [37] who reported that phosphorus application showed a key role in improving nodulation of root compared to faba beans without phosphorus fertilization. These results were consistent to the results of [28], who observed an increase in dry matter, nodulation, N fixation, P uptake and protein yield of legumes with increasing P content. Likewise, [38] stated that the highest total number of nodules was observed at the highest P rate (30 kg ha-1), whereas the minimum overall nodules plant-1 was recorded from P unfertilized plot in soybean.
Table 2: The main effects of P-fertilizer level and varieties on total number of nodules per plant, effective nodules, productive tillers per plant, plant height, and pods per plant of faba bean.

Note: TNP= Total number of nodules per plant, ENP= Number of effective nodules per plant, PTP= Total productive tillers per plant, PPP=Number of pods per plant, PLH=Plant height. Means followed by the same letter(s) within a column are not significantly different from each other at 5% level of significance, ns: Not significant.
[39] reported that phosphorus application of 22.5 and 45 kg P2O5 ha-1 significantly increased the number of nodules in soybean by 11.85 and 21.71%, respectively, compared to the control. On the contrary [40] reported that the application of P fertilizer did not significantly affect the number of nodules plant-1 and that a peak number of nodules were achieved with a lower amount of fertilizer.
Number of Effective Nodules Per Plant
The result indicated that only the main effects of varieties and P fertilizer rates expressively (P<0.05) affected number of effective nodules per plant (Table 2). Variety Tumsa provided better number of effective nodules plant-1 (52.44), while the poor number of effective nodules plant-1 (43.24) was recorded from Gebelcho variety (Table 2). The number of effective nodules plant-1 increased by 53% as the P fertilizer rate increased from 0 to 30 kg P ha-1 (Table 2). However, as the P fertilizer further improved to beyond this rate the value of this parameter declined (Table 2).
Total Productive Tillers Per Plant
The main effect of faba bean varieties had a highly significant (P < 0.001) influence on the total number of productive tillers plant-1 (Table 2). A significantly higher number of productive tillers plant-1 (1.53) were recorded for the Gebelcho variety, whereas the lowest number of productive tillers plant-1 was achieved in the Tumsa variety. The productive tillers plant-1 of the Dosha variety was statistically on a par with the Gebelcho variety. This could be due to differences in the genotype of the faba bean varieties. On the contrary, [41] reported that faba bean varieties had no significant differences in the number of tillers plant-1. Application of different amounts of P resulted in a significant difference in the number of productive tillers plant-1 in faba beans (Table 2). Application of 30 kg P ha-1 resulted in a higher number of productive tillers plant-1 (1.53), which was comparable to all other P application rates except the control (1.18). This suggested that a P rate of 30 kg ha-1 could be the optimal rate to improve the number of productive tillers plant-1. Further increasing the P rate above 30 kg ha-1 did not have a linear effect on the number of productive tillers plant-1, which is evident from the plots with P application at a rate of 40 kg ha-1, which was lower P application had a lower number of productive tillers plant-1 although both treatments were statistically equivalent. Since P is responsible for good root growth, which directly affects the overall performance of the plant, P maintenance at unfertilized plots resulted in the lowest number of productive tillers plant-1. In line with this result [42] reported that the number of branches plant-1 increased with increasing phosphorus application rates up to the optimal level in common bean.
Plant Height
The mean plant height of the faba bean is given in Table 2. The main effect of faba bean varieties was highly significant (P<0.001) on plant height. A significantly higher mean plant height (156.87 cm) was recorded for the Tumsa variety, while the Gebelcho variety had the shortest height (137.87 cm) followed by the Dosha variety (140.80 cm). The Gebelcho variety is considered a dwarf variety compared to the other two varieties. Likewise, [43] reported that a variety called Gebelcho was the shortest variety. [44] also reported that plant height was significantly influenced by faba bean accessions. On the contrary, [45] reported that plant height did not vary significantly between faba bean varieties. Application of different amounts of phosphorus had a highly significant (P<0.05) effect on plant height of faba beans (Table 2). Plant height increased steadily with increasing P fertilizer rates from 0 to 40 kg P ha-1 although the difference was not significant at P fertilizer rates in the range of 20 to 40 kg P ha-1. The increase in plant height with increasing P application rate could indicate maximum vegetative growth of plants at higher P availability. Likewise, this positive response could be attributed to better root growth due to phosphorus application, which allowed better uptake of soil moisture and nutrients, resulting in taller plants compared to no phosphorus application. A phosphorus application at a rate of 40 kg P ha-1 could be the optimal rate to induce an increase in plant height with an increase in the amount of phosphorus per unit as inferred from the control plots. However, statistically it was on par with other out-of-control P rates. With increasing P content from 0 kg P ha-1 to 40 kg P ha-1, plant height increased by 14%. It has been reported that the promoting effect of higher P levels on plant height is likely due to better root system development and nutrient uptake [46]. Likewise, [47] reported an increase in plant height of faba beans at both 50% flowering and maturity stages in response to increased P application. [39] also reported that phosphorus application significantly increased the plant height of soybean compared to the control. On the contrary, [48] found that the effect of P application on plant height in faba beans was not significant.
Number of Pods Per Plant
Faba bean varieties differed significantly (P<0.05) in the number of pods plant-1 (Table 2). A higher number of pods plant-1 (17) was observed in the Dosha variety, which was not statistically different from the Tumsa variety (16). A lower number of pods plant-1 (15) was recorded for the Gebelcho variety. Likewise, [42] reported that the number of pods plant-1 was influenced by faba bean varieties, in which the variety Gebelcho had the lowest number of pods plant-1. This result is also consistent with [44], who reported differences in the number of pods plant-1 between the varieties Degaga, Gebelcho and Moti. Their report also noted that the Gebelcho variety is among the varieties with the lowest number of pods plant-1, which is consistent with this study. The effect of different phosphorus fertilizer rates on the number of pods plant-1 was not significant (Table 2). Consistent with this study [37] reported that faba beans were also found to be unresponsive to phosphorus application in terms of the number of pods plant-1. This could be due to the fact that the number of pods plant-1 is mainly influenced by genetic character and less by the environment in terms of P nutrition. On the contrary, [48] reported that the number of pods plant-1 was significantly affected by the application of P in faba beans. [43] also stated for the common bean that all P fertilizer amounts applied significantly increased the number of pods plant-1 compared to the control and that at P doses of 20 kg ha-1 there was a significantly higher number of pods compared to the other amounts per plant was recorded.
Thousand Seed Weight
Mean thousand seed weight differed greatly (P < 0.001) between faba bean varieties (Table 3). Significantly higher average values of thousand seed weight (790 g) were recorded for the variety Gebelcho, which was statistically comparable to the variety Tumsa (777 g), while the lowest average thousand seed weight (699 g) was obtained for the variety Dosha. This could be due to the fact that the Gebelcho variety has a larger seed size compared to the other varieties, even though all three varieties are large-seeded beans. Furthermore, this importance of seed weight could be due to the larger difference in the source-sink relationship between varieties. In agreement with this, [42] reported that the varieties Gebelcho and Hacalu had the highest average thousand- grain weight, while the lowest average 1000-grain weight was recorded in the faba bean varieties Degaga and Shallo. [49] reported that varieties Moti, Tumsa and Gebelcho had a higher thousand seed weight, while the variety Degaga had a smaller 1000 seed weight value. [50] reported that the 1000 weight of the Degaga variety was similar to the Shallo variety and was small. In agreement with this study, [37] reported that genotype showed a significant influence on the 1000 seed weight of faba bean. The mean thousand seed weight of faba bean was not significantly influenced (P > 0.05) by the main effect of different P fertilizer rates and their interaction with varieties (Table 3). This result is consistent with that of [48], who indicated that the effect of phosphorus application on the 100-seed weight was not significant. On the contrary, [51] and [37] found that the application of P fertilizer significantly influenced the thousand seed weight of faba bean compared to the control.
Table 3: The main effects of P-fertilizer and varieties on seed yield and some yield attributes of faba bean.

Note: TSW= Thousand Seed Weight, DBY= Dry Biomass, SY=Seed Yield, HI=Harvest Index, PUE=Phosphorus Utilization Efficiency. Means followed by the same letter(s) within a column are not significantly different from each other at 5% level of significance, ns: Not significant.
Harvest Index
The mean harvest index of faba beans was significantly influenced by different faba bean varieties (P < 0.001) (Table 3). A significantly higher average harvest index (48.53%) was achieved with the Gebelcho variety, which was statistically on the same level as the Dosha variety (48.47%). The Tumsa variety had the lowest harvest index (43.84%). A variety with a higher thousand seed weight has a higher harvest index. This indicates that the harvest index may differ between genotypes. [42] reported that the harvest index of faba beans was significantly influenced by faba bean varieties. [52] also reported that the harvest index is different for different faba bean varieties. The mean harvest index of faba beans was not significantly affected by the amount of P application and its interaction with variety (Table 3). Consistent with this study [27] reported that the crop index of faba beans decreased with P application at 20 kg P ha-1 due to improved straw production. On the contrary [53], it was reported that phosphorus fertilizer application had a significant impact on the crop index of faba beans.
Aboveground Biological Yield
The result of aboveground biological yield of faba beans affected significantly (P < 0.001) between varieties and P application rates, but their interactions did not show significant (Table 3). Variety Tumsa provided top aboveground biological yield was achieved in the, whereas variety Gebelcho gave minimum aboveground biological yield. There was no significant difference among Gebelcho and Dosha varieties on this parameter (Table 3). Similarity with this result, [42] and [37] stated that aboveground biological yield differed significantly between faba bean varieties. Likewise, [37] found that peak aboveground biological weight was achieved for the Tumsa variety. This result is also consistent with that of [52], who reported that aboveground biological varied significantly among faba bean varieties. The aboveground biological yield increased by 29% as the P fertilizer rate upraised 0 to 40 kg ha-1 and did not show significant among p rate except control (Table 3). In agreement with this, [51] found that the application of P fertilizers significantly increased the biomass yield of faba beans. Likewise, [38] demonstrated that aboveground biological yield increased as P fertilizer level increased in soybeans. According to [54], the increase in aboveground biological yield with increasing P rates may likely be due to P having an amplifying influence on plant growth and biological yield due to its importance as energy storage and transfer required for metabolic processes and also the increases the efficiency of plants in photosynthesis increases the activity of rhizobia [55].
Seed Yield
The result revealed that the main effect of P fertilizer level greatly significantly (P < 0.001) affected seed yield whereas the main effects of varieties and its interaction with P fertilizer level did not show significant on seed yield (Table 3). On the contrary, [42] reported that there were differences between varieties in most seed attributes and seed yield. Seed yield increased steadily as the amounts of P fertilizers growing. The highest seed yield (6,323 kg ha-1) was gained at the highest P application level of 40 kg ha-1 but was statistically on par with the seed yield attained at the P level of 20 and 30 kg ha-1, respectively. Likewise, [56] reported that seed yield of soybean increased as the phosphorus fertilizer application level increased. The progressive increase in seed yield with increasing amount of P applications could be due to improved availability of P due to P fertilizer applications. The faba bean yield advantage from P application could be due to an increase in the number of productive nodes and the number of pods per plant, which they found as the number of pods per faba bean plant was highly correlated with seed yield [45]. Similarly, [37] reported that fertilization of faba beans with P fertilizer resulted in a significant increase in seed and biological yields compared to unfertilized beans. These results are consistent with [57] who concluded that the application of phosphorus fertilizer up to a certain amount can increase the yield of faba beans, but further application of P fertilizers cannot increase the yield but rather decrease it.
Phosphorus Utilization Efficiency (PUE)
The result indicated that the main effect of P fertilizer level significantly (P < 0.05) affected PUE whereas the main effects of varieties and its interaction with P fertilizer level did not show significant on PUE (Table 3). However, [58] reported a significant difference in PUE between varieties of faba bean. The PUE of faba bean declined by 260% as P content improved from 10 to 40 kg ha-1 (Table 3). Contradictory to this result, other researchers [58-65] reported that PUE in faba beans did not affect by P fertilizer application rate.
Economic Analysis of Phosphorus Fertilizer Rates
To detect treatments with supreme profit on the farmer’s investment, marginal analysis of treatments was performed. In economic analysis, farmers require a minimum return of 100%, which corresponds to an increase in net return of at least 1 Birr for every 1 Birr invested, to adopt new agricultural technologies [31]. Therefore, to derive farmers’ recommendations from the marginal analysis in this study, 100% return on investment is a reasonable minimum acceptable return because farmers in the study area do not usually apply P for faba bean production. The analysis of partial budget result revealed that the peak net benefit (60,225-birr ha-1) was achieved at P fertilizer level of 40 kg ha-1 next net benefit gained at P fertilizer level of 30 and 20 kg ha-1, respectively. The result also revealed that the marginal rate of return attained from P fertilizer rate 10 to 30 kg ha-1 was above the minimum marginal rate of return (Table 4). Therefore, use of P- fertilizer (30 kg ha-1) is the superior, worthwhile treatment that is economically viable and suggested for faba bean production in the study area.
Table 4: Summary of Economic Analysis of response of the application of phosphorus fertilizer rates to faba bean varieties.

Note: Faba bean seeds = 20.20 kg ha-1, Urea = 1,150 Birr 100 kg-1, TSP = 1,250 Birr 100 kg-1, Faba bean grain = 1,500 Birr 100 kg-1, Lime (CaCO3) = 350 Birr 100 kg-1, P = Phosphorus, MRR = Marginal Rate of Return.
Based the findings of this experiment it can be concluded that varieties was a significant improvement in the overall nodules, productive nodules and plant height of the faba bean, with the total number of nodules (59) and productive nodules plant-1 (52) being higher as well aboveground biological (13,905 kg ha-1) and plant height (141 cm) were recorded from the variety Tumsa. The top overall nodules plant-1 (63.31) and more productive tiller plant-1 (1.53) were obtained at the use of 30 kg ha-1 P-fertilizer. There was no significant difference observed between P fertilizer rate of 30 and 40 kg ha-1 on plant height, biomass yield and seed yield of faba bean. The aboveground biological yield and seed yield of faba bean improved by 29 and 25%, respectively as P fertilizer level increased 0 to 40 kg ha-1. The peak value of PUE was observed in plots with 10 kg ha-1 P fertilizer. A higher net profit of 60,225- and 59,689-Birr ha-1 was achieved from using P fertilizer rate of 40 and 30 kg ha-1, consecutively. Therefore, it can be concluded that the use of 30 kg ha-1 P fertilizer for the production of Tumsa, Gebelcho and Moti faba bean varieties proven to be productive and economically feasible in Lemu Bilbilo District and similar agro-ecologies.


