info@biomedres.us
+1 (502) 904-2126
One Westbrook Corporate Center, Suite 300, Westchester, IL 60154, USA
Site Map
Received: August 28, 2024; Published: September 13, 2024
*Corresponding author: C A C Sequeira, Department of Chemical Engineering, Instituto Superior Técnico, University of Lisbon, Av. Rovisco Pais, 1049-001 Lisboa, Portugal
DOI: 10.26717/BJSTR.2024.58.009178
Thin-layer electrodeposition or electroplating of metals and alloys is essential in the arena of macro-, micro- and nano-optics, optoelectronics, sensors, nanotechnology, automobile industry, energy, electrocatalysis and related fields. To enter this modern ever-evolving field of practical knowledge, this article provides basic considerations on the electroplating processes with utility for practitioners of deposition and researchers entering this field of electrochemical deposition. In particular, the following concepts are discussed:
1. Fundamental equations of electroplating,
2. Current distribution,
3. Throwing power,
4. Plating from aqueous solutions,
5. Plating from non-aqueous solutions,
6. Electroplating of alloys,
7. Electroless deposition of metals,
8. Charge transfer in metal deposition, and
9. Environmental aspects of electrodeposition. Key references are also included.
Keywords: Electroplating; Metals; Alloys; Current Distribution; Throwing Power; Electroless Deposition
Thin-layer electrodeposition or electroplating has been practiced industrially for over 160 years. For most of its history it was considered to be a low-tech empirical technology. Although many useful plating baths have been developed and additives identified for different purposes: uniformity of plating thickness, brightness, relieving of stress, increasing current efficiency, and minimizing hydrogen embrittlement, most of the progress was made by ingenious trail-anderror methods, with relatively little effort to determine the mechanism involved [1,2]. A major turning point in the above approach can be associated with the replacement of chemical vapor deposition of aluminium by electroplating of copper for wiring in ultra-large-scale integration on silicon chips, announced by IBM in 1997 [3]. This led to increase interest in electroplating in the microelectronic industry and to awareness of possible advancements through research and development, both in industry and in academia. The introduction of copper plating as an integral part of manufacturing microprocessors was no minor feat, and came after about a decade of intense research and development [4]. Following its success, electroplating was elevated from status of an empirical technology to that of a high technology, based on research and profound understanding of the way the different factors influence the quality of the product [5,6].
Much of what has been stated above regarding the electroplating of metals applies also to that of alloys. However, electrodeposition leads often to the creation of coatings consisting of pure metal, or of several layers of pure metals, one on top of the others, each serving its special purpose. Nevertheless, alloy deposition is not uncommon. Alloys of Pb-Sn for printed circuits and of Fe-Ni as soft magnets in the recording industry have been used for a very long lime [7,8]. More recently there is great interest in Pt-Co alloys serving as hard magnets in micro-mechanical systems (MEMS) [9,10]. Electroplating of alloys of W and Re with Ni or Co have also gained interest in recent years where high temperatures or high abrasion resistance is required [11,12]. There are several advantages to electroplating of metals and alloys, over methods of chemical or physical vapor deposition (CVD and PVD). These include, among others, low cost, low temperature application, uniformity of thickness, or inversely, designed nonuniformity (i.e., the ability to coat only on specific areas on the surface) [13,14].
Last but not least, metal deposition presents an interesting challenge of understanding of the interface. Alloy deposition also presents special challenges of understanding of the details of the processes taking place across the interface. There is only a limited number of cases (for example Pb-Sn) for which alloy deposition is “normal”, in sense that the composition of the alloy can be predicted from the behaviour of the alloying elements, each by itself [15]. In most cases (for example Ni-Re) it is “anomalous” in the sense that the composition of the alloy cannot be predicted from the known thermodynamic and kinetic parameters of the alloying elements [16]. Yet another class is “induced co-deposition” (for example W-Ni) in which only one of the alloying elements can be electrodeposited by itself. In this specific case, W cannot be deposited alone, but it can readily be deposited as an alloy with Ni, for example [17].
The fundamental equation for the overall reaction of metal deposition is

where M is any metal with a valency z. But this equation does not specify the phase in which each species is located and, more importantly, it does not take into account the role of the solvent. Both can be accounted for by rewriting this equation as

where the number of water molecules in the hydration shell is not specified because it may be different for different metals. It is important to realize that the hydration energy of ions in solution,Uhyd ,is very high, and can be expressed approximately by [18]:
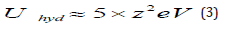
It is not implied here that all ions having a given valency possess exactly the same energy of hydration. For any given valency, smaller ions have higher energies of hydration, but the factor of z2 does show that valency is the main factor determining this energy. Thus, for monovalent ions, the values of Uhyd cluster around 5 eV, for divalent ions Uhyd is around 20 eV and for trivalent ions it is around 45 eV. Now, in order to deposit a metal ion from solution it is necessary to remove all its solvation shell, which requires a lot of energy. This is not a thermodynamic barrier, since much of this energy is regained in the overall process. However, the higher energy of hydration is expected to play a major role in the kineties of the deposition process, because this energy, or at least part of it, has to be supplied in order to allow the metal ion to reach the surface and interact with in. Thus, one would expect that metal deposition processes would be very slow, compared to outer-sphere charge transfer processes. This is not borne out by experiment. Indeed, the exchange current densities observed for metal deposition are often as high, or even higher, than those or outer-sphere charge transfer processes.
The mechanism of charge transfer during metal deposition and dissolution, providing a mechanism consistent with this behaviour is discussed in section 7. In this article the emphasis is on the practical aspects of metal deposition such as uniformity of plating, the solution chemistry, alloy deposition, and so on. It is interesting to consider the metal deposition process from a microscopic point of view. A rate of 20mAcm−2 , corresponds to the deposition of about 50 atomic layers of metal atoms per cm2s−1. This may be too fast for the adatoms to reach their equilibrium position. It is indeed observed that the alloys formed during electrodeposition are not necessarily those corresponding to the phase diagram of the alloys involved at room temperature. The interaction between the substrate and the metal being deposited can also play an important role in determining the quality of a plate product. When the crystal parameters of the two metals are different, one of two situations may be observed. The metal being plated may initially attain the crystal structures of the substrate, although this is not its most stable form. This is referred to as epitaxial growth [19].
As the thickness of the deposit grows, it gradually reverts to its stable crystal structure. The stress created by the epitaxial growth can be relaxed by impurity atoms and by dislocations in the metal. Large differences between the crystal structures of the two metals do not favour epitaxial growth. In such cases a so-called crystallization overpotential is observed, followed by two-dimensional nucleation on surface [20]. The effect is similar to the formation of small crystals in a supersaturated solution or of droplets in the vapor phase. Note that a tenfold supersaturation is equivalent, in terms of Gibbs energy, to an overpotential of only 29.5 mV for deposition of a divalent metal. Side reactions, mostly hydrogen evolution, play an important role in electroplating. As a rule, their effect is detrimental to the process because of the loss of energy and possible hydrogen embrittlement. Finally, there is the question of uniformity. Parts to be plated are rarely flat. They have grooves, edges, corners, protrusions, and so on. A good plating bath, which covers a surface uniformly irrespective of its shape, is said to have a high throwing power [21]. The factors controlling the throwing power of plating baths are discussed in detail in sections 2 and 3, where some of the aspects of electroplating are also reported.
Plating from aqueous solutions is strongly influenced by the competing reaction of hydrogen evolution. Considering the standard thermodynamic potentials of a metal, it is noted that Ag (E0 = +0.80 V) and Cu (+0.34 V SHE) have positive potentials with respect to the SHE, and therefore can be deposited even from acid solutions with 100% faradaic efficiency. Pb and Sn (E0 = -0.13 V and -0.14 V SHE, respectively) can also be deposited readily, because the exchange current density for hydrogen evolution on these metals is very small, and the rate of hydrogen evolution at potentials where these metals are deposited is negligible. Proceeding to more active metals, such as Cd (-0.40 V) and Zn (-0.76 V), electroplating is still possible, but the current efficiency is usually lower. This leads, of course, to a loss of energy, but that is a minor consideration in electroplating. The worst aspect of hydrogen evolution during metal deposition is the formation of atomic hydrogen on the surface, as an intermediate. A fraction of these atoms can diffuse into the metal, causing hydrogen embrittlement that could cause catastrophic failure of the structure [22].
For example, the landing gears of aircraft are made of highstrength steel, which is very sensitive to hydrogen embrittlement that can occur during electroplating by Cd, to protect it from corrosion. When the current efficiency is very low (10-20%), heavy hydrogen evolution takes place. Copious formation of hydrogen bubbles may screen parts of the surface from the solution, leading to non-uniform coating. In addition, a safety hazard may exist unless the plating shop is very well ventilated. In the case of even more active metals, such as Al and Mg, with E0 values of -1.66 V and -2.37 V SHE, respectively, the side reaction becomes so dominant that metal deposition from aqueous solutions can no longer take place. It should be noted in this context that in many cases of metal and alloy deposition the bath contains some complexing agent [23]. This can lead to better uniformity of the metal coating and improved brightness, but it also shifts the deposition potential to more negative values, leading to enhanced hydrogen evolution and a corresponding lowering of the current efficiency. It was stated above that Ag and Cu, with their standard potential positive with respect to the SHE, are about the easiest metals to plate. Based on this argument it would be expected that noble metals of the Pt group (Os, Ir, Pt) could also be electroplated readily. This is not the case, because these metals do not form stable hydrated ions, and most plating solutions contain a complex with a suitable ligand, driving the standard potential in the negative direction.
Choosing a suitable ligand often presents a challenge, because the
complex has to fulfil two inherently opposing requirements. On the
one hand, the ligands should bond to the noble metal cation strongly
enough to ensure stability of the resulting complex in an aqueous
solution. On the other hand, they should bond weakly enough to allow
deposition of the noble metal. For the case of Pt, the two commonly
employed complexes are 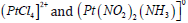 [24,25]. Interestingly,
fresh solutions of these complexes do not perform well. In
the case of the chloro-complex, aged solutions perform much better
than freshly prepared ones. For the nitroso-amino complex shown
above, aging is not enough. The performance of a freshly prepared
solution is improved with subsequent plating operations. Recent
studies indicate that the inherently conflicting requirements of the
ligand have been solved in an elegant way. The freshly prepared solution
is good for the stability of the bath, but is too stable for the plating
operation itself. However, aging or passage of charge in the solution
causes the replacement of one or more ligands by water, forming a
less stable complex that allows efficient plating or the noble metal.
Even so, deposition occurs at rather negative potentials where hydrogen
evolution takes place, in spite of the fact that the standard potential
for Pt deposition, for example, is +1.19 V SHE.
[24,25]. Interestingly,
fresh solutions of these complexes do not perform well. In
the case of the chloro-complex, aged solutions perform much better
than freshly prepared ones. For the nitroso-amino complex shown
above, aging is not enough. The performance of a freshly prepared
solution is improved with subsequent plating operations. Recent
studies indicate that the inherently conflicting requirements of the
ligand have been solved in an elegant way. The freshly prepared solution
is good for the stability of the bath, but is too stable for the plating
operation itself. However, aging or passage of charge in the solution
causes the replacement of one or more ligands by water, forming a
less stable complex that allows efficient plating or the noble metal.
Even so, deposition occurs at rather negative potentials where hydrogen
evolution takes place, in spite of the fact that the standard potential
for Pt deposition, for example, is +1.19 V SHE.
A plating bath should produce a uniform thickness of plating. If metal deposition is the only reaction taking place, variations in the thickness of the deposit are an expression of the uniformity of current distribution pertaining to the specific conditions of plating. This, in turn, depends on the composition of the bath, which determines the conductivity in solution and has an influence on the kinetics of deposition. It also depends on the applied current density, the temperature and the geometry of the part being plated. Edge effects can be troublesome and the position of the counter electrode(s) with respect to the working electrode (which is the part being plated) can play a major role, sometimes overcoming the inherent limitations of the plating bath. Figure 1 illustrates some plating practices to aid deposit uniformity. The resistance between the working electrode being plated (the cathode) and the counter electrodes (the anodes) can be represented by two resistors in series, as shown in Figure 2. In considering this Figure 2 it should be borne in mind that Rp is independent of the geometry of the cell, because the potential drop across this resistance occurs over a distance of less than 1 nm, while the solution resistance extends over the typical macro-dimensions of a plating bath, which is of the order of a few cm, namely about 107nm.
Figure 1: Plating practices to aid deposit uniformity:
a) Positioning and size of anodes;
b) Conformal anodes;
c) Robbers;
d) Non-conductive shields.

Figure 2: The value of RF and RS and the corresponding change in the potential between the working and the counter electrodes at a plating rate
of 10mAcm−2 .
a) Primary current distribution wa = 0.1;
b) Secondary current distribution wa = 10

Thus, for the case shown in Figure 2a the potential drop over RF is only 0.10 V, while that over Rs is 1.0 V. This represents primary current distribution. Since Rs depends on the cell geometry, this will lead to nonuniformity of current distribution. In contrast, (Figure 2b) represents secondary current distribution. Most of the potential drop will occur across the Faradaic resistance, and changes in the cell geometry have little effect on the total resistance between the anode and the cathode, leading to nearly uniform film thickness. The Wagner number is a dimensionless parameter that helps us determine the probable level of uniformity of current distribution in electroplating. There are two limiting cases to be discussed:
(i) Primary current distribution, where the uniformity of plating is determined exclusively by the conductivity of the solution and the geometry of the cell.
(ii) Secondary current distribution, where the current distribution is determined by the kinetic parameters of the deposition process. As usual, reality is somewhere in between, it is neither purely primary nor purely secondary. The transition from one regime to another is characterized by the dimensionless Wagner number, defined as [26]:
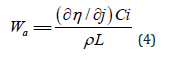
where ρ is the specific resistivity of the solution, in units of Ω cm, and L is a characteristic length.
The choice of the characteristic length L is not always obvious. It may be the length of the electrode being plated, the distance between the working and the counter electrodes or “the dimension of the irregularity” - for example, the difference between the shortest and the longest distance between the two electrodes. The last is the best choice in most cases, since it reflects the differences in the solution resistance in different areas of the piece being plated. The exact value taken is not critical, however, since Wa should be used only as a guideline, and the actual current distribution (or variation of thickness of plating) can be found either experimentally or by obtaining a numerical solution for the specific geometry and the kinetic parameters of the metal deposition considered. The partial derivative, taken at constant concentration (and, of course, constant temperature and pressure), is the differential Faradaic resistance, RF, in units of Ω cm². The solution resistance, expressed in the same units, can be written as:
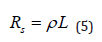
Hence, the Wagner number can be expressed simply as

In the absence of mass transport limitations, the local current density at a given potential is determined by the sum of two resistances in series: the Faradaic resistance and the solution resistance. For values of Wa« 1 the solution resistance is dominant and the current distributions depends primarily on geometry. This is the realm of primary current distribution. For Wa»1 the Faradaic resistance is predominant and secondary current distribution is observed.
It is interesting to consider the value of the Faradaic resistance at different overpotentials. Close to the reversible potential, the Faradaic resistance is given by
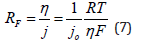
It is independent of potential and of the applied current density, but inversely proportional to the exchange current density, because the current-potential relationship is linear in this region [27,28]. In this region the Wagner number is also inversely proportional to the heterogeneous rate constant of the metal deposition reaction. Thus, fast reactions have low value of the Wagner number and tend to lead to primary current distribution. This is a rather unique situation in electrochemistry, where poor catalytic activity (i.e., low specific rate constant) is an advantage.
Considering the high-overpotential region, the relevant rate equation is
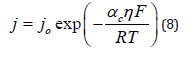
It follows that the Faradaic resistance in this region is given by
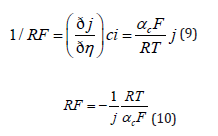
It is concluded that at high overpotentials the Faradaic resistance is inversely proportional to the applied current density, but independent of the exchange current density. Assume that one compares two electrodeposition reactions having values of j0 = 10−4 Acm−2 and. j0 = 10−6 Acm−2 , and deposition is conducted at a current density of j0 = 10−2 Acm−2. Both reactions will be in the linear Tafel region, and their Faradaic resistance will be equal, as long as their Tafel slopes are equal. This is the reason for the often used practice of plating initially at a low current density, to increase the Wagner number and thus achieve better uniformity of current distribution, at least for a thin layer of coating in recessed areas, followed by plating at a higher current density, to keep the time needed to reach the desired thickness reasonable. There is an important yet mostly overlooked point in the argument above. When the Faradaic efficiency is less than 100% (which is often the case) the value of determining the Wagner number is the partial current density for deposition of the metal, not the applied current density. This is particularly important in the case of alloy deposition, where each metal has its own concentration, as well as its own partial and exchange current densities, as we shall see in section 5.
The dependence of the Wagner number on the current density applied, for different values of the exchange current density, is shown in Figure 3. The region of -log j = 1.5-2.5, (approximately to 3.0-30 mA cm-2) is typical for many electroplating processes and, therefore, warrants some discussion. At low current densities, where j /j0 ≤ 0.1, the Faradaic resistance is independent of the current density (cf. Eq. [7]) but is proportional to 1/j0. At high current densities, where j/j0 ≥ 10, it is independent of j0 (cf. Eq. [10]) but it is proportional to 1/j. Needless to say, the transition from one region to another is smooth, not sharp as might be implied in this figure. Consider a deposition current density of 10 mA cm-2. The extrapolation of the two straight lines in Figure 3 cross, for j0 = 10−3 Acm−2 , a Wa≈ 0.25. For values of j0 ≤ 10-4, the system will be in the region where the Wagner number is independent of j0. At higher values of the exchange current density, where j0 ≥10-2, it will be inversely proportional to j0. Figure 3 shows that at the current densities of interest in the plating industry the Wagner number is less than unity, making it difficult to obtain good macro-throwing power. Hence uniform plating will not be attained on complex shapes of the cathode [29].
Figure 3: The Wagner number, calculated for different values of the exchange current density, as a function of the applied current density. L=2cm, b=0.12V, ρ=25Ωcm, n=2.

This leads us to discussion of the methods by which the throwing power can be increased. The most common method is to use suitable additives, as discussed in Section 3. Indeed almost all industrial plating baths contain additives of one kind or another, used to improve the uniformity of coating, as levelling and brightening agents and to relieve internal stress in the deposit. The specific resistivity of the solution, p, is important. It could be decreased by adding a supporting electrolyte, but this approach is limited in scope. A value P≈5Ωcm measured in acid copper baths containing CuSO4 and H2SO4 is about as low as one can go. Another approach is to add a complexing agents discussed for Cu deposition from a pyrophosphate salt (e.g. section 2). It should be borne in mind, however, that when a metal ion is complexed, its standard potential is shifted cathodically by a potential given by (2.3RT/nF)log K, where K is the stability constant of the complex formed. As a result, hydrogen evolution could occur along with metal deposition and the current efficiency might be decreased significantly.
A decrease in current efficiency with increasing current density is observed in many cases. This can enhance the uniformity of thickness of the deposit due to a negative feedback effect. Thus, in areas on the surface where the total current density is higher, the fraction of the current consumed for metal deposition is lower. The dependence of the current efficiency on current density is governed by the kinetic parameters of the two reactions involved. Thus, in the commonly encountered situation where hydrogen evolution is charge transfer controlled while metal deposition is partially controlled by mass transport (0.05 ≤ (j/jL) ≤ 0.7), the current efficiency to will decrease with increasing current density. Electrodeposition of a metal from a negatively charged complex ion can also influence the throwing power and the morphology of the deposit in other ways. Where the local current density is higher, the potential on the solution side of the interphase is more negative. This causes a decrease in the local concentration of the negative ions, which slows the reaction. In other words, a negative feedback mechanism is created, counteracting the variation of local current density caused by the primary current distribution.
The case of mass transport limitation has been discussed before. This leads to a mass transport-limited current density, independent of potential. But a limited current density could also be observed when the limitation is kinetic. This can happen when the metal ion exists in solution as a complex, although the electroactive species participating in the charge-transfer step is the free ion. An example of such a situation is the deposition of Cu from a solution containing copper pyrophosphate. A chemical step, the rate of which is independent of potential, is followed by an electrochemical step, as shown by the next two equations [30]:
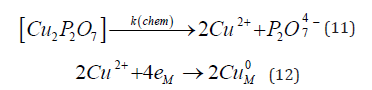
A limiting current was observed for this reaction, but its value was between one and two orders of magnitude lower than that calculated for mass transport limitation indicating that it was due to the rate of release of Cu2+ ions from the complex. Now the Faradaic resistance, defined as the partial derivative ðƞ/ðj approaches infinity at the limiting current density, and so does the Wagner number, leading to secondary current distribution and, hence, to uniform thickness of the deposit.
The throwing power of a bath is a measure of its ability to produce an electroplated coating of uniform thickness on samples having complex geometries. A quantitative measure of this property can be obtained by employing the Haring and Blum cell shown in Figure 4.
Figure 4: Top view of the Haring and Blum cell for the determination of the macro throwing power.

In this cell, two cathodes connected electronically are positioned at unequal distances from two sides of an anode. The throwing power (TP) is defined as [31].
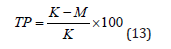
where K is the ratio of distances between the anode and the two cathodes (taken as 5) and M is the ratio of the coating thicknesses on the two cathodes. This is a little awkward, because ideal throwing power, defined as uniform plating thickness irrespective of geometry, corresponds to M= 1, yielding a value of TP = 80%, rather than 100%, which one would expect for the upper limit of such a quantity. Still, it provides a very useful quantitative scale describing one of the most important properties of plating baths. In the case of purely primary current distribution, where Wa «1 and there is effectively no throwing power, the thickness of the deposit will simply be inversely proportional to the distance. This yields a value of M= K and TP=0, as expected. Having defined the throwing power quantitatively, we can now proceed to discuss the physical reasons for the dependence of the throwing power on geometry and the methods available to increase the value of the TP to acceptable levels. As discussed previously, macro- throwing power determinates the uniformity of plating. In the following, we shell discuss the micro-throwing power, which controls the smoothness and brightness of deposit, and naturally, depends on quite different factors [32].
Scale is very important in electrode processes. In the case of macro- throwing power the irregularities in the shape of the electrodes are on the same scale as the cell itself. The distance between the anode and the cathode may be of the order of (1-10) cm and the characteristic length used to calculate the Wagner numbers would be in that range. When the appearance of the surface, particularly its brightness, is considered, the scale of interest is of the order of magnitude of the wavelength of visible light. It follows from electromagnetic theory that the ratio between the light scattered from a surface and that reflected from it depends on the ratio (h/λ)2, where h is the amplitude of the roughness and λ is the wavelength of light. If (h/λ)2 approaches zero, one has specular reflection; that is, the surface reflects light like a mirror. As this ratio grows, the surface first looks dull and eventually becomes black as (h/λ)2 exceeds unity. Thus the scale of interest, from the point of view of brightness, is of the order of magnitude of the wavelength of visible light, namely in the range (0.4-0.8) μm. The ability of a plating bath to form uniform coatings on this scale of roughness is called the micro-throwing power [33].
We can see intuitively that cell geometry has little to do with micro- throwing power If the amplitude of roughness is of the order of 1 μm or less and the distance between the anode and the cathode is a few centimeters, the variation of solution resistance at crests and valleys on the surface must be negligible. Hence, primary current distribution does not have any effect on micro-throwing power. A good way to look at it is to consider the appropriate Wagner number for this situation. Setting the characteristic length in Eq. (4) at a few μm, instead of a few cm, the value of Wa will increase by a factor of about 104, which is deep in the range of secondary current distribution. There must be a different mechanism controlling micro- and macro-throwing power. This is tertiary current distribution, which depends on the rate of mass transport, itself related to the Nernst diffusion layer thickness, ∂ [34]. A common observation in electroplating is that the roughness of the deposit increases with thickness. It is quite easy to produce a smooth deposit of 0.1 μm thickness, but keeping it smooth when the thickness has grown to 100 μm requires very special measures. Such an observation implies that a positive feedback mechanism is in operation, with the local current density higher at the protrusion than in recessed areas. It is easy to understand this behaviour, if the plating process is assumed to be at least partially controlled by mass transport. We recall that the current density can be written as
The Nernst diffusion layer thickness is larger in a recessed area than at a crest, hence, the local current density is smaller. As a result, recessed areas grow more slowly than crests, and the amplitude of roughness increases with time, and, hence, with thickness during plating, by a positive feedback mechanism. It is not difficult to see how a rough surface will grow even rougher by the foregoing mechanism, but how is roughness initiated? Experiments show that even when plating is conducted on a highly polished surface, the deposit will gradually increase in roughness. We may expect that plating on an atomically flat, single-crystal surface in a highly purified solution will not produce a rough deposit, but this is of little practical interest. In practice a surface is prepared by degreasing, activation by acid (to remove oxides), but rarely by polishing. Indeed, the surface is often roughened in order to improve adhesion, but even a polished surface will not be completely flat, so that there will always be irregularities that can serve as a site for initiating the above positive feedback mechanism. In addition, real plating baths usually contain some foreign particles that could adhere to the surface during plating.
These contaminants may be dust particles or solid grains of metal that fell off the anode during plating. It should be remembered here that impurity particles of sub-um dimensions, which are often difficult to remove by filtering, are fairly large on the scale of importance here. Another mechanism of roughness initiation may be associated with the nonuniformity of the substrate. The activation-controlled current density at sites of inclusions (such as graphite or sulphur), at grain boundaries and at different crystal faces may be different, causing uneven growth of the deposit. There is great commercial incentive to produce smooth and bright deposits. Consequently, there is a vast choice of additives to improve micro-throwing power, making deposits smoother and more uniform and producing a bright metal luster. Although the properties of additives differ widely, the mechanism by which they operate is common and easy to understand [35].
Molecules of the additive adsorbed on the surface prevent or inhibit metal deposition. To a first approximation it can be said that the rate of metal deposition is simply proportional to the fraction of the surface that is not covered by the additive. A more detailed analysis shows that adsorption on part of the surface could also have an effect on the rate of metal deposition on the bare sites, but this refinement need not concern us here. As a rule, the molar concentration of the additive in solution is very low compared to that of the metal ion being plated. Consequently, the rate of adsorption of the additive is controlled by mass-transport limitation, while the rate of metal deposition is mostly activation controlled, with possibly some mass transport limitation involved, depending on the ratio of / where j is the partial current density for deposition of the metal. This helps to produce a smooth surface for the same reason that a rough surface is formed in the absence of a suitable additive. On protruding parts on the surface the rate of mass transport is higher than on flat or recessed regions.
Consequently, the additive is preferentially adsorbed on such regions, inhibiting the rate of metal deposition. As a result, the current density for metal deposition is higher in the recessed or flat regions, leading to leveling. Under favourable conditions this effect can actually be strong enough to reverse the trend, namely to yield a smooth deposit on an initially rough surface. What is the fate of the additive during plating? Most of it is desorbed from the surface and released unchanged back into the solution. Some may be buried in the deposit. Alternatively, an additive may first be reduced, whereupon fragments of it are entrapped under the layers of metal being deposited. In any case the additive is consumed slowly during operation of a plating bath and must be periodically replenished. The incorporation of foreign molecules in the metal deposit affects its mechanical properties, as well as its corrosion resistance. These effects cannot generally be predicted by theory, and here the art of finding the right additive for each plating bath comes into play.
There is an optimum range of concentration over which each additive is most effective. This is also easy to understand, in terms of the mechanism just discussed. At low concentrations, the activity of each additive grows with increasing concentration, because there just is not enough material in solution to do the job: that is, coverage on the protruding areas cannot reach a sufficiently high value to induce significant leveling. In the best concentration range, coverage on protruding areas is high but in recessed areas it is relatively low, yielding the desired leveling effect. As the concentration of the additive in solution is increased further, the coverage on protruding areas reaches a limiting value and can grow no longer; the coverage on other areas keeps growing, however, until a high coverage is reached everywhere on the surface and leveling can no longer occur. Finally, we might ask what determines the suitable range of concentration of an additive. It is clear that the answer is different for different additives and depends on the metal being deposited. If the adsorption isotherm for the additive on the same metal is known, a good guess would be to use a concentration of the additive that will lead to a partial coverage, in the range of 0.2 ≤ө<≤0.8, because this is the range in which ðө/ðc is the greatest, and one may expect to obtain the highest difference of adsorption on different regions on the surface.
On the other hand, if the adsorption isotherm is not known, (which is usually the case), it is probably easier to determine the optimum range of concentration experimentally by trial and error, than to measure the isotherm and deduce the desired range of concentration from it. The choice of a good leveling agent depends, among other things, on the excess charge density on the metal, ɊM, at the potential where metal deposition is taking place. The latter depends, of course, on the potential of zero charge of the metal. We need to be careful here in deciding “which metal”. At the very beginning of plating on a foreign substrate, it will be the value of E2, for the substrate, but when the thickness of the deposit exceeds a few nm or less, it will be the value E2 for the metal being plated, because there is no longer any contact between the solution and the substrate. A positively charged additive will be preferentially adsorbed on a negatively charged surface, and vice versa. A neutral additive will be adsorbed mainly around the point of zero charge [36]. The potential at which the metal is actually deposited depends on its standard potential, its concentration and the complexes it formed with ligands in the solution, as well as on the rate of deposition.
We conclude this section by noting that, although the mechanism by which different additives operate is fairly well understood, we have certainly not reached the point at which the choice of an additive can be based on its known molecular structure or even on measurement of its adsorption isotherm under equilibrium conditions. Such knowledge can be used to advantage for preliminary screening and intelligent guessing, but it cannot eliminate some degree of trial and error in identifying a good additive for a given purpose.
Aqueous electroplating solutions are by their nature conducting but are often further modified to increase their main characteristics, namely their conductivity. Optimisation of the electroplating process requires alteration to four groups of parameters:
1) Solution characteristics: concentration, salts selected, pH;
2) Process variables: temperature, current density, anode choice;
3) Plant design: heating and cooling, agitation;
4) Effluent control: discharge or recycling.
Optimisation generally relates to efficiency and product quality without necessarily attention to economics, yet electrical cost effectiveness is an equally valid target. Because electrical energy is a cost input to all four groups, minimization of electricity usage is a major part of cost-effectiveness. However, (1) and (2) can affect largely the solution to bubbling [37], can affect conductivity in directly. The criteria for satisfactory electrodeposition include other factors, namely, appearance, metal distribution and flexibility with respect to the primers variable of solution composition, temperature, current density, etc. These criteria can be monitored by a number of tests in order to measure the variation which may occur. Provided the cathode current efficiency is constant the metal distribution over a surface is a consequence of the current distribution which is affected by the ohmic drop effects in solution between the electrodes and the over potential ate the cathode-electrolyte interface.
The electrical power costs of an electroplating process are purchased by the Wat( volt×amp). Because current is fixed by consideration of Faraday’s laws, if significant savings are to be made then they must come from reduction in the call potential requirements of the system:
1) The electrochemical plant must be designed and engineered to reduce potential drops to an absolute minimum.
2) Suitable high conducting solutions must be chosen.
3) Suitable conducting connections must be chosen to the electrochemical reaction.
4) Interelectrode spacing must be optimised.
5) Secondary reactions in the process may also lead to increased power consumption (e.g. hydrogen evolution).
6) Plating conditions must be taken into consideration, e.g. temperature, pH, etc.
7) Choice of plating solution is also important. Essential requirements of plating solutions are:
• They should contain a large proportion of metal
• They must be stable not only to the metal to be plated but also to the air
• They should effect good anode dissolution, there by maintaining the metal content of the solution
• They should produce regular and adherent deposition
• Their throwing power should be good, good conductance is necessary to reduce the energy absorbed in the process.
The most common metals electroplated in aqueous solutions are copper, iron, nickel, tin and zinc; some key data for their plating solutions, which have been investigated for commercial and industrial processes, are given in Tables 1-3 and Figures 5 & 6. In Table 1 five types of copper plating solutions where investigated. As a result of this type of studies it was found that conductivity of sulphate solutions was usually the highest, particularly in the case of copper. The search, in tube plating technology for printed circuit boards, for highly conductive copper solutions, is illustrated in Table 2, which does not require comments. Several salts of iron have been employed as the basis of plating solutions; the ferrous chloride solution has been preferred for high speed plating where a concentration of up to 400g/l is feasible at high temperatures. In Figure 5, conductivity data are plotted for ferrous chloride solutions with concentrations from 1 to 3.5M, pH from 0 to 1.5, and temperatures from 20 to 100C.
Table 1: Characteristics of copper plating solutions.

Table 2: Conductivity measurement values for different molarities of copper sulphate and acid concentrations.

Table 3: Conductivity of nickel plating solutions containing 30g/l boric acid at pH=2.5.

Figure 5:
a) Arrhenius plots for various chloride salts at 2M concentration and pH=0;
b) Variation of conductivity with temperature for ferrous chloride electrolyte;
c) Effect of ammonium chloride additions to 1.5M 2 FeCl solution on the conductivity.

Figure 6:
a) Effect of temperature on the conductivity of tin sulphamate solutions;
b) Conductivity of sulphuric acid solutions;
c) XRD patterns of Ni − Sn − P deposits prepared with different sodium stannate concentrations

Figure 7: Similarity between open-circuit corrosion and electroless plating at open circuit.
a) Mixed potential in corrosion of iron at pH =0.
b) Mixed potential in electroless plating 4 CuSo 0.1M , ethylenediamine tetraacetate (EDTA) 0.1 M, formaldehyde (FA) 0.05 M, pH 12.5.

It is found that conductivity varies almost linearly with temperature; it is also found that NaCl and Na4Cl broadly increase the conductivity and make satisfactory conductivity salts whilst MgCl2 ,CaCl2 and KCl decreased the conductivity as the concentration increases; furthermore, it is found that a combination of reduced ferrous chloride concentration and addition of either ammonium, potassium or sodium chloride would give an increased conductivity appropriate for a good electroforming process. In developing his classic formulation for nickel solutions, Watts took a number of considerations into account. In using both NiSO4 and NiCl2 , primarily to ease anodic dissolution problems, he actually improved conductivity without attempting to optimize it. More recent studies including mixed salts, e.g. magnesium salts, and chloride, sulphate and other solutions, helped understanding the fundamental aspects of nickeli plating solutions. In this context, Table 3, imports used data for copper sulphate solutions of different molarities and acidities. Nickel plating solutions, with pH=2.5, with and without boric acid (Ni 70g/l, boric acid 30g/l) at temperatures in the range 20 to 60ºC, clearly show that chloride solutions are very conductive and at concentrations above 70g/l Ni the conductivity is too high to be measured, solutions being exhibiting maximum conductivities depending in the nickel salt concentration.
In the sulphamate, mixed and Watts solutions this is at approximately 100g/l Ni and in the sulphate solution at approximately 120g/l Ni. The dependency is found not to vary with temperature. Higher temperatures are found to give higher conductivities with a linear relation. Over the past two decades, transition metal sulphides, namely Ni − S sulphides are known as excellent cathode materials for water splitting and other key electrochemical processes. It has been shown in the open literature that by electrodeposition from mixed solutions containing NiSO4, NaCl, H3BO3, CH2N2S, C7H6O6S, etc., it is possible to prepare excellent electrocatalysts exhibiting remarkable durability and superior catalytic performance. Thus, it is shown that by utilizing the electrodeposition technology as a simple, rapid, and mild synthetic route, it is possible to synthetize higher performance catalysts, as well as other promising energy materials.
The conventional solutions for tin electroplating are alkaline standard solutions and acid sulphate solutions. Other solutions include the sulphamate solution and those based on sulphonic acids used in tinplate production. By the eighties it was shown that the increase of conductivity with increasing temperature was increased as the concentration of tin was increased, (Figure 6a). It has been found that the optimum plating concentration depends on the particular application: lower concentrations lead to higher cathodic polarization and so improved throwing power. The upper limit is set by the solubility of the tin salt which is itself a function of the sulphuric acid concentration. Tin sulphate, SnsO4 dissolves in acid with partial hydrolysis giving Sn(OH )+ and HSO4− . The electrical conductivity of the solution is predominantly determined by the free sulphuric acid concentration, (Figure 6b). From the plots it can be seen that the optimum acid concentration is in the range 200 to 400 g/l. Too high an acid concentration depresses the solubility of the tin salt and also leads to anode passivation problems. The final compromise, based on these data, indicates that a Figure of 150 to 200 g/l is optimal.
In high speed plating where a very high current density is required, e.g. tinplate production, it may be beneficial to replace part of the sulphuric acid with an alkyl or aryl sulphonic acid. Such acids are strong acids, comparable with sulphuric acid, and this allows electrolyte solutions of high conductivity to be used. Furthermore, they are slightly reducing in nature and enable a multi-valent metal to be stabilized in its lower valency state, e.g. divalent stannous ion. In (Figure 6c), as is the case with sulphuric acid, conductivity increases sharply with concentration, reaches a maximum and then falls way more slowly, reflecting a suppression of dissociation at high concentrations. The traditional alkyl/aryls radical is phenol but others are of interest at present, notably methyl. In metal electrodeposition, zinc can be considered as an intermediate metal, giving rise to medium values of overpotentials due to secondary inhibition resulting from absorbed hydrolysed species. In acid sulphate solutions without an organic addictive, coherent deposition with coarse crystals whose diameter increases with the deposit thickness, are obtained. In chloride electrolytes even coarser grains are observed because of the more activating character of chloride ions against sulphate ions. In cyanide baths, much finer grains are obtained, and the deposit pertained to the field oriented texture on the unoriented dispersion type.
Whatever the pH, zinc is always more negative than hydrogen, that is hydrogen occurs at the cathode as a competitor to zinc deposition, resulting in a decrease of current efficiency and eventually in some atomic hydrogen diffusion into the substrate. In industrial processes electrolytic plating is an alternative to hot-dip galvanizing. However, hot dip always includes some surface alloying by diffusion, and the research remains very active in the field of electrodeposition of zinc and zinc alloys. Among topics of special interest, pulse plating is studied in order to generate nanocrystalline zinc deposits; organic additives are studied in order to control the morphology and the properties of the deposits, eventually in combination with pulse plating; texture and surface morphology of zinc and zinc alloys deposited on low carbon steel substrate are further investigated.
Many metals can be plated from aqueous solutions, even though their reversible potential is cathodic with respect to the reversible hydrogen electrode (RHE) in the same solution. Hydrogen evolution can occur in such cases as a side reaction, but as long as the current efficiency is not too low, plating can be conducted on an industrial scale. One of the important reasons for this is that the exchange current density for metal deposition is usually much higher than that for hydrogen evolution, with the result that the rates of these reactions at the potential where the metal is being deposited are comparable, even if the reversible potential for metal deposition is more negative. In the presence of a suitable ligand, forming complex with the metal ion being electroplated, the rate of metal deposition is slowed down (to achieve better throwing power) and the potential of deposition is shifted cathodically, but the high concentration of the ligand at the metal surface during plating may lower the rate of hydrogen evolution, allowing the process to occur at a reasonable current efficiency. Also, such electroplating baths usually operate in neutral or somewhat alkaline pH, and the reversible potential for hydrogen evolution is shifted in the negative direction, decreasing the overpotential for hydrogen evolution at the potential where plating is conducted.
However, more active metals, such as aluminum, titanium, and magnesium, cannot be deposited from an aqueous medium at all. An attempt to do so leads to copious hydrogen evolution, but no detectable metal deposition. On the other hand, sodium and other alkali metals can be deposited on mercury from an alkaline solution, probably because of the very low exchange current density for hydrogen evolution on this metal, and because an amalgam is formed that the active surface is always mercury or its amalgam, not the metal being deposited. When electroplating from an aqueous solvent is impossible, one must resort to noaqueous systems. These present a number of technical difficulties and have been used in practice only when there was no alternative. With evolving technological development, it is anticipated that plating from nonaqueous systems may nevertheless be adopted for commercial use, and a short discussion is therefore warranted. Since hydrogen evolution via decomposition of water is the problem, the most obvious way to proceed is to plate from a nonaqueous solution.
Moreover, the solvent used should not have an active proton that could readily allow hydrogen evolution, such as an alcohol. A molten salt, such as MgCl2, would seem to be a good solution to the problem. Indeed, metallic Mg is manufactured by electrolysis of anhydrous molten MgCl2, and similarly Al is produced from a bath containing bauxite (Al2O3) dissolved in molten cryolite (Na3AlF6) at high temperatures since, in these baths, metal deposition is the only cathodic reaction that can take place. The quality of the deposits is usually poor, however, and the high temperature of operation (particularly in the case of Al) could damage the substrate. Thus high-temperature molten salts are suitable for manufacturing the relevant metals, but rarely used for plating them as a coating [37,38].
Refractory metals, such as Ta and Zr, can be deposited from their fluorides in a molten salt bath. In the case of Zr, for example, the bath consists of ZrF4 or ZrF62− in a KF/NaF/LiF mixture. The alkali fluorides are employed to increase conductivity and decrease the melting point. Even so, these baths are operated at about 800°C. Good deposits have been reported as long as the right valency was chosen for each metal (+ 3 for Mo and V, + 4 for Nb and Zr and + 5 for Ta). The bath must be operated in a pure argon atmosphere, and impurities must be strictly excluded. It should be obvious that the operation of such baths is expensive and their control is difficult. Thus, their use is limited to either research purposes or highly specialized applications, where cost is of secondary concern [39-42]. The search for a room-temperature plating bath for aluminum has been conducted for many years, in view of the excellent corrosion resistance and low toxicity of this metal. An early technological success was the so-called hydride bath, which consisted of a solution of AlCl3 and LiAlH4 in diethyl ether, (C2H5)2O. A large excess of AlCl3 was used( AlCl3 / LiAIH4 = 7 :1) .
The exact mechanism of Al deposition from this bath may not be known, but there can be no doubt that the negative hydride species in LiAIH4 plays a crucial role, since the bath cannot be operated after it has been depleted of LiAIH4, even if the concentration of AlCl3 is kept constant. This technology was used on a few occasions for highly specialized purposes, mainly for the production of aluminum mirrors that are excellent reflectors of infrared radiation. It has not gained widespread commercial application because it requires the use of a highly flammable solvent and chemicals that are toxic and very sensitive to humidity and oxygen [43]. Aluminium can also be plated from a low temperature molten salt bath, employing a mixture of AICI and KCL. The melting point depends on composition, and the bath can be operated in the range 200-300 °C. Two anions can exist in this melt: AlCl4- and Al2Cl7- , their relative concentrations depending on the ratio of AlCl3 to KCl in the bath. The great advantage of this system is that it dissolves chlorides of other metals, such as Ti and Mn, and allows the deposition of alloys of these metals with aluminium.
The greatest disadvantage is that the bath must be operated under strictly anhydrous conditions, since AlCl3 is highly hygroscopic, releasing HCl when in contact with water or moist air [44]. Another near-room-temperature bath for Al plating contains a metal-organic compound, Al(C2H5)3, dissolved in toluene, with AlCl3 added to provide electrolytic conductivity. This bath, operated at about 100°C, has excellent conductivity and good throwing power. Although it has made some inroads for engineering applications, it’s widespread application has been limited, probably because of the need to use an expensive and dangerous metal-organic compound that ignites spontaneously upon contact with air [45]. A room-temperature plating bath is based on the use of Al2Br6 and KBr in toluene, ethyl benzene, or similar aromatic solvents. The chlorides and bromides of aluminium are covalent compounds and are highly soluble in aromatic hydrocarbons. An ionic compound such as KBr is not soluble in an aromatic hydrocarbon, but is readily dissolved in a solution of Al2Br6, in toluene, forming a complex ion

but this would still lead to the formation of potassium ions, which are unstable in aromatic solvents. Thus, the real ionic species in solution must be somewhat more complex. Experiments indicated that the actual species are formed in the reaction

This bath has the advantage of operating at room temperature, but it is also sensitive to moist air, forming highly corrosive and toxic HBr, and it has not been adopted by industry [46]. It is interesting to note that all four aluminium plating baths discussed here employ a solvent of low polarity. In fact, aluminium cannot be deposited from any polar solvent. For example, a solution of LiCl and AlCl3 in acetonitrile or propylene carbonate yields a deposit of metallic lithium, but no aluminium, even though, thermodynamically, aluminium should be deposited first. The reason evidently lies in the kinetics of the process. In any polar solvent the energy of solvation of the small and highly charged Al3+ ion is so high that the first step in the reaction sequence-the removal of a single solvent molecule from the inner solvation shell-requires and insurmountable energy of activation. It is only when the solvent is nonpolar that this process can proceed at a significant rate. It is not easy to find a suitable nonaqueous electrolyte for plating aluminium, titanium, and other active metals. Operating such a bath may be even more difficult.
First, water, and often oxygen, must be excluded. This can be done rather easily in continuous processes, such as plating a wire or a metal sheet. In most applications, however, electroplating is typically a batch process parts are introduced and removed from the bath routinely. Whereas the technology to perform such operations exists, it is more expensive and much less convenient than operation in an open aqueous bath. Most nonaqueous solvents are either flammable or toxic, or both. Most salts used to make up the bath are expensive, and some are quite unstable. Even a relatively inexpensive salt such as KBr can become expensive when it must be bone dry. Moreover, a current efficiency that is just a little below 100%, which may be a minor irritation in aqueous solution, could turn out to be a major problem in nonaqueous media, because the side reactions might lead to the accumulation of products that are detrimental to the operation of the bath, to say nothing of the health of the operator. Waste disposal, a problem even in aqueous plating baths, can be much more difficult and costly in nonaqueous baths [47].
These are some of the reasons for the failure of nonaqueous plating baths to come into general use, in spite of some clear technological advantages they can offer, in particular in making products that cannot be manufactured by other means. It is possible, however, that exacting specifications of emerging new technologies, accompanied by research and development in this field, could eventually lead to the introduction of nonaqueous plating technologies in some industrial applications.
There is much in common between the electroplating of a single metal and of an alloy of two or more metals. Both are inner-sphere charge transport processes, characterized by the fact that the initial states are strongly hydrated ions in solution and the final products are bare atoms that have become a part of the lattice of the metal electrode, and, in both cases, the surface of the substrate is changing as the process is proceeding. In both cases hydrogen evolution is a common side reaction, so that the current efficiency could be less that 100%, and, moreover, it could be a function of the current density applied. However, there are also significant differences that have to be taken into account when studying alloy deposition. some of which are listed below [48].
1) Alloy deposition, by definition, must involve at least two simultaneous electrochemical reactions occurring in parallel. In the general derivation of the equations for electrode kinetics one obtains an expression of the form [49]:
where it is tacitly assumed that only a single reaction takes place and the composition and morphology of the surface do not change during the experiment. If we try to apply this equation to deposition of a binary alloy, 3 problems immediately emerge: First, the concentration of the two metals in solution is not necessarily the same. Indeed in most cases they have to be different, in order to achieve the desired composition of the alloy being deposited. Secondly, at any given applied (or measured) potential, the overpotentials are different for the two metals. Thirdly, the transfer coefficient (and the Tafel slopes, bc = 2.3RT/αc F) of the two metals can be different. Consequently, measurement of the current-potential relationship does not allow us to draw any direct conclusions regarding the mechanism involved, although it does show in some cases the potentials where deposition of each of the two metals starts.
2) Equation (16) is valid only if the reaction occurs under purely activation control. When a single metal is being deposited, mass-transport limitation can be taken into account by replacing the bulk concentrations in Eq. (17) with the surface concentration. At steady state this is rather simple, since
In alloy deposition the concentrations of the two alloying elements in solution could be different: one may be deposited at a rate controlled substantially by mass transport while the other may be essentially under conditions of activation control. The number of electrons needed to reduce each of the alloying elements should also be taken into account. For example, in deposition of a Au-Ni alloy from a solution containing AuCl4− and NiCl2, at equal concentrations, the limiting current for Au would be 50% higher than that for Ni, (if the difference in the diffusion coefficient of the two ions is ignored). On the other hand, the hydrodynamic conditions, and, hence, the value of the Nernst diffusion-layer thickness are the same [50].
3) An attempt to calculate the extent of mass transport limitation for each of the alloying elements should be based on the partial current density for that element, never on the total current density applied. Unfortunately, this quantity cannot be derived from the current- potential relationship itself. It has to be calculated from the Faradaic efficiency (which is the measure of the rate of hydrogen evolution) and an analysis of the atomic composition of the elements in the deposit. Thus, the best one can do is to determine the average value of the partial current density of each alloying element. Admittedly, this limitation also applies to deposition of a single metal, unless one can be sure that hydrogen evolution does not occur at the potential where the deposition process takes place.
4) Determination of the relative concentration of the elements in the deposit, using electron dispersive spectroscopy (EDS) may not be enough, particularly when one of the alloying elements is in a high valency state, such as in Wo42− , because partial reduction to the oxide rather than the metal may be involved. It may be necessary to employ X-ray photoelectron spectroscopy (XPS), to determine the chemical state of each element in the alloy [51].
5) Uniformity of current distribution can always be a problem in electroplating, but in alloy plating there could be an added complication: In addition to leading to nonuniform thickness, it could also lead to nonuniform composition, since the rate of deposition of the alloying elements may depend differently on the local current density.
6) Deposition of alloys is usually conducted in the presence of one or more complexing agents. For example, in plating of a Ni-W alloy, citrate (and sometimes also ammonia) is added to the solution. Now citrate forms two different complexes with Ni, and NH3 could form as many as five different complexes of the type [Ni(NH3)n]. In addition, the Wo42− and the Ni2+ ions can form two types of complexes with citrate. Adding the hydrogen evolution reaction this could add up to as many as ten cathodic reactions taking place simultaneously in parallel [52].
We conclude this section by describing five specific examples of alloy deposition:
i. Simple alloy deposition is observed for the Pb-Sn couple. The standard potentials of the two metals are E0 = -0.13 V and -0.14 V vs. SHE, respectively, hence it is easy to adjust the concentrations in solution such that the reversible potentials would be the same, or close to each other. Although plating occurs at a potential negative with respect to the reversible potential for hydrogen evolution, both metals are very poor catalysts for this reaction, so that close to 100% Faradaic efficiency is readily obtained. The most important consequence of this is that the composition of the plated alloy is linearly related to the composition of the solution. This is, unfortunately not common in alloy plating, as we show next [53].
ii. Anomalous deposition can be represented by the formation of Permalloy (a magnetic alloy used in the voice recording industry), comprising typically 80% Ni and 20% Fe. The standard potentials are E0 = -0.26 V and -0.44 V vs. SHE for Ni and Fe, respectively. Hence, it might have been expected that equal concentration of the two metals in solution would yield a higher concentration of Ni in the deposited alloy, and it would be easy to reach the desired ratio of 80/20. In practice, quite the opposite is observed. It seems that the presence of Fe2+ ions in solution reduces the rate of deposition of Ni, so that a large excess of Ni2+ is needed to obtain the high Ni/Fe ratio needed in the alloy. This type of anomalous behaviour is frequently encountered in alloy plating, in different variations. In some cases one can observe mutual synergism: adding one metal increases the partial current density for depositing of the other and vice versa. Sometimes mutual inhibition is observed and sometimes it is a sort of one-way relationship, as in the case of permalloy: Adding Fe2+ to a solution containing Ni2+ slows down the rate of nickel deposition, but adding Ni2+ to a solution of Fe2+ increases the rate of iron deposition [54].
iii. Induced co-deposition is observed for deposition of metals that cannot be deposited at all from an aqueous solution, such as W, or can barely be deposited, with a low current efficiency and poor adherence of the deposit, such as Re. However, alloys of W with the irongroup metals can readily be formed, using, for example, a solution of NiSO4 and Na2 WO4, with citric acid added as a complexing agent. In this particular case it was shown that a Ni-W alloy is deposited from a complex containing both metals, while Ni is also deposited in parallel reactions from its complex with citrate. Very similar behaviour is observed for deposition of alloys of molybdenum [55-57].
iv. Galvanostatic measurements have a special importance in alloy deposition in fact, it has already been pointed out that galvanostatic measurements are unique in chemical kinetics, in the sense that the total rate of the reaction (which is proportional to the current density) is held constant by the electronic circuit, and the overpotential is allowed to reach the value corresponding to the applied current density. In other words, the reaction rate is independent of the heterogeneous rate constant, the concentration, the nature of the electrocatalyst and the temperature. The effect of these variables is expressed by the overpotential developed [58,59].
v. Consider, for example, the deposition of an alloy of Ag with Cu from their appropriate salts, conducted galvanostatically. Having only the AgNO3, in solution, the current density for deposition will be equal to the applied current density, since in this case the Faradaic efficiency is 100%. Now assume that Cu(NO3)2 is added, maintaining the concentration of AgNO3 constant, and the same current density is applied. The partial current density for deposition of silver will decrease. Reversing the order, one will find that the rate of deposition of Cu will decrease upon addition of AgNO3, holding the concentration of Cu(NO3)2 constant. This does not indicate that the two metals in solution inhibit the deposition of each other. It just shows that the wrong technique has been used to study whether they do or do not influence the rate of each other [60].
vi. Potentiostatic measurements repeated from the same experiments as above, show that the partial current density of one metal is independent of the presence of the other in solution, because the total current density is allowed to change according to the overpotential with respect to each of the metals, and the current density measured will be the sum of the current densities of the two metals [61].
A superficial view would lead us to think that electrochemical and electroless plating represent essentially the same process - in both cases the metal ions are being reduced. The electrons provided for the deposition process originate in one case from an electronic device (a potentiostat or a constant-current supply) and in the other case from a reducing agent in solution, so the reduction process is the same. However, as it turns out, there are some important differences. Electroless plating is an open-circuit process. There is only one electrode, which is the substrate being coated. In the research laboratory one often measures the open circuit potential with respect to a suitable reference electrode, but in industry this may not be considered necessary. In a sense, electroless plating is similar to corrosion. Both cases occur at open circuit, so there is no current flowing in an external circuit (indeed there is no external circuit). In corrosion, the rate of anodic oxidation of the metal must be equal to the rate of cathodic reduction of some species in solution (usually H3O+, H2O or O2). At steady state, a mixed potential is set up [62].
The same logic applies to electroless plating, except that the roles are reversed. Here, the rate of anodic oxidation of a suitable reducing agent must be equal to the rate of cathodic reduction of metal ions. The two cases are shown side by side in Figure 7 , where Figure 7a is just a reproduction of an Evans diagram [63], and Figure 7b shows the case of electroless plating of copper, employing formaldehyde as the reducing agent [64]. For the electroless deposition process corresponding to Figure 6b, the pH is set at 12.5 by adding NaOH, and EDTA is added as a complexing agent, to prevent precipitation of Cu(OH)2. As in the case of corrosion, the mixed potential represents steady state with two reactions involved, it is not an equilibrium state. The Tafel slopes for the anodic and cathodic reaction are not in any way related to each other and the relationship αan + αc = n does not apply, (although it may happen to be numerically correct). Indeed, even the number of electrons transferred may not be the same for the two reactions. The only constraint determining the position of Emix is that the total anodic current must be equal to the total cathodic current. Micro- polarization at potentials close to the mixed potential can be used to determine the current density during electroless plating, following the formalism used in electrode kinetics and replacing jcorr by jpl.
This approach is better for the determination of the rate of electroless deposition than measuring the kinetic parameters of the two reactions (reduction of Cu and oxidation of formaldehyde) in separate solutions containing only one of these materials. The latter is theoretically correct, but it ignores the possibility that the two components in solution may interact with each other, or influence the rate of each other [65]. Electroless plating is applicable to the deposition of metals and of alloys. Indeed electroless plating of a Ni-P alloy, developed by Brenner in 1946, was the first example of formation of an amorphous alloy, often referred to as glassy metal [66]. Since the several methods have been developed for the deposition of different amorphous alloys, both by electroless and electroplating technologies, in addition to metallographic methods of preparing such alloys, which will not be discussed.
We conclude this describing the advantages and disadvantages of electroless plating compared to electroplating:
1) Eliminating the need for a counter electrode in electroless plating has a profound influence on the current distribution. Macro- throwing power is no longer an issue, because primary current distribution is caused by the nonuniformity of the electrostatic field between the object being plated and the counter electrode. Since there is no counter electrode, uniformity of plating on complex shapes can readily be achieved.
2) Micro-throwing power is a result of the interplay between the Faradic resistance and the partial mass-transport limitation. As long as the rate of deposition of the metal is low compared to the mass-transport limited rate, the concentration at the surface is close to that in the bulk, (following the equation cs=cb (1-j/jL), yielding smooth and bright surface. In electroless deposition, the rate of deposition can be controlled by proper choice of the reducing agent and its concentration, as well as the concentration of the metal being plated. In addition, the pH and the temperature can also influence the rate of electroless plating. In any event, if electroless plating is followed by electroplating, the micro-throwing power of the bath used for electroless plating is of relatively minor importance, except in the sense that it might influence the quality of bonding to the next layer electroplated on top of it.
3) In contrast, during electroplating both macro- and micro- throwing power play a role. Moreover, since the plated layer is relatively thick (compared to that produced by electroless plating), the current density is higher, in order to increase production rate, and suitable additives are used to improve uniformity of thickness, as well as brightness and smoothness.
4) The most important feature of electroless deposition is that it can be performed on nonconducting surfaces, such as plastics, glass, semiconductors and ceramic materials. Special surface treatments are needed in order to activate the surface, and good adherent thin metallic surfaces can be produced, which can be followed by electroplating of the same or a different metal.
5) The weak point in electroless plating is that the solution is inherently unstable (since it is this thermodynamic instability that allows the bath to operate). The composition of the bath must be such that it will be stable in the bulk of the solution, and reduction of the metal will only occur on the surface that has been activated. Thus, maintaining uniformity of the product can be much more of a challenge in electroless plating than in electroplating. Nevertheless, electroplating baths are routinely used in industry, and new ones are regularly being developed to meet specific technological need.
6) Electroless plating is usually limited to very thin layers, typically less than 1 μm. This could be an advantage, when the purpose is to create a very thin barrier layer. When a protective layer is needed to prevent corrosion or abrasion) this is an obvious disadvantage. This, however, is not an inherent limitation of the method, and it would seem that technologies for electroless plating of thicker layers could be developed.
The deposition of a metal is a charge transfer reaction, just like an outer-sphere charge transfer reaction, ate least it would appear to be, when the reactions are written side by side, for example,
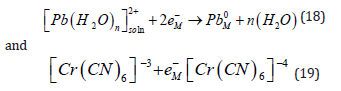
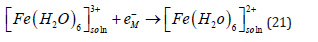
But in spite of the apparent similarity, the two reactions represent very different physical situations, and they are expected to follow different mechanisms [67,68]. It will be recalled that the hydration energy is very high, of the order of 20 eV for a divalent ion (cf. Eq. (3)). Assuming a hydration number of 4–6, this leads to an average energy of (3.3-5.0) eV per bond, which is the range of the bonding energy in chemistry. Thus, Eq. (19) represents the breaking of several chemical bonds. In contrast, Eq. (19.) shows no breaking of bonds. A minor change in the bond lengths of the ligands around the central cation and some rearrangement of water molecules around the complex ion (in the outer hydration shell) is expected, leading to a much smaller change in the Gibbs energy of the overall reaction. Metal deposition involves the transfer of mass across the interface, while for outer- sphere charge transfer to occur only electrons have to cross the interface, while both the reactant and the product stay on the solution side of the compact Helmholtz double layer. Based on the above differences, one would expect outer-sphere charge-transfer reactions to be many orders of magnitude faster than metal deposition. Surprisingly, such a trend is not observed experimentally. The heterogeneous rate constant for the two reactions shown in Eq. (18) and Eq. (19) are kh = 2.0 and 0.9cms−1 , respectively. Even the rate of deposition of trivalent bismuth, having a very high energy of hydration and requiring the transfer of three charges [69].
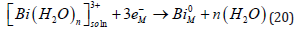
Has a rate constant that is just 17 times lower than that of the reduction of trivalent to divalent iron which is an outer sphere reaction [70].
Although metal deposition is often represented in simplified form as shown in Eq. (1), this representation has some profound internal contradiction (apart from the trivial correction of including explicitly water as the ligand, as shown in Eq. (2)). It is well known that metals do not consist of neutral atoms. They consist of positively charged metal ions “immersed” in a sea of delocalized electrons. The net result is a neutral piece of metal, of course, but the point is that at least one electron of each atom is delocalized, and constitutes the conduction band of the metal. Taking this into account, Eq. (1) should be rewritten (ignoring the water molecules for simplicity) as

The point of writing Eq. (2 2 ) in this, somewhat unusual, form is to emphasize the fact that the electrons are in the metal, both in the initial and in the final states. The only species that is moved from one phase to the other is the metal cation. Indeed the last equation should be written as
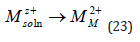
cancelling two identical terms on the two sides of the equation. This is admittedly an unusual way of presenting metal deposition. At first sight it might be argued that the electrode is charge positively, but in this sense Eq. (23) is not different from Eq. (1) or (2), where electrons are removed from the metal to the positive in solution. In both cases one must bear in mind that electrolysis requires two electrodes. The electrons removed from the metal in Eq. (1.) are replenished through the external circuit (not across the interface) from the anode, where an oxidation reaction takes place and electrons are released. The only difference between Eq. ( 1) and Eq. ( 23 ) is that in the former it is tacitly assumed that the cation is neutralized when it is still in the solution phase (at the OHP, to be exact) while in the later it is assumed that the metal cation first crosses the interface and is neutralized after it has reached the metal phase. The law of microscopic reversibility stipulates that reactions taking place in the forward and backward direction must follow the same path or, more precisely, must cross the same Gibbs energy of activation barrier. Admittedly, this is not a universal law, and there can be situations under which it does not apply, but such situations are rare, so that it can be assumed to apply, unless proven otherwise. We shall not go into the fine details of this law, except to note that it is implicitly assumed to apply whenever one writes the common relationship.

Now, we recall that the tree constants in the above equation can be written as

Thus, the standard Gibbs energy of a reaction is equal to the difference between the standard Gibbs energies of activation of the forward and backward reactions, which only applies when the reaction crosses the same energy barrier in both directions, namely, when the law of microscopic reversibility applies. The purpose of introducing the concept of microscopic reversibility is to provide further evidence, confirming that charge must be transferred across the interface by metal cations, not by electrons. To prove this, consider the anodic process of metal dissolution, written commonly as
Now, oxidation in electrode kinetics is, by definition, a process in which electrons are transferred from a species in solution to the electrode. But viewing Eq. (27), we note that there is no such species in solution. The electrons shown on the righ-hand side of this equation are in the metal and the only other species in solution (except water as the solvent) is the cation in its stable hydrated and oxidized form. Moreover, following the argument leading to Eqs. (22) and (23) above, Eq. (28) should be rewritten as
This shows that anodic dissolution of a metal cannot take place by electron transfer. On the other hand, Eq. (29) allows the process to occur, if charge is carried across the interface by the metal ion. This ion could start moving in the direction of the solution, under the influence of the electrical field applied, leaving behind the electron in the metal and acquiring water molecules as its effective charge increases with distance from the metal surface, as will be discussed below. Here is where the law of microscopic reversibility comes in. If we accept that in metal dissolution the charge must be carried across the interface by the metal cations, this law immediately forces us to accept that the same applies to metal deposition! The Latin term < reductio ad absurdum>, which means < reduction to the absurd>, refer to a tool borrowed from logic, used already by mathematicians of the school of Euclides in ancient Greece. The logical consequence is simples, yet extremely elegant. Thus in, order to show that some statement is wrong, one assumes first that it is right, and proceeds to prove that this leads to an internal contradiction. Here, we shall use it to prove that metal deposition cannot proceed by transfer of electrons across the interface, by assuming that it can, and showing that this would lead to impossible conclusions. We shall start with the simple case of deposition of Ag, which is written as

It was already shown by [4] that this process could not occur in one step, because of the different time scales for the transfer of an electron and an ion across the interface. Electron transfer happens on the time scale of femtoseconds, while ion transfer occurs on the scale of nanoseconds, namely about six orders of magnitude longer. Thus, the sequence of events, based on the time each step takes, is the following

Once the ion has been neutralized, there is no reason for the water molecules that formed the hydration shell to stay in the configuration represented as the intermediate in this sequence, and it takes about 1 ps for the molecules of water to relax back to their bulk configuration.
The following step is

The time taken for this step is estimated, assuming diffusion from the OHP to the surface of the metal, a distance of typically 0.6nm [68]. It is intuitively obvious that a neutral silver atom in solution should be less stable than a hydrated ion, and it turns out to be estimated this difference based on the following Haber cycle (where the water ligands are not shown, for simplicity)
It is seen that the difference between formation of a solvated ion in solution (for which E0=+0.80 V vs. SHE) and neutral silver atom in solution is close to ΔGsubl/F= -2.55V, where ΔGsubl is the Gibbs energy for sublimation of the metal. Hence, the standard potential for the hypothetical reaction

is given approximately by the Gibbs energy of sublimation of the metal. This is the absurdum. If silver deposition were to occur by electron transfer, it would require the creation of a highly unstable intermediate, Agsoln0 , at a potential of -2.55 V vs. the reversible Ag+ /Ag electrode in the same solution. This intermediate would have to survive a very long time, compared to the time taken to form it. However, at the potential of +0.80 V there would be a very high positive overpotential of 2.55 V to oxidize it. Moreover, at this potential (corresponding to -1.75 V vs. SHE), it would in effect corrode, that is, reduce water to molecular hydrogen, while it is oxidized to Agsoln+ that will form the stable hydrated cation in solution.
Finally, a neutral atom in solution could diffuse towards the surface or away from it. This could lead to a longer residence time for re-oxidation of the atoms in the bulk of the solution, resulting in a reduced Faradaic efficiency, which has not been observed experimentally. Having shown that charge is transferred across the interface by the metal cations, not by the electrons, one has to propose a mechanism that would explain the observed behaviour, particularly the unexpectedly high reaction rate discussed at beginning. In the model presented below it is assumed that the ions cross the interface by migration, under the influence of the high electric field in the Helmholtz double layer, caused by application of an overpotential. This field is given by

where E ⃗ is the electric field and ð is the thickness of the double layer, taken here as 0.6nm. For example, an overpotential of 0.3V yields a field of
The velocity of a hydrated silver ion in the bulk of the solution is a product of its absolute mobility, which μAg+ = 6.4×10⁻⁸ms-1 (for field of 1Vm−1 ) by the electrostatic field a migration velocity of

that would allow it to cross the interface in about 20 ps. This number is probably an underestimate, because it was calculated on the basis of the viscosity of bulk water. Even so, it is comparable to the rate of solvent rearrangement in aqueous solution. Thus, it is reasonable to assume that the hydration shell of an ion is in its lowest state of Gibbs energy, all along its path from the OHP to the surface of the metal. In the model presented here, ion transfer is assumed to occur in many small steps. Considering that the ion is initially hydrated and it is squeezed through a layer of water molecules adsorbed at the metal surface, the component of its movement in the direction perpendicular to the interface is expected to cause some distortion in the hydration shell around it. In this sense, each step involves some degree of solvent rearrangement. This is similar to outer-sphere charge transfer, but there are several important differences:
1) Ion transfer under the influence of the externally applied electrostatic field involves only a single time scale - that of the movement of the hydrated ion. This is of the order of 20 ps, which is similar to the relaxation time of molecules in bulk water. Hence, there is enough time for the water molecules in the hydration shell to rearrange around the ion, as it moves in the direction perpendicular to the electrode surface.
2) Transfer of the ion can occur in numerous steps. Consequently, the change in the hydration shell in each step can be quite small, leading to a very small change in the Gibbs energy for each step. When comparing this process to outer-sphere charge transfer, it is important to note two differences: On the one hand, the overall energy of solvent rearrangement in metal deposition is much larger than that in outer-sphere charge transfer. In the first, all the hydration shell is eventually removed; in the second, it is only rearranged to some extent. On the other hand, during ion transfer this rearrangement is assumed to occur in many small steps, corresponding to a very small change in the solvent rearrangement energy, along with small changes in the effective charge on the ion, in each step. In outer sphere charge transfer, a full electronic charge crosses the interface, so that the entire solvent rearrangement energy must be dealt with in a single step, leading to a significant energy of activation.
3) The transfer of an ion across the interface is more complex than might have been implied so far. Assuming that the hydrated cation is initially at the OHP, at a distance of about 0.6 nm from the electrode surface, there is initially no interaction between the ion and the electrode. As the ion approaches the metal surface, some interaction between the charge on the ion and the electrons in the conduction band of the metal takes place. This leads to a decrease in the effective charge on the ion, which in turn causes a decrease in its hydration energy. At some point along the path of the ion towards the electrode, the lowering of the total Gibbs energy of the system caused by this effect exceeds the increase caused by solvent rearrangement associated with the distortion, and, finally, removal of the hydration shell; and the total energy of the system will start to decrease.
Figure 8: Schematic plots of the electrochemical Gibbs energy for cathodic metal deposition as a function of the distance from the solvated ion at the OHP, showing the effect of overpotential. The dotted lines represent the gradient of ΔG, which is equal to the gradient of ƞ in this particular case.

In Figure 7 the variation of the Gibbs energy with distance from
the electrode surface is given schematically for metal deposition.
Curves for different values of the overpotential are shown. Curve 1
applies to the system at equilibrium. A value of G0 = 0.5 eV was chosen
here for the electrochemical Gibbs energy of activation, and the
position of the activated complex was taken to be closer to the initial
state of the solvated ion (which is at the OHP). Note that reversibility
implies that  for transition from the initial to the final state,
namely for the fully hydrated ion at the OHP to a bare ion as part of the
crystal lattice of the metal. Curves 2 to 4 show the manner in which
the Gibbs energy of activation is modified by applying different overpotentials.
The Gibbs energy for the overall reaction is given by
for transition from the initial to the final state,
namely for the fully hydrated ion at the OHP to a bare ion as part of the
crystal lattice of the metal. Curves 2 to 4 show the manner in which
the Gibbs energy of activation is modified by applying different overpotentials.
The Gibbs energy for the overall reaction is given by
The Gibbs energy of activation is modified by the applied overpotential so that
hence, the symmetry factor β retains its usual definition
The peak in the electrochemical Gibbs energy in Figure 7 was chosen to be at one quarter of the distance between the initial and final states, when the system is at equilibrium (ƞ = 0). This leads to a numerical value of βc=0.25 for the cathodic process of metal deposition. The corresponding rate equation, at high cathodic overpotential and in the absence of mass-transport limitation, is given by
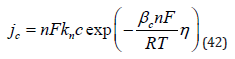
where n is the number of unit charges transferred, and c is the concentration of the hydrated Ag ions at the OHP. Thus, the value of the cathodic transfer coefficient for n=2 is given by

leading to a Tafel slope of bc = 2.3RT/αc F = 0.118 V at room temperature in agreement with experimental observation in some cases of deposition of divalent metals. For the reverse reaction of metal dissolution, the corresponding values are:
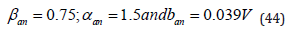
It should be noted that in this treatment there is no compelling reason to assign a value of βc=0.25 for the metal deposition process, and this should be determined by experiment. On the other hand, the requirements that
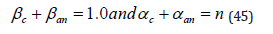
are maintained irrespective of the value of βc. If charge transferred across the interface takes place by ionic migration generated by the electrostatic field, it is necessary to consider the influence of the metal/solution potential difference on the exchange current density. While MΔS ф is not measurable, there is no reason to assume that it would be zero at the deposition potential of any particular metal. This represents an apparent problem regarding the role of the metal/ solution potential difference at equilibrium, MΔS фequil, which, as we have emphasized already, is not measurable. The rate of all electrochemical processes is determined by the gradient of the electrochemical Gibbs energy, not by the gradient of electrostatic potential. Thus, the exchange current density for the different metals is determined by the height of the peak of the electrochemical Gibbs energy at the reversible potential.
The three curves shown in Figure 8 represent schematically three electrode reactions having different values ofΔG0# , and hence different values of the heterogeneous rate constant and the corresponding exchange current densities. The curves in Figure 8 show the effect of overpotential on the shape of the plot of the electrochemical Gibbs energy. Two points should be emphasized.
Figure 9: Schematic plots, showing the variation of the electrochemical Gibbs energy with distance, for systems at equilibrium, having different values of G ̅0and consequently of j0.

1) When an overpotential is applied, the chemical part of the
electrochemical Gibbs energy, ΔG0, does not change, hence all the
change in  , induced by imposing an overpotential, is electrostatic.
Consequently, it is correct to consider only the electrostatic held
created by application of an overpotential as the driving force for ion
transfer, because it is equal to the gradient of, ΔG0, when expressed in
the same units.
, induced by imposing an overpotential, is electrostatic.
Consequently, it is correct to consider only the electrostatic held
created by application of an overpotential as the driving force for ion
transfer, because it is equal to the gradient of, ΔG0, when expressed in
the same units.

2) There is a specific energy of activation for ion transfer across the double layer for each metal considered. Its height is changed by applying an overpotential but a definite energy of activation can be associated with ion transfer, even though it is driven by a linear electrostatic field. The metal/solution potential difference that exists at the reversible potential is one of two terms (the other being ΔG0) that cannot be measured, but determine the numerical value of the reversible potential. The migration of ions is driven only by the electrostatic field created by the overpotential, and given by Eq. (46).
This electrostatic field is represented by the slopes of the straight
lines connecting the initial and the final states in Figure 8. It has a
value of zero for ƞ= 0 and changes with changing overpotential. It cannot
be overemphasized that the driving force is the gradient of the
electrochemical Gibbs energy,  (or the corresponding gradient
of the electrochemical potential
(or the corresponding gradient
of the electrochemical potential  ). Equation (46) is a special
case, in which application of an overpotential creates a situation
in which the gradient of the electrochemical Gibbs energy becomes
equal to the gradient of the overpotential, because the value of the
chemical Gibbs energy is not affected by the overpotential, of course. This makes it possible to calculate the electrostatic field generated by
applying the overpotential and consider the transfer of the metal ion
as a migration. However, the true driving force is the gradient of the
electrochemical Gibbs energy, which in this specific case is equal to
the electrostatic field.
). Equation (46) is a special
case, in which application of an overpotential creates a situation
in which the gradient of the electrochemical Gibbs energy becomes
equal to the gradient of the overpotential, because the value of the
chemical Gibbs energy is not affected by the overpotential, of course. This makes it possible to calculate the electrostatic field generated by
applying the overpotential and consider the transfer of the metal ion
as a migration. However, the true driving force is the gradient of the
electrochemical Gibbs energy, which in this specific case is equal to
the electrostatic field.
It is noted above that one of the unexpected observations concerning metal deposition is that it is often a fast reaction. But what makes some chemical reactions slow, even when the decrease in the Gibbs energy of the overall reaction is negative and rather high? Figure 9 It is the simple fact that, in general, a chemical bond has to be broken in order to make another bond. Regarding electrode reactions, we have already noted that during outer-sphere charge transfer processes no bonds are broken - at most some are rearranged, while in metal deposition the value of ΔG ̅0 for removing the hydration shell is high, because the Gibbs energy of bonding of the water molecules to the central ion is comparable to that of chemical bonds. Hence, outer- sphere charge transfer processes can be expected to be fast, while metal deposition might be expected to be slow. However, there are two ways in which a chemical reaction can be fast, even if there are strong bonds broken in the process of converting the reactant to the product. The mechanism of ion transfer described here makes use of both. One mode may be referred to as the “make-before-break” mechanism. This involves the gradual creation of the new bones, while the old bonds are gradually weakened, in a concerted manner. A nice example of such a process (observed a century ago) is the spontaneous formation of adsorbed hydrogen atoms on nickel and some other metals in contact with molecular hydrogen in the gas phase, as represented by Eq. (47)
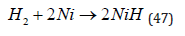
No energy of activation was detected, although the energy of dissociation of molecular hydrogen is quite substantial (4.52 eV).
This peculiar observation was explained by proposing that, as a molecule of H, approaches the surface, the length of the bond between the atoms is increased, thus increasing the Gibbs energy, while some interaction is created between each of the hydrogen atoms and the surface, leading to a decrease in the Gibbs energy. If the latter exceeds the former everywhere along the reaction coordinate, no energy of activation is observed. In the model of ion transfer presented here, a similar interpretation can be adopted: as the ion approaches the surface, the increase in Gibbs energy associated with distortion of the solvation shell can be partially compensated for by interactions between the charge on the ion and the delocalized electrons in the conduction band of the metal, decreasing the total Gibbs energy of the system and leading to a low energy of activation. The other mode involves reactions that advance in small steps from the initial to the final state. For example, the electrochemical reduction of oxygen is a slow process, even in the presence of the best of catalysts known today, as is well known in the field of fuel cells.
Yet, this very same process takes place readily in living organisms, where it occurs in many small steps (assisted, of course, by enzymes acting as catalysts). In the model of ion transfer discussed here, the high rates of metal deposition and dissolution are explained by combining these two effects: The ions crossing the double layer start interacting with the delocalized electrons in the metal before their hydration shell has been removed, in a “break-before-make” type mechanism. This movement occurs in many small steps, each associated with a small degree of solvent rearrangement and a minute change in the effective charge on the ion. Summing it up, outer sphere charge transfer involves the abrupt transfer of an electron in a very short time, of the order of a femtosecond. The molecule is then rearranged to its most stable state by a much slower process taking about 103 fs. In metal deposition the ion carrying the charge moves much more slowly in the direction perpendicular to the electrode surface.
There is no distinct point, at which charge is transferred, it happens all along the way, for a period of the order of 106 fs. If the metal being deposited is divalent, its effective charge is reduced gradually. There is no need to consider the formation of a monovalent intermediate, although there must be a point along the path of the ion where it has a charge of +1.0. This, however, is not a singular point. It is just one of a great number of minute steps where the charge changes, for example from 1.05 to 1.00 and further to 0.95. A caveat regarding the details of the movement of the ions towards the electrode is in place here. In spite of the high electrostatic field applied, (which is equal to the gradient of the electrochemical Gibbs energy, as shown in Eq. (37)), the ions are not moving in a straight line perpendicular to the surface.
The thermal energy of the system gives rise to random motion, superimposed on the motion in the electrical field. Thus, the true physical picture would be represented by irregular motion of the ions, with a component pointing in the direction perpendicular to the surface. During metal deposition the ions could be moving in all directions, sideways, up and down. and even away from the surface. The vector of actual motion will always be the sum of two vectors: one exactly perpendicular to the surface, induced by the electrostatic field, and the other randomly distributed in all directions, as a result of the thermal energy.
Since the first commercialisation in the nineteenth century of electrodeposition noble metals for decorative application, electrodeposition has rapidly grown and is today a widely used technique to produce coatings ramping from decorative to technological applications. However, some main drawbacks of electrodeposition are the environmental impacts and the occupational health risks associated with the exposure to metals and the occupational health risks associated with the exposure to metals and compounds in the electrolyte. Many electroplating processes involve the use of highly toxic chemicals and compounds (e.g. Cd, Pb and Cr6+, cyanide-based electrolytes for Au, brass and bronze deposition). Moreover, from a resource demand perspective, some of the compounds used are associated with limited supplies and even considered critical (e.g. P, B and platinum- group metals). To minimize these issues, the European Union provided a list of critical Raw Materials (CRMs), which is important from a resource supply point of view when choosing the material to deposit. CRMs are those materials that are economically and strategically important for the European economy and with a high-risk associated with this supply.
Ni, Fe and Cr are not included as CRMs, but Co, Nb, P, Mg, Bi, W, etc., are CMRs. For CRMs, recovery and recycling at the end of life can be an important contribution to mitigate the supply risk. Where recycling is challenging and not yet implemented, the use of CRMs can become economically difficult if the supply does not match demand. For the electrolytic bath design, the European Union provided a list of Substances of Very High Concern (SVHCs) or subject to authorization, which are to be avoided. Cr is not listed as a SVHCs, but the compounds containing hexavalent chromium for the electrodeposition of Cr coatings are listed as SVHCs; they are highly carcinogenic and toxic to aquatic life with long-lasting effects. Cobalt salts are also listed as SVHCs because they are carcinogenic and toxic for reproduction. Ni is not listed as SVHC, but is highly allergenic; also, the inhalation during the manufacturing process may lead to respiratory diseases and increase the risk of carcinogenicity, nickel sulphate may also cause cancer by inhalation and it is very toxic to aquatic life. Fortunately, for the moment, there are no restrictions for Fe and Fe compounds when it comes to electrodeposition.
Recyclability aspects are also to be considered for the life cycle step and as a possible mitigation for supply risk. Recycling processes are performed with the aim to extracting one, several or all constituents from a discarded component, i.e. scrap-use products, i.e. products that need further production steps before being ready for an end-use. To mitigate the increasing demand of scarce resource (i.e. CRMs) in emerging technologies (e.g. renewable energy systems and automated processes), it is important to develop and improve the recyclability of scrap material even when containing low amounts of the compound of interest. To make it economically viable, such processes would also require improvements in the collection of sufficiently large quantities of scrap material. For some specific products, a certain recycling rate is already required by legislation, e.g. directories for the battery recycling (Battery directive, 2006/66/EC), end-of-life vehicle (ELV directive) and electronic equipment (WEEE directive). Moreover, recent studies are addressing increased in small concentration. In addition to material recycling, circular economy approaches, e.g. reuse of products and components (when possible), refurbishing and/or remanufacturing, are considered as a contribution to resource efficiency. This approach will result in a reduced demand for replacement.


