info@biomedres.us
+1 (502) 904-2126
One Westbrook Corporate Center, Suite 300, Westchester, IL 60154, USA
Site Map
Received: July 27, 2024; Published: August 20, 2024
*Corresponding author: Pranjul Mishra, Department of Computer Engineering Artificial Intelligence, Marwadi University, Rajkot Gujarat, India
DOI: 10.26717/BJSTR.2024.58.009130
Women are more likely than men to get breast cancer (BC), which causes severe illness and fatality. According to latest data, 684,996 women worldwide died from breast cancer in 2020, and there were 2.3 million new cases of the disease. There is still a sizable gap in the early detection of breast cancer, which is essential for better patient outcomes, despite intensive study on its diagnosis and prediction. Based on the Metabric RNA mutation dataset, this study tries to predict the survival of breast cancer patients using classification techniques in machine learning. To find the best model for predicting breast cancer survival, we preprocessed and normalized the dataset and used six machine learning algorithms (Random Forest, Support Vector Machines, Logistics Regression, K-Nearest Neighbors, Ada Boost and Extra Trees). We measured each algorithm’s performance using the accuracy, precision, recall, and F1 score. Our technique outperforms the other three algorithms with accuracy, precision, recall, and F1 score of 0.79, 0.80, and 0.81 respectively. We also used feature selection approaches to examine the significance of specific genes for predicting breast cancer survival. According to our findings, Logistic Regression & Ada Boost is the best algorithm for the current dataset and can accurately forecast breast cancer survival. The key genes that have been discovered may be used as biomarkers for individualized diagnosis and therapy of breast cancer. The study’s use of the Metabric RNA mutation dataset to illustrate the potential of machine learning in breast cancer survival prediction. The goal of developing tailored treatment plans for breast cancer patients is to improve patient outcomes and lower mortality rates. Our findings may help achieve that goal.
Keywords: Breast Cancer; Survival Analysis; Classification Algorithms; Machine Learning; Metabric RNA Mutation Dataset; Random Forest; Support Vector Machines; Logistic Regression; K-Nearest Neighbors; Accuracy; Precision; Recall; F1 Score; Biomarkers; Personalized Treatment; Patient Outcomes; Mortality Rates
Breast cancer is one of the most common types of cancer in women worldwide, and it continues to be a major public health issue. Although significant advances have been made in the diagnosis and treatment of breast cancer, identifying patients at high risk of disease progression and improving patient outcomes remains a challenge. In recent years, machine learning techniques have emerged as a powerful tool for predicting the possibilities of breast cancer patients. These techniques can analyze large datasets and identify patterns and relationships that may be difficult to detect using traditional statistical methods. Machine learning algorithms can be used to classify patients into different risk groups, based on their clinical and genetic characteristics, and provide personalized treatment plans. In this study we focus on the use of classification algorithms in machine learning for breast cancer survival prediction using the Metabric RNA mutation dataset. The Metabric dataset is one of the largest and most comprehensive datasets available for breast cancer research, comprising gene expression profiles of over 2000, patients with breast cancer. We apply four classification algorithms, including Random Forest, Support Vector Machines, Logistic Regression, and K-Nearest Neighbors, to identify the optimal model for breast cancer survival prediction. These algorithms are widely used in machine learning and have been shown to be effective in predicting patient outcomes in different types of cancer. The primary objective of this study is to develop a model that can accurately prediction.
These algorithms are widely used in machine learning and have been shown to be effective in predicting patient outcomes in different types of cancer. The primary objective of this study is to develop a model that can accurately predict the survival of breast cancer patients, based on their gene expression profiles. We also aim to identify the most significant genes and pathways associated with breast cancer survival, which can serve as potential biomarkers for personalized treatment and improved patient outcomes. In conclusion, this study represents an important step towards the development of personalized treatment plans for breast cancer patients, with the aim of improving survival rates and reducing mortality. The use of machine learning techniques can potentially lead to more accurate and efficient prediction of breast cancer, lead to more accurate and efficient prediction of breast cancer, paving the way for precision medicine in the field of oncology.
Breast Cancer is the most commonly diagnosed cancer and a leading cause of cancer death among women worldwide [1]. The survival rate of breast cancer patients is directly proportional to the stage at which the cancer is detected. Early detection of breast cancer has the potential to significantly improve the insight of the disease [2]. Hence, the identification of biomarkers associated with breast cancer survival has been an active research area in recent years. In the past, traditional statistical methods have been used to identify prognostic biomarkers in breast cancer. However, the complexity and heterogeneity of the disease, as well as the availability of large-scale-genomic data, have led to adoption of machine learning algorithms in the field of breast cancer research. These algorithms are capable of handling high-dimensional data and detecting complex patterns that are not easily recognizable by humans. Several studies have been conducted using machine learning algorithms to predict the survival of breast cancer patients. One such study utilized the Metabric dataset, which consists of 1980 breast cancer patients, to identify prognostic biomarkers associated with breast cancer survival [3]. The study used a Random Forest algorithm to classify patients into high and low risk groups based on gene expression data. The results shows that the Random Forest algorithms was able to identify a set of genes that were significantly associated with breast cancer survival. Another study by Wang, et al. used a Support Vector Machine (SVM) algorithms to predict the survival of breast cancer patients using gene expression data from Metabric dataset [4] and several genes were identified as potential prognostic makers, including ANKRD11, RPLP1, and SF3B3.
The study compared the performance of SVM with that of COX Proportional hazards regression, which is a traditional statistical method used for survival analysis. The results shows that the SVM algorithm outperformed the Cox proportional hazards regression in terms of predictive accuracy. Deep learning algorithms have also been used to predict survival of breast cancer patients. A study used a Convolutional Neural Network (CNN) to predict the survival of breast cancer patients. Other studies have used the Metabric dataset to compare the performance of different machine learning algorithms in predicting BC survival, and SVM was found to be the most accurate [5]. While these studies have made significant contributions to our understanding of BC survival and the potential for machine learning algorithms in predicting BC outcomes, there are still several challenges that need to be addressed. Ones such challenge is the availability of high-quality data, as machine learning algorithms are only as good as the data they trained on. Another challenge is the need for interpretability, as it is essential to understand the underlying biological mechanisms of the genes and pathways identified by these algorithms. The use of these algorithms has the potential to improve the accuracy of prognosis and aid in personalized treatment decisions. However, further validation and verification of these results is necessary before the adoption of these algorithms in the clinical setting.
In conclusion, machine learning algorithms have shown great potential in predicting BC survival and identifying significant genes and pathways associated with BC outcomes. The Metabric dataset has been a valuable resource for researchers studying BC survival and several studies have used this dataset to develop accurate predictive models. While there are still several challenges to be addressed, the future looks promising for the application of machine learning algorithms in BC research. Before we talk about technological implementations lets understand the biology of major causes which foreshadow possibilities of the disease.
Understanding Breast Cancer
Breast cancer is a heterogeneous disease that originates from the cells of the breast tissue. The development of breast cancer is a complex process that involves accumulation of genetic and epigenetic alterations in normal breast cells, leading to uncontrolled growth and progression of malignant cells [6]. Breast cancer is classified into different subtypes based on the molecular and genetic characteristics of the tumor cells. These subtypes include luminal A, luminal B, HER2-positive, and triple-negative breast cancer [7]. It is a kind of disease in which growth of breast cells is uncontrollable although there are various kinds of breast cancer but its nature depends on the fact which kind of cell in breast turned into cancer. It is made up of three main parts- connective tissues, ducts and lobules and can begin in any part of breast. Majorly it begins in ducts of lobules, can spread outsides the breast through blood and lymph vessels which is also said to have metastasized. Most of the common kinds of breast cancer are- Invasive ductal carcinoma where cancer begins with ducts and Invasive lobular carcinoma where it begins with lobules. One of the important genetic mutations that have been implicated in the development of breast cancer is the mutation in the BRCA1 and BRCA2 genes [7].
These genes are involved in the regulation of the cell growth and DNA repair. Mutation in these genes can lead to the accumulation of genetic alterations and increase the risk of developing breast cancer [8]. The molecular profiling of breast cancer has revealed a significant heterogeneity in the gene expression and molecular characteristics of different subtypes of breast cancer. The identification of these molecular signatures has led to the development of targeted therapies that specifically target the molecular pathways that are dysregulated in different subtypes of breast cancer [9]. Overall, the biology of breast cancer is complex and it involves the interplay of multiple genetic and epigenetic alterations that leads to the development of novel and effective therapies for the treatment of this disease. Understanding the biology of breast cancer and the different subtypes is critical for developing effective treatment strategies. Before we discuss about technical terms let’s try to draw your attention towards breast cancer screening process and issues related to it.
Breast Cancer Screening
Mammography proved to be an effective tool for screening, detecting tumors, however false negative mammograms have been reported to be 4% to 34% and results in poor possibilities for the patient [10]. Females with dense breast have dense tissue which leads to false interpretation. Mammogram is not always helpful for all the women having breast cancer, as screening of mammogram totally depends on women’s overall health. Generally, mammogram screening is avoided by the younger women as due to high risk of radiation, overdiagnosis and overtreatment. It becomes very important to detect breast cancer in early stage and classify them as per their stages to have an analogy of an approach towards the treatment methodology, as most of the people fail to detect disease before it becomes vital, chronic and dangerous. Artificial intelligence and Machine Learning has played a major role for pre diagnosis as it is a powerful tool, which enables computers to have human-like intelligence and improvises its efficiency and accuracy over the time.
Machine Learning Framework
Machine learning is a data-driven approach that aims to develop models that can make accurate predictions on unseen data. In this research paper, we aim to apply various Machine learning algorithms to perform classification of the Metabric RNA mutation dataset and predict the survival chances of patients with breast cancer. These techniques have shown great potential in aiding the early detection of breast cancer, providing personalized treatment recommendations and predicting outcomes based on patients’ data. In this section, we present the machine learning framework used for the breast cancer survival analysis research, which involved classification algorithms. The goal of our study was to develop a machine learning framework to analyze the survival rate of breast cancer patients based on gene expression and RNA mutation data.
Dataset: We used the Metabric RNA dataset, which consists of RNA sequencing and clinical data from 1980 breast cancer patients. The dataset includes 1904 gene expression features and each patient has survival outcome ranging from 0 to 198 months. The framework consists of several key steps that involve data preprocessing, feature selection, model building and evaluation. Mentioning all the features is not possible but few of them are mentioned here to provide an idea about the dataset. It will be clearer further as we will discuss through visualization and math work.
Dataset Index-
[‘patient_id’, ‘age_at_diagnosis’, ‘type_of_breast_surgery’, ‘cancer_ type’, ‘cancer_type_detailed’, ‘cellularity’, ‘chemotherapy’, ‘pam50_+_claudin-low_subtype’, ‘cohort’, ‘er_status_measured_by_ ihc’, ………………... ‘mtap_mut’, ‘ppp2cb_mut’, ‘smarcd1_mut’, ‘nras_mut’, ‘ndfip1_mut’, ‘hras_mut’, ‘prps2_mut’, ‘smarcb1_mut’, ‘stmn2_mut’, ‘siah1_mut’]
Data Processing and Visualization: As the dataset is high dimension dataset that contains gene expression data of 1980 breast cancer patients. Preprocessing involves cleaning the data, handling missing values and standardizing the features, essentially removing the irrelevant and redundant information that may affect the performance of the model. The standardization of features is done to ensure that all the features are on the same scale to prevent bias towards any feature. Figure 1 represents the percentage of null/missing values by the formula.
Once the null/missing value percentage was found we scaled the dataset by standard scaling using the formula:
where;
• x is a single data point in dataset
• μ is the mean of the dataset
• σ is the standard deviation of the dataset and
• z is the standardized value of x.
Figure 1

Figure 2

Figure 2 represents the target data after standard scaling by a box plot which provides a clear picture of distribution of numerical attributes after standardization, From the above graph we found that some variables have outliers such as chemotherapy, lymph nodes examined as positive, mutation count, tumor stage and tumor size.
Figure 3

Feature Selection: Now once we scaled the dataset, we performed clinical data analysis to gain more understanding of the data and to classify them. Hence, we visualized various features like age at diagnosis, lymph node examined as positive, mutation count, overall survival month, tumor size and Nottingham prognostic index vs overall survival labelling “green” color as those who survived and “red” color as those who died. Figures 3a-3f will provide a clear idea about the same by visualizing it. We found out that patients who survived have bimodal distribution and those who died have left skewed distribution. For patients whose lymph nodes were examined as positive, we found that both the patients who survived and died have right skewed distribution, hence this feature does not contain dependency as a feature. Patients who survived as well as died have right skewed distribution. We concluded from the graph that patients who survived have bimodal distribution and those who died have right skewed distribution. From the above graph we concluded that patients who survived and died have right skewed distribution. From the above graph, we can observe that both the patients have multimodal distribution. We found out some more interesting conclusions by analysis that the difference between the attributes that is survival time and age at diagnosis, patients who were older and when diagnosed with breast cancer were more likely to not survive. Also, duration from the time of the intervention to death or to current time is longer in the patients who survive. That means that patients are either dying early from breast cancer or surviving. And while analyzing about the patients those who lived, died because of breast cancer and those who died due to other diseases with respect to the age of diagnosis we found that patients who survived from breast cancer are more likely to survive longer compared to patients who died because of breast cancer and person who died because of other diseases. Patients with breast cancer are more likely to die faster than a person who died because of other diseases (Figure 4). In addition to our analyzation, we did analysis of tumor size distribution with respected to tumor stage. We found out that:
Figure 4

It can be concluded and observed from the figure above that
1. At stage 0:
Patient who died have same tumor size around 60-70. Patients
who survived have tumor size between 15-35.
2. At stage 1.0:
Patients who died and survived has relatively same tumor size
distribution, except 1 died patients whose tumor size > 150.
3. At stage 2.0:
Patients who survived has a little bit difference in tumor size distribution
and has almost the same median.
4. At stage 3.0:
• Patients who died have variety of tumor size from around
10 to more than 175.
• Patients who survived have tumor size between 20 and 100.
5. At stage 4.0:
• Patients who died have tumor size between 20-70
• Patients who survived have same tumor size, around 60-70.
Also, we found out that the distribution of number of positive lymph nodes for died patients is wider than survived patients. Thus, to gain more understanding for classification from data visualization we performed analyzation of the distribution of treatment and survival of patients we concluded as a result that patients who had undergone chemotherapy treatment, the difference between died class and survived class is larger for patient with chemotherapy compared to patients without chemotherapy. Died class patients without Chemotherapy were large in number, more than 800. Patients who had undergone through Hormonal therapy the difference between died class and survived class is quite large for patient with hormonal therapy compared to patients without hormonal therapy. At last, the patients who had undergone Radio therapy the difference between the two classes is quite high and the number of patients died in this therapy is highest as compared to others. This can be represented more clearly with a Venn diagram (Figure 5).
Figure 5

From the above graph we concluded most of the patients get combination of chemotherapy and hormonal therapy treatment followed by radio therapy and chemotherapy. Radio therapy is the most often given treatment to the patients in terms of sole treatment, and no patients are given combination of radio therapy and hormonal therapy. We also analyzed distribution of histopathological class and survival as a feature of classification (Figure 6). From the above diagram we found out that the patient in died class is always higher than in survived class except for class 1.0. The difference of number of patients both died and survived class for class 1.0 is high compared to other class. In addition to all these analyzations, understanding the correlation between the attributes is also very important process for feature selection and understanding the dependency of attributes. The figure below will provide a representation of the correlation (Figure 7).
Figure 6

Figure 7

It is clearly found that there are some attributes which have positive and negative correlations with other attributes. Besides if we observe correlation between attributes and overall survival, we found that all the variables which have negative correlation with overall survival is weakly correlated (Table 1). In comparison with baseline number of patients who had no treatment was 289 and proportion of survival with no treatment was 0.381 and the baseline proportion of survival in all groups was 0.421. In conclusion the proportion of survival with no treatment is quite close to the baseline proportion of survival in all group. Characteristics of the patients in the data, the mean age of diagnosis was almost 61 and the most occurring tumor stage was 2 and most occurring histopathological type is 3 and mean of tumor is 26mm with survival probability of 0.42 that is less than 50%. Apart from this clinical attribute distribution we processed the data to find maximum and std in each column by z- score to understand the genetic distribution and to plot the heatmap we found the maximum value possible in genetic data is 18.6351 and minimum value possible in genetic data was -6.4387. with number of outliers in top 10 genetic features. The diagram below represents the Gene Expression heatmap (Figure 8). Using this heatmap we reached to a conclusion that all of the genetic attributes have relatively the same distribution shape for two classes which we discussed previously that is dead and survived. Also, we derived the correlation of genes with the overall survival using standard deviation as a measure. The graph below will provide a clear representation of the correlation (Figure 9).
Table 1: Statistical Summary of Categorical attributes in the Data frame.

Figure 8

Figure 9

The max correlation was 0.194 while minimum correlation of genetic attributes was -0.186 with mean correlation of 0.004. Most of the attributes have very weak correlation with target attributes and were in range between -0.02 and 0.02. Also, relationship of genetic attributes and outcomes based on two classes (survival and dead). We found some genes had much more mutations than other genes. For example: PIK3CA (40.1% of the samples) and TP53 (35.4%) dominated the mutation landscape. Only five other genes harbored coding mutations in at least 10% of the samples: MUC16(16.8%), AHNAK2(16.2%), SYNE1(12%, KMT2C (11.4%) and GATA3(11.1%).
Model Building (Training and Testing): After feature selection and analyzation via visualization and numerical methods is done the next step is model building which involves selecting a suitable algorithm to be built for classification. The algorithms used in this study include KNN, Logistic Regression, Decision Tree, Random Forest, Extra Trees, Ada Boost and SVC and we compared them to find the best suitable algorithm, by tuning the hyper parameters which optimizes the model’s performance and performing cross validations to avoid overfitting of the data. We will discuss one by one each along with the math work for each algorithm.
Logistic Regression: It is used to predict the predict the probability of an event occurring based on the values of input variables [11]. Here we used to predict the survival of a patient based on our features. The logistic function used in logistic regression is:

Here, b0 is the constant, b1 to bn are the coefficients of input variables, and x1 to xn are the input variables.
Decision Tree [12]: This algorithm proceeds by calculating the entropy of a given set S (features of the dataset) and the entropy is given by the formula:
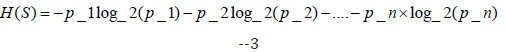
where p_1, p_2, ..., p_n are the proportions of each class in the set S.
The information of an attribute is given by with respect to set of each class:

where S_v is the subset of S for which attribute A has value v.
Random Forest Algorithm [13]: The random forest algorithm builds multiple decision trees, each trained on a subset of the data and a random subset of the input features. The final prediction is the mode of the predictions of all the trees. The mathematical formula for random forest is:

where y is the predicted output, f(x) is the forest of decision trees, x is the input variables, and ε is the error term.
Support Vector Machine [14]: Support Vector Machine (SVM) is a supervised learning algorithm that can be used for classification or regression analysis. The goal of SVM is to find the best separating hyperplane between the two classes in the feature space. The mathematical formula for SVM is as follows:
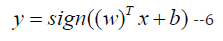
where y is the predicted output, x is the input vector, w is the weight vector, b is the bias term, and sign () is the sign function.
K-Nearest Neighbors (KNN): K-Nearest Neighbors (KNN) is a popular machine learning algorithm used for classification and regression tasks. In the context of the breast cancer survival analysis research topic,
KNN can be used to classify patients into high-risk and low-risk groups based on their gene expression profiles.
The mathematical equation for the KNN algorithm is as follows:
Given a training dataset of N samples with their corresponding feature vectors x_i and class labels y_i, the KNN algorithm can be used to classify a new sample x_test by finding the K closest training samples to x_test in feature space. The class label for x_test is then assigned based on the majority class among the K nearest neighbors. The distance between two feature vectors x_i and x_j can be computed using any of the standard distance metrics, such as the Euclidean distance or the Manhattan distance. For example, the Euclidean distance between two feature vectors x_i and x_j can be computed as follows:
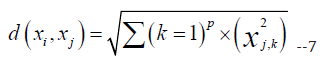
where p is the number of features in the dataset. The choice of the value of K is an important parameter in the KNN algorithm [15]. A larger value of K can lead to a smoother decision boundary, but may result in higher bias and lower variance. A smaller value of K can lead to a more complex decision boundary, but may result in higher variance and lower bias. In the context of the breast cancer survival analysis research topic, KNN can be used to classify patients into high-risk and low-risk groups based on their gene expression profiles. The KNN algorithm is computationally efficient and easy to implement, but it may not be suitable for datasets with a large number of features or a large number of samples. The choice of the value of K is an important parameter that should be carefully tuned to optimize the performance of the algorithm.
Extra Trees: Extra Trees algorithm, also known as Extremely Randomized Trees, is a machine learning algorithm that can be used for classification and regression tasks. It is an ensemble method, similar to Random Forest, that constructs multiple decision trees and aggregates their predictions to make the final decision. However, Extra Trees are different from Random Forest in that they use a random threshold for each feature rather than finding the optimal threshold. This results in a faster training time but may increase variance in the model [16].
The mathematical equation for Extra Trees algorithm is as follows:
I. Randomly select subsets of features of size k out of p total
features.
II. For each subset, perform the following steps:
a. Randomly select a threshold value for each feature in the
subset.
b. Split the data based on the selected thresholds.
c. Compute the impurity of the split using a predefined metric,
such as Gini impurity or entropy.
d. Choose the best split among all features and thresholds.
III. Aggregate the predictions of all decision trees to make the
final prediction.
In step 1, the algorithm selects k features randomly, which reduces the correlation among the trees and improves the performance of the model. In step 2, the algorithm randomly selects threshold values for each feature in the subset and splits the data based on these thresholds. This randomization increases the variance in the model, which can lead to overfitting. However, this is compensated by the aggregation step in which the predictions of all decision trees are combined to make the final prediction. The Extra Trees algorithm is a computationally efficient and powerful algorithm that can be used for classification and regression tasks. Its randomization strategy makes it less prone to overfitting and improves the performance of the model.
Ada Boost: AdaBoost (Adaptive Boosting) algorithm is a popular ensemble learning technique that combines several weak learners into a strong learner. It can be used for both classification and regression problems. AdaBoost algorithm works by iteratively training weak learners on the same dataset with a different weight distribution. The weak learner misclassification rate is used to update the weight distribution of the dataset. The AdaBoost algorithm returns the weighted sum of weak learners to obtain the final classification or regression [17]. The mathematical equation for AdaBoost algorithm is as follows: Given a training set of N examples (X, Y), where X is the feature matrix and Y is the response vector, and T is the number of iterations or weak learners to be trained. In AdaBoost algorithm, each weak learner is trained on a subset of training examples D, where |D| < N, with a weight distribution W. At each iteration t, the weak learner ht(x) is trained using the weighted data (D, W) to minimize the error εt. The weight of the weak learner αt is then calculated using the error εt. The weight distribution W is updated and the next weak learner is trained on the new weighted dataset. Finally, the AdaBoost algorithm returns the weighted sum of the weak learners to obtain the final classification or regression, which can be represented as:
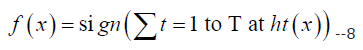
where, αt is the weight assigned to the weak learner ht(x) and sign is a function that returns +1 for positive values and -1 for negative values. The justification for AdaBoost algorithm lies in its ability to improve the accuracy of weak learners by updating the weight distribution of the training data. The weight distribution places more emphasis on misclassified examples in each iteration, forcing the weak learners to focus on difficult examples. As a result, AdaBoost algorithm creates a strong learner by combining several weak learners that can accurately classify or regress the data.
Model Evaluation and Results: We used precision, recall, F1 score and support for model evaluation and we change hyperparameters each time we performed testing.
Classification Only with Clinical Attributes: We found that logistic regression model performed the best with accuracy of 0.777 and AUC of 0.777 and KNN having the lowest accuracy of 0.64 and AUC of 0.62. The below graph will represent a clear picture of model performance (Figures 10 & 11). Also, after applying Grid Search with Random Forest Classifier and Extra Trees. We achieved model accuracy of 0.738442 for Random Forest and an accuracy of 0.726363 Extra Tree Classifier Model.
Figure 10

Figure 11

Predicting without the Time Related Column (Overall_survival_ month): Without survival time duration, the predictor for overall survival performs worse than predictor with survival time duration this wasn’t a good decision and should be avoided (Figures 12 & 13), After applying grid search, we didn’t find any scalable improvement.
Figure 12

Figure 13

Classification with Only Genetic Attributes: With this parameters model performed more better, Logistic regression performed best with accuracy of 0.75 and KNN remains at lowest with an accuracy of 0.63 (Figures 14 & 15). After applying grid search on Random Forest Algorithm and Extra Tree Algorithm the accuracy obtained for both the algorithms was coincidently the same that is 0.6781.
Figure 14

Figure 15

Breast cancer is one of the most common cancers affecting women globally. Early detection and treatment of breast cancer is vital for improving patient survival rates. In this study, we used the Metabric RNA mutation dataset and machine learning algorithms to predict the survival rate of breast cancer patients based on their genomic profile. Based on the analysis performed on the Metabric RNA mutation dataset, it can be concluded that logistic regression was the best performing algorithm with 77% accuracy. KNN, on the other hand, had the lowest accuracy of 63%. The other algorithms, including decision tree, random forest, extra trees, Ada boost, and support vector machine, had moderate performance as per the ROC curve obtained. Further analysis revealed that, apart from BRCA1 and BRCA2, PIK3CA and TP53 had a significant impact on mutations. This information can be used to develop more accurate predictive models for breast cancer possibilities and help in the early detection and treatment of the disease.
The findings of this study can potentially lead to the development of more targeted and effective treatments for breast cancer patients, ultimately improving their survival rates and overall quality of life. In conclusion, machine learning algorithms can be valuable tools for predicting breast cancer survival rates. Our study highlights the importance of early detection and treatment of breast cancer, particularly for patients with genetic mutations associated with poor survival rates. These findings could lead to the development of personalized treatment plans for breast cancer patients, which could potentially improve patient outcomes.
The study presented in this research paper has utilized machine learning algorithms to analyze the Metabric RNA mutation dataset to predict breast cancer survival. The results obtained from this research can be used for early detection of breast cancer, improving the accuracy of breast cancer diagnosis, and determining the most effective treatment approach. However, there is still scope for future research in this area. One possible area for future research could be to investigate the impact of other genetic markers on breast cancer survival, which may provide additional insights for improved forecasting. Additionally, using more extensive datasets, such as genomics data from other cancers, could help identify new biomarkers to better predict the survival of cancer patients [18]. Furthermore, incorporating clinical data such as age, weight, and previous health issues, could improve the accuracy of the prediction models [19].
Another future research direction could be to focus on developing an ensemble model that combines several machine learning algorithms to create a more accurate prediction model [20]. Additionally, conducting a longitudinal study on breast cancer patients could help in understanding the time progression of breast cancer and providing personalized treatment recommendations based on individual genetic and clinical profiles. In conclusion, the future scopes of the research topic include integrating more extensive genomic and clinical data, employing ensemble models, and conducting longitudinal studies to provide better insights into breast cancer survival. The findings of such future research could provide an enhanced understanding of breast cancer and improve its diagnosis, possibilities, and treatment.


