info@biomedres.us
+1 (502) 904-2126
One Westbrook Corporate Center, Suite 300, Westchester, IL 60154, USA
Site Map
Received: July 08, 2024; Published: July 22, 2024
*Corresponding author: Ermias Melku Tadesse, Department of Information Technology, Informatics College, Kombolcha Institute of Technology, Wollo University, Kombolcha, Ethiopia
DOI: 10.26717/BJSTR.2024.57.009045
Vehicular ad hoc networks (VANET) are a subset of mobile ad hoc networks used to communicate between vehicles and infrastructure. During vehicular congestion communication, nodes compete to acquire channels, causing the channels to become congested. The congestion on the vehicle network results in increased delay and packet loss, resulting in reduced VANET performance. To address this problem, we developed a load-aware and priority adaptive traffic congestion control method in vehicular ad hoc networks (VANETs). The proposed scheme identifies less-congested road segments based on the network’s load and reduces traffic congestion by suggesting other routes between nearby roadside units (RSUs). This research aims to improve the efficiency of the vehicular environment by utilizing the movement of vehicles with (RSUs) and sharing the traffic load between them. Simulation results demonstrate the effectiveness of the proposed protocol in reducing congestion and enhancing the overall performance of VANETs. To validate the proposed algorithm, we have implemented and tested the proposed algorithm using Network Simulator 3 (NS3) for Vehicle-to-Vehicle (V2V) and Vehicleto- Infrastructure (V2I) communication scenarios and computed the performance of the algorithm on different parameters of the network. The simulation result of the proposed load aware and priority adaptive traffic congestion control method in VANET improved the packet delivery ratio, packet lost ratio, and end-to-end delay by 96%, 4.1%, and 1102 milliseconds, when compared to TDCCA value of 92%, 5.7%, and 1154 milliseconds, respectively.
Keywords: Ad Hoc Network; Congestion Control; Load Aware; Priority Adaptive
Abbreviations: VANET: Vehicular Ad Hoc Networks; NS3: Network Simulator 3; V2V: Vehicle-to-Vehicle; V2I: Vehicle-to-Infrastructure; MANET: Mobile Ad hoc Networks; FANET: Flying Ad hoc Networks; ITS: Intelligent Transportation Systems; TDCCA: A Traffic Density-Based Congestion Control; CAM: Congestion Aware Message
An ad hoc network is a collection of heterogeneous network nodes that construct ephemeral networks without the requirement of a central administration or infrastructure. Using shared wireless channels, nodes on a wireless ad hoc network can connect directly. The researchers categories ad-hoc networks into three main categorize: Mobile Ad hoc Networks (MANET), Vehicular Ad hoc Networks (VANET), and Flying Ad hoc Networks (FANET) [1]. Ad-hoc networks are used in many applications such as complex military system usage applied in resonance and attack roles, and civilian applications such as rescue missions and firefighting. Vehicles act as nodes in a VANET, sending and receiving data without the need for a physical link. The IEEE committee established the IEEE 802.11p standard for VANETs, recognizing the importance of vehicle ad hoc networks for delivering safety-related applications in Intelligent Transportation Systems (ITS) [2]. Everyone goes from one location to another, whether for work, business, study, research, or pleasure, using numerous modes of transportation. Vehicles are one of the most widely utilized modes of transportation worldwide, and the leading cause of traffic accidents. Many people seriously injured or killed in road accidents [3].
One of the main causes of road traffic congestion in VANETs is the lack of centralization and the frequent changes in the network structure. Congestion is caused by a variety of circumstances, including decentralization, changes in topology, excessive demand, signals, work zones, incidents, weather, and events. Because of this, traffic regulation becomes a difficult topic in an automobile setting. In recent times, congestion control methods have become increasingly important due to the growing demand for high-speed and reliable network connectivity. As a result, there has been a surge in research efforts to develop more effective congestion control mechanisms. Therefore, this research aims to design a congestion control method for vehicular ad hoc networks to control congestion effectively between V2I communications. The algorithm efficiently detects the congestion and suggests the best non-congested route for the vehicles to avoid the congestion. The remaining parts of this article are arranged as follows: A related work on VANET congestion control is presented in Section II. Section III presents the specifics of the suggested algorithm's and how it chooses the optimal rout index.
A load-aware and traffic-congestion-control algorithm's implementation on an intersection road, together with simulation results and a comparison with the resent related work using tabular and graphical representation, was discussed in Section IV. Lastly, the conclusion was covered in Section V.
Increasing quantity of cars on the streets is leading to issues with traffic. To enable seamless traffic movement, vehicles were under constant surveillance. Various academics attempted to perform various studies to solve the problem of traffic congestion by considering vehicle routing. A Traffic Density-Based Congestion Control (TDCCA) Method for VANETs [4] presents a vehicle ID-based congestion aware message (CAM) for beacon signals in the vehicle environment. The impacted car, which is involved in the traffic accident, sends the warning message to the other forwarder vehicle and RSU to alert them of the current situation of the lane in Vehicle to Infrastructure (V2I) communication. As a result, the next car on the road makes a different decision to prevent traffic congestion and accidents. However, the algorithm does not consider further traffic conditions as its computation method is based on the current travel time at road segments and the number of queue lengths on the road. The HFSA-VANET is proposed [5] by an ensemble-based machine-learning technique used to forecast VANET mobility. It uses a hybrid metaheuristic algorithm combined with Ensemble Learning to reduce latency.
Comparative analysis between HFSA-VANET and CRSM-VANET showed a 33% drop in delay, an 81% decrease in energy consumption, and an 8% increase in throughput. It has been implemented in MATLAB and NS2. Two commonly used techniques were analyzed. Both use a sender-oriented relay selection method and aim to optimize channel bandwidth. The connection outperforms the longer distance method in terms of message reachability and speed difference. It is also more resilient to mobility speed disparities. However, Speed differences affect VANET messaging systems' performance. A Distance-Based Routing Scheme was proposed by the researcher [6]. The primary idea behind this routing method is to avoid an accident at the intersection, as anonymous vehicles frequently emerge from the opposite side of the road and cause collisions at the intersection. This accident-prevention technique begins by determining the vehicle's location and estimating the distance between vehicles approaching the intersection.
Following the calculation of each vehicle's location, all vehicles will receive information on the location of other vehicles approaching the intersection. As a result, the car with the shortest distance will issue a distance and location notice to other vehicles. Less traffic congestion was obtained as a result of the suggested strategy, which helps to prevent or decrease traffic accidents. However, the proposed routing scheme's reach is limited, and it has scalability concerns. Furthermore, it only works at an intersection and a ring road, where three different routes join at a single point.
Load-Aware and Priority Adaptive Traffic Congestion Control (LAPCC) Algorithm
In this section, we proposed load-aware and priority adaptive traffic congestion control (LAPCC) algorithm and discussed the architectural design for the proposed method. In a VANET, the position of some vehicles may have better access to RSU at a location where they may have a higher frequency of relaying requests compared to other vehicles. For this purpose, each vehicle forwards road segment information and the RSU calculates some values for itself that are referred to as congestion route index. In the proposed work, we divided the overall process into three main stages as shown in (Figure 1). Figure 1 shows the concept of Load Aware Priority Adaptive Congestion Control algorithm. The algorithm is designed to address the issue of traffic congestion in VANETs bay balancing the load among all the vehicles. The algorithm is divided into three stages: initialization, congestion state representation, and congestion suggestion process. In the initialization stage, the network model is represented by modelling the communication of the nodes on the road and how they communicate with other components. In the congestion state representation stage, the load factor is used to identify whether the network is congested or not. The load factor is calculated based on information such as the speed of the vehicle, the nearest neighbor of the vehicle, and the distance between vehicles. In the congestion suggestion process stage, each RSU calculates the congestion route index (CRI) based on the road segment information forwarded by each vehicle. The RSU broadcasts the CRI value to its neighbor RSUs, and the RSUs compare the CRI values to suggest the road segment that has a better index in the network. Then, a road segment with a good value is suggested for the route.
Figure 1

Stage 1: Initialization: Figure 2 shows the concept of the network model implemented in this proposed work. On this road, multiple vehicles have a direct relationship with neighbor nodes within the network. To identify the nearest neighbors, queue length, received signal strength indicator (RSSI)-based distance measurements and speed of the vehicles are used. During the communication two types of messages are forwarded from the vehicle to RSU and vice versa i.e., beacon message and emergency message. The beacon message ensures that the V2V communication and V2I are always in connection. By using a beacon message, the vehicle and the RSU unit exchange information to keep in touch. The emergency message broadcasted during the traffic enters into a congested state. Besides these, the RSU communicates with the nearest or neighbor RSU to get the congestion level of the road segment in the congested network environment.
Figure 2

Stage 2: Congestion State Representation:
a) Load Factor
Since the vehicular network channel state is changing continuously which affected by the temporal time of arrival of the vehicles. To identify the congestion state, we used a Load-based Active Queue Management (AQM) scheme [7] for the detection of congestion level on the network extracted from the Load_Factor of node. The load-based AQM is used to increase high utilization with less delay and packet loss regardless of the number of nodes. The load-based information is used to increase or speed up the response time. By using the link capacity of the road at a given time concerning the difference between input rate and output rate we can gain the load factor. The Load Factor is defined by the following Eq. (1):
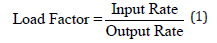
Where Input_Rate is the amount of data arrived at the node and Output_Rate is the link capacity for the queue in the congested network. As the authors stated [7]“… the queue length is a function of load and queue length gives more stable congestion indication.” The node calculates the Load_Factor of the queue, some of the information such as traffic accidents, road problems like congestion, and vehicle reversing are examples of the data packets shared between vehicles on the road.
b) Load Factor Threshold
The VANET commonly confront congestion due to road traffic over-burdening links beyond their capacity. The congestion limit value for a load calculation is the upper limit of information allowed for input/output from a total number of vehicles to RSU. During information transfer, the Output_Rate is fixed based on the link capacity of the vehicular network we use around 30Mbps. The acceptable maximum bandwidth on VANET as stated in[4] for a vehicle can move with a speed of up to 200km/h covering a communication extend of 300 m which is amplified up to 1000m with data rates of 3-30 Mbps. By using these values, the threshold value lies between 0 and 1. The threshold value as it goes forward to 1, indicates congestion happens on the road. Thus, in the proposed technique when the load of the network link capacity reaches these limits the congestion process is initiated, when the load reaches total link capacity it initiates the congestion process by identifying neighbor nodes' congestion index as stated in the next stage. For all Load_Factor Lf, the threshold is shown in Eq. (2).
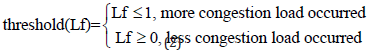
The equation defines a threshold value Lf that determines the level of congestion in a network based on the Load Factor parameter. If the Load Factor value is less than or equal to 1, it means that more congestion load has occurred in the network, and the congestion level is high. On the other hand, if the Load Factor value is greater than or equal to 0, it means that less congestion load has occurred in the network, and the congestion level is low. The threshold value L is used to trigger the congestion control suggestion process when the Load Factor value reaches a certain level.
c) Nearest Neighbors
In VANET communication, the presence of neighboring vehicles plays an important role. But the increase in neighbors results in higher congestion on the network. In The proposed work, each vehicle in the network keeps a list of all possible neighbor nodes that are in the transmission range. The queue length can be used to define the number of vehicles in a congested network. Eq. (3) shows the top level for a node within a network of n vehicles, as follows:
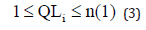
Some vehicles on the network are relatively placed closer than other neighbors. Such nodes can be considered as nearest neighbors (NN). Therefore, to get the physical distance we consider the received signal strength indicator (RSSI) mechanism. This RSSI mechanism uses the Pathloss model Frii's free space propagation model. Because, in the VANET environment, there are several causes to occur pathloss such as reflection, absorption, and deflection on the transmission medium. It has a significant advantage in measuring the transmission from transmitter to receiver. An RSSI-based [8] distance value is calculated and is used to determine the set of neighbor nodes. The RSSI-based distance is calculated based on Eq. (4)

This equation is used to calculate the distance between two nodes in a VANET network based on the received signal strength indicator (RSSI) mechanism. The RSSI-based distance is calculated by measuring the strength of the signal received by the receiver node from the transmitter node. The distance between the two nodes is then calculated using the above equation. Where denotes the transmission power, and Gi and Gj denote the antenna gains of nodes i and j, respectively. Nodes i and j are the transmitter and receiver, respectively. The λ indicates the wavelength (meter) of the transmission signal.
• Algorithm 1: Proposed Method Algorithm
INPUT: Vehicle Speed (VS), Nearest Neighbor (NN), distance (d), Road Segment (RSid), destination id (destid)
OUTPUT: Load_Factor
1. Procedure LAPCC_Method (VS, NN, d).
2. Vehicle computes NN AND distance d between node.
3. Vehicle forward < NN, d, destid, VS> to RSU.
4. RSU extract information.
5. For each vehicle in RS
6. RSU calculates Load_Factor based on Eq. (1).
7. If Load_Factor >= threshold (Lf) //Maximum threshold is 1 based on Eq. (2).
8. Congestion Control Suggestion Process Trigged ← Algorithm 2.
9. Goto step 5.
10. End if.
11. End for.
12. End procedure.
Stage 3: Congestion Suggestion Process:
a) Road Side Unit (RSU) Component
The Roadside Units (RSUs) serve as repositories for network information, with their stored data being subject to regular updates through communication with neighboring vehicles. Whenever (RSU) is presented with any inbound beacon messages emitted from the source vehicles relative to it, it is incumbent upon (RSUs) to determine the congestion threshold and the optimal routing pathway. The dissemination of information from (RSU) to other nodes is accomplished through the mechanism of route sharing, which contains essential parameters such as the source information, destination, distance, sequence number, route index and others. In the algorithm under consideration, upon receipt of a message from the sender, the (RSU) proceeds to analyze the state of network congestion. RSUs determine the congestion level in the network through Load_Factor. The route congestion index finds how long it takes for messages to travel back and forth. If the index value is high, it means there's more traffic in the network.
b) Congestion Route Index
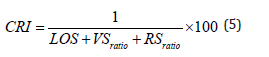
On the proposed system each RSU calculates the congestion route index (CRI) probability of the road segment at time t. the CRI is proportional to parameters taken from the sum of the Level of Service (LOS) and road segment ratio (RSratio) nearest neighbor (NN) and speed as shown in Eq. (5).
The road segment level of service (LOS) represents the quality of service of the urban road. The LOS value is derived after calculating the Average vehicle speed ratio (VSratio) from Eq (6).
c) Vehicle Speed
The VSratio is used to identify the ratio of the total delay on a vehicle on a congested road and the total time of the vehicle which is derived from Eq. (6).
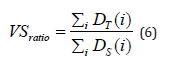
Where DT is the total travel distance of vehicle i on the road segment and TS is the total time spent by vehicle i on the road segment. Based on the result obtained from VSratio we can identify the level of the service of the road segment at the current time.
d) Road Segment
The RSratio is used to calculate the traffic link or capacity during maximum flow conditions at peak hours of the road by using Eq. (7).
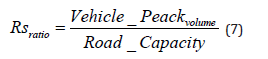
For RSU to suggest the most non-congested path towards the destination is based on the CRI value through the control packet by broadcasting the CRI value to RSU. This process is done when the suggestion level path is the capacity of the road, and then the RSU calculates the CRI value later used to share or exchange between neighbor RSU.
e) CRI Threshold
The CRI threshold is the value that determines whether a road segment is congested or not. The CRI threshold lies between 0 and 3, and it is calculated using the RS ratio, LOS, and Load_Factor ratio, as shown in Eq. (5) result identifies the threshold. The CRI threshold lies between 0 and 3. For example, let's take the expressway that has a capacity per lane in a given hour has 1800. If the road has 1000 vehicles, then the RSratio become 0.5 and it also the free flow speed is 50 km/hr these also have the LOS scale is 1. As a result, the CRI value is 1.9. These indicate the road segment gets congested because of the CRI value threshold. Similarly, by taking the express road supports at the current peak hour of 500 vehicles the RSratio value becomes 0.2 and it also the free flow speed is 100 km/hr these also have the LOS scale is 5. As a result, the CRI value is 0.9. These indicate the road segment is less congested than in the previous example. For CRI threshold CT as shown in Eq. (8) lies in between the two values.
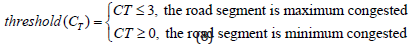
If the CT value is greater than or equal to 3, it indicates that the road segment is maximally congested, and if the CT value is less than or equal to 0, it indicates that the road segment is minimally congested. The CT value is an important parameter in determining the congestion level of a road segment and suggesting an optimal route to avoid congestion in the network. Once on the congestion level, the CRI is initiated using the vehicle traffic data, route suggestion step begins to calculate an optimal route. Ideal route suggestion is refreshed at each intersection, taking into account the data provided by the RSU. Each vehicle on the road periodically sends a message to their nearby RSU and updates the road segment information at time t. Each RSU keeps its associated road segment information in the route suggestion table. The RSU exchanges the road congestion index information with other RSUs and sends the road segment information to the data center as well. Congestion Suggestion Table (CST) includes the optimal route from an origin to destination considering the travel time and route congestion. The congestion information exchange between RSU has the following steps.
a. Step 1: RSU gathers road information from the vehicles on the road segment. Based on our assumption each road intersection is deployed with a special RSU to gather information and based on the information RSU calculates the CRI value.
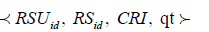
b. Step 2: RSU sends a request to neighbor RSU. The RSU forward its CRI value with additional information. The RSU ID, Road Segment ID (RSid), CRI and queue delay time qt.

c. Step 3: RSU receives information from neighbors RSU and suggest route path discovery. After the RSU received a reply from a neighbor RSU about road segment information, it suggested the vehicles that have less congested road segments towards to vehicle destination.
• Algorithm 2: Congested route suggestion Method Algorithm
INPUT: Load factor, Road Segment (RSid), destination id (destid)
OUTPUT: Congestion Route Index (CRI) value
1. RSU compute RSratio, LOS ← VSratio
2. RSU compute CRI value
3. RSU broadcast
4. For each neighbor RSUid compare the CRI value
5. If the CRI reaches the threshold
6. Road Segment with good CRI value is suggested for the route
7. UPDATE RSU
8. Else
9. Goto step 1
10. End if
11. End for
12. End procedure
d) Experimental Setup
• Simulation: For conducting the simulation, Network Simulator-3 (NS3) and a Simulation of Urban MObility (SUMO) simulator are used [9]. The proposed protocol was implemented based on the simulation parameters listed in Table 1, and its performance was compared with the existing routing algorithms.
Table 1: Experimental parameters.

The performance evaluation of the proposed work is compared with related work based on the following key performance indicators (KPI)[10].
Figure 3

Packet Delivery Ratio
In our simulation result, Figure 3 shows the Packet Delivery Ratio (PDR) performance of our proposed LAPCC algorithm congestion control mechanism in VANETs compared to the TDCCA method for different numbers of nodes and varying speeds. The x-axis represents the number of nodes, and the y-axis represents the PDR percentage. The plot in Figure 3a demonstrates that the proposed method achieves a higher PDR value than TDCCA, with a 96% PDR value when the speed is less than 50km/hr, in congested areas. On the other hand, the plot in Figure 3b demonstrates that TDCCA method achieves a lower PDR value than LAPCC, with a 92% PDR value when the speed is less than 50km/hr, in congested areas. The simulation result shows that the proposed scheme has better performance in terms of PDR under congested network conditions.
Packet Loss Ratio
In VANET, as the density of nodes increases, there are possibilities for collusion. Because of the number of packets transferred between vehicles, the probability of packet loss rises. Thus, analyzing the packet loss ratio is necessary for congestion control mechanisms. In our simulation result, the packet loss ratio performance of the proposed method is illustrated in Figure 4. The figure shows the Packet Loss Ratio (PLR) performance of the proposed LAPCC mechanism compared to the TDCCA method for different numbers of nodes and varying speeds. The x-axis represents the number.
Figure 4

End-to-End Delay
In the simulation scenario, we compare and analyze the end-to-end delay of each scheme in different vehicle density environments. Figure 5 shows the End-to-End Delay (E2E) of nodes. The y-axis represents the PLR percentage. The plot in Figure 4a demonstrates that the proposed method achieves a lower PLR value than TDCCA, with a 4.1% PLR value when the speed is less than 50km/hr in congested areas. On the other hand, the plot in Figure 4b demonstrates that TDCCA algorithm results in a higher PLR value than LAPCC, with a 5.7% PLR value when compared to 4.1% of LAPCC algorithm when the speed is less than 50km/hr in congested areas. The simulation result shows that the proposed scheme has better performance in terms of PLR under congested network conditions. performance of the proposed LAPCC mechanism compared to the TDCCA method for different numbers of nodes and varying speeds. The x-axis represents the number of nodes, and the y-axis represents the E2E delay in milliseconds. The simulation results show that the proposed mechanism outperforms the TDCCA protocol in terms of E2E delay. The proposed mechanism achieves lower E2E delay values than TDCCA for all numbers of nodes. The plot in Figure 5a demonstrates that the proposed LAPCC method achieves a lower end-to-end delay value than TDCCA, with a delay of 1102 ms when the speed is less than 50km/hr in congested areas. On the other hand, the plot in Figure 5b demonstrates that the existing TDCCA method achieves a higher end-to-end delay value than LAPCC, with a delay of 1154 ms when the speed is less than 50km/hr in a congested area. The simulation result shows that the proposed scheme has better performance in terms of end-to-end delay under congested network conditions.
Figure 5

In conclusion, this work offers a traffic load-aware and priority adaptive congestion control method based on the movement of the vehicle with RSU and the traffic load shared between them to enhance a routing efficiency in congested vehicular area. It looks at how to put information together to control traffic congestion on VANET. It suggested a method that uses a load factor to improve routing efficiency during congestion on the road. To validate the proposed algorithm, a set of experiments were conducted to determine the effectiveness of the proposed routing algorithm based on three simulation scenarios using the NS-3 simulator. The proposed work LAPCC algorithm was compared to the TDCCA algorithm based on packet delivery ratio, packet loss ratio, and end-to-end delay. The simulation result shows that our proposed system improves the Packet Delivery Ratio to 96%, packet loss ratio to 4.1%, and end-to-end delay to 1102 seconds compared to TDCCA 92%, 5.7%, and 1154 milliseconds respectively. Therefore, based on the simulation result we observe that the proposed method shows better performance.


