info@biomedres.us
+1 (502) 904-2126
One Westbrook Corporate Center, Suite 300, Westchester, IL 60154, USA
Site Map
Received: July 03, 2024; Published: July 15, 2024
*Corresponding author: N Loukeris, University of West Attica Dept Business Administration P Ralli 56, 111 00 Athens, Greece
DOI: 10.26717/BJSTR.2024.57.009021
The novel model of Prognosis Intelligence-PI, inspired by the Portfolio Intelligence, Loukeris et al. (2015) is provided for medical support. The PI elaborates advanced diagnosis data on the health reassurance problem, supported by robust Artificial Intelligence systems. The Prognosis Intelligence – PI model extracts hidden patterns from extended amounts of health indices eg blood pressure, temperature, blood composition, etc filtering the noise or ill-diagnosed conditions to provide an optimal health treatment portfolio selection system.
Keywords: Integrated Systems; Support Vector Machines; Radial Basis Functions; Multi Layer Perceptrons; Neural Networks; Genetic Algorithms; Financial Analysis; Nonlinear Regressions; Prognosis; Medical Support
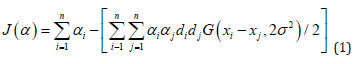
The axioms of choice by von Neumann-Morgenstern axioms supposing normal distributions of measurements returns and quadratic preferences influence a majority of portfolio selection models, inspired by the (Markowitz’s, [1]) mean-variance criterion. Although the practitioners conclude on the weak existence of these conditions, (Merton, [2]), as the behavior of individuals in terms of utility and pleasure, are not Normally Independently and Ideally Distributed in non quadratic distribution. Loukeris et al. (3) noticed the marginal superiority of the Power utility than the Quadratic function, using skewness, in addition. In terms of pleasure individuals prefer positive skewness, on high gains by extreme positive events, (Boyle, [4]), in low kurtosis on lower risk in extreme pain on both sides of the distribution, The aim of this paper is to evaluate the first phase of the optimization problem, in a generic resolution of the second step. Then I build the integrated model of Prognosis Intelligence to optimize health portfolio solutions with Artificial Intelligence advanced techniques. This PI model is created under my evaluation of six different Jordan Elman hybrid models. The scope is quintuple:
i) To examine individuals’ health indices in higher moments of utility distribution, in terms of pain and gain,
ii) To support the isoelastic utility as an optimal function on individual’s utility,
iii) To advance the fundamentals health indices examination, filtering the noise, and define healthy patterns of utility
iv) To evaluate the Jordan Elmans networks in neuro-genetic hybrids or neural net forms on various topologies to a new learning process, compared to past results of Radial Basis Functions, Support Vector Machines, Time-Lag Recurrent Nets, MLPs and the Bayesian Regression, defining the optimal health solution.
v) To provide the PI model in health portfolio selection and optimization problems supported by innovative modelses.
The Jordan Elmans, are evaluated in 11 topologies of 2 neural and 4 hybrids where genetic algorithms optimize their parameters. These learning process, of Batch, updates the trained weights ex-ante, faster. The health portfolio optimization problem is non-deterministic, thus heuristics can support it optimally. 66 models of Jordan Elman determined optimal classifier of PI model. The complicated and unique human profile cannot be accurately described, but I model it in the Isoelastic utility and AI. Section 1 provides a description of the EMH, the higher moments and the Isoelastic utility I use. Section 2 offers the portfolio selection model of the Isoelastic utility function, the new portfolio selection constraints with fundamentals and Artificial Intelligence models. The Section 3 supports the data analysis. Section 4 includes the results and Section 5 the conclusions.
The health indices distributions are not n.i.i.d. in reality, as various non-linear parameters affect the health overall. (Subrahmanyam, [5]), noticed that individuals are more sensitive to their potential pain, I to model the overall utility preferences, including sub-conscious trends. Individuals distribute their utility between ideas and fears, and pleasure. They expects a rational level of happiness, but the fear of pain alters their decisions. Most of individuals are risk averse or risk neutral, thus the fear manipulates them. In normal conditions the fear of losing the health, as in epidemic, or pandemic the fear of maximizing pain produces irrational herding behaviors. The further higher moments of health indices detect the hidden aspects of individuals’ decision making. (Loukeris, et al. [6,7]) noticed that on the implied utility function of the HARA family (Hyperbolic Absolute Risk Aversion) the 5th of hyperskewness and the 6th of hyperkyrtosis moments should be used.
Inspired by the Portfolio Intelligence, (Loukeris, et al [8]), the Prognosis Intelligence - PI model on the first step reads the fundamental health indices and the preferred optimization period t. Then it proceeds by selecting the initial method to evaluate the health measures/indices in the portfolio. On this step the individual’s risk profile is given and the λ is selected for the Isoelastic utility. On the next step, the system examines if this is the last individual to be examined, and if the condition for the optimal health portfolio as an efficient portfolio is satisfied. Else I proceed to the next step of the initial evaluation that uses an AI system, to create two subsets: Subset A of the healthy individuals, and Subset B of the distressed/patients. In the specific model I select the best network among the RBFs, the SVMs and the MLP the Jordan Elman Neural Net of 1 hidden layer that converges in 4 seconds only. The ετ value is calculated (0, for the healthy and 1 for the distressed individuals). If ετ = 1 then the individual is distressed and it is restricted, else if ετ = 0 is healthy being candidate for the optimal efficient health portfolio set. On the next step the Ut(Rt(i)) the utility function of is calculated per individual. Next, individuals are ranked according to their utility score. Then, the Efficient Frontier is calculated. Next, the individuals with the higher utility score are selected into the efficient health portfolio. The sub-optimal individuals as well as the non-optimal individuals are revaluated with potential new data on the step 4 of Neural Nets evaluation, following all the steps. Next, after the efficient health portfolio is created, its Utility Function is calculated UPj(f).
Then, the optimal overall portfolio U*Pj(f) whose utility is the maximum available, is detected, if possible, by all the available efficient portfolios utilities UPj(f) recorded in U*Pj(f)> UPj(f). The model’s flow chart is in (Figure 1). The process stops when the time limit is reached and the PI has the optimal health portfolio, and its characteristics are guidelines for the individuals to increase their utility. The key idea is to filter noise on the health diagnosis and disorient doctors. Thus examining recent indices I can define the real health levels of the individual. After the real healthy individuals are selected then their gains are considered on the model and I proceed on the creation of the excellent health portfolio
Figure 1

The significance on each one of the 16 inputs in all the Radial Basis Functions, Jordan Elman, Multi Layer Perceptrons is evaluated in Genetic Algorithms, as well, in multiple training process. Detect the inputs combination that produces the lowest error. The Genetic Algorithms are elaborated in four different hybrid models of different topologies:
On the inputs layer only,
On the inputs and outputs layers only,
Into all the layers,
Into all the layers with cross validation,
The Batch learning was preferred to update the weights of hybrid neuro-genetic JE, after the presentation of the entire training set. The Genetic Algorithms also resolved the problem of optimal values in all the hidden layers and the output in:
The Step Size and
The Momentum Rate.
The JE nets require multiple training to achieve the lowest error.
Data were produced by 1411 cases and a 17th index with initial classification, done by executives. Test set was 50% of overall data, and training set 50%. The key idea is to define and select the optimal network in terms of accuracy, efficiency and impartiality regardless of the similar processing time of the trained networks
Support Vector Machines
The Support Vector Machines-SVM, make general regression, and classification functions from a set of labeled training data, binary and input is categorical. The training of SVMs is short in a sequential minimal optimization, the output is unmarked of slow learning on extended multi-classes data ses, minimum computations of the high dimensional space, processing directly the input The optimisation problem of the Adatron learning algorithm to the RBFN, substitutes the inner product of patterns in the input space by a kernel function:
in choice of αi as a common starting multiplier, t small threshold, and h low learning rate. The converging system produces a few αi ≠0, the support vectors, interacting with the closest boundary samples among classes. The Adatron kernel adjusts the RBFN in an optimal margin, and prunes the RBF net.
Radial Basis Functions
The Radial Basis Function-RBF nets do linear regressions, classifications and time series predictions in supervised learning. The training set, or set of examples, contains the independent (input) variable, sensitive to noise, and the dependent (output) variable. The Linear models are:
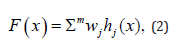
where f(x) a linear combination on m set of fixed functions, the Basis Functions, wj linear combinations coefficients and hj weights. A Radial Basis Function-RBF network is in figure 2, every input component (p) is on a hidden nodes layer, each node is a p multivariate Gaussian function (RBF):
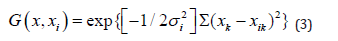
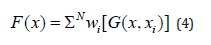
of mean xi and variance, the linear weight on the hidden nodes, produces the output that may create a very large hidden layer:
The significance of each health indices out of the 16 inputs in hybrid RBF network is unknown to the model hence Genetic Algorithms select them. Each model is trained multiple times to define the inputs combination of the lowest error. Genetic Algorithms were implemented in different hybrid models:
i) On the inputs layer only,
ii) On the inputs and outputs layers only,
iii) Into all the layers and cluster centers,
iv) Into all the layers and cluster centers with cross validation,
in different topologies. Batch learning was selected to update the weights of hybrid neuro-genetic RBF, after the presentation of the entire training set. The competitive rule was the Conscience Full function in Euclidean metric as the conscience mechanism keeps a count on how often a PE wins the competition, and enforces a constant wining rate across the neurons. There were 4 neurons per hidden layer, using the Tanh Axon transfer function, on the Momentum learning rule. Genetic Algorithms resolved the problem of optimal values in
a) Processing Elements,
b) Step Size and
c) Momentum Rate, and
d) Cluster Centers. RBF nets require multiple training to obtain the lowest error. The output layer elaborated Genetic Algorithms in some hybrids optimising the Step size and the Momentum.
In terms of the overall performance, (Loukeris, et al. [8,9]), the Hybrid RBF on GA optimisation into inputs and outputs only with 3 hidden layers had the overall optimal performance where 97.24% and 72.48% of the companies converged in classification as healthy and distressed respectively, the fitness of the model to the data was high at r 0.925 whilst errors remained low at MSE 0.116, NMSE at 0.393, in error 9.039% on a moderate Akaike criterion, in a short computing time of 5 hours 48 minutes 56 seconds. The second place was given to the Hybrid RBF of GAs in all layers of no hidden layers where 98.15% of healthy and 60.09% of distressed companies were correctly classified, in a fine fitness to the data at 0.815 in medium MSE, NMSE, proportional errors, medium AIC signifying statistical non-impartiality, in a quick processing time of 5 hours 2 minutes 28 seconds (Tables 1-3). The third rank is given to the SVM of 500 epochs that although excelled in classification and performance, the extremely high partiality bias it incorporates consists a serious point of discussion. The integrated PI model is fully flexible as I provide the user with the opportunity to select whether the health of the individuals is performed once, and to choose the type of the model (neural net, hybrid net, models with cross validation), or twice by an initial neural net and then by a hybrid net of CV in a double precision process. The reason I provide these alternatives is that given that the neural net operates as a black box with unique results each time, I try to avoid misjudgment due to the non-linear complexity of the models and over-fitting, in case of Cross Validation absence. In case of a single precision with a hybrid that includes Cross Validation the models is secured by the risk of overfitting, but exposed to the risk of non-repeatable objectivity. Thus in cases of double precision models the user is ensured that the financial health is found accurately, and objectively [10-92].
Table 1: RBFs Overall Optimal Results, Loukeris, Eleftheriadis & Livanis (2014).

Table 2: Overall Optimal Results on SVMs, RBFs MLPs, Loukeris and Eleftheriadis (2012a), Loukeris et al. (2013), Loukeris et al. (2014a).

Table 3: Overall Optimal Results on SVMs, RBFs MLP.

The integrated model PI - Portfolio Intelligence, offers a more detailed approach into the real time portfolio selection problem. The main advantage of this system is that by extracting hidden patterns it tries to avoid manipulation, and speculation games. The Radial Basis Function networks have a promising performance of high calibration that can allow them to be a part of this model or its future developments. More over the Hybrid Radial Basis Function on GA optimisation into inputs and outputs only with 3 hidden layers had the overall optimal performance as a reliable model of good classification abilities, performance and a low computing time, but in a higher risk of overfitting, whilst the Hybrid RBF of GAs in all layers of no hidden layers in a marginal lower rank is the best option in all aspects plus it protects from overtraining. The Support Vector Machines had the overall excellent classification and performance but they are exposed to partiality feature, and thus are not appropriate for numeric classification problems. Thus the Radial Basis Function networks provide a good non-linear regression to Portfolio Selection.
The authors declare that no funds, grants, or other support were received during the preparation of this manuscript This work was supported by ELKE. Author I. Boutalis & L. Maltoudoglou have received research support from the Democritus University of Thrace for the participation at the IEEE 6th International Conference on Information, Intelligence, Systems and Applications, IISA2015, Ionian University, Corfu, Greece, July 6-8.


