info@biomedres.us
+1 (502) 904-2126
One Westbrook Corporate Center, Suite 300, Westchester, IL 60154, USA
Site Map
Received: March 22, 2024; Published: April 25, 2024
*Corresponding author: Mohammed Al-Qahtani, Cyclotron and Radiopharmaceuticals Department, King Faisal Specialist Hospital & Research Centre, P.O.Box. 3354, 11211 Riyadh (MBC 03), Saudi Arabia
DOI: 10.26717/BJSTR.2024.56.008833
An assessment of imaging performance of the Mediso nanoScan small animal PET/CT scanner using 18F and 68Ga radioisotopes was performed. NEMA NU 4-2008 standard phantoms and protocols were used. Evaluation of spatial resolution was performed using glass capillary tubes and a specially designed spherical point source. Spatial resolution was estimated and compared for both radioisotopes using 2D-FBP, 2D-OSEM and Tera-Tomo 3D-OSEM image reconstruction algorithms. The NEMA NU 4 small animal image quality phantom was used to evaluate image noise, contrast recovery and spill-over ratio for both radioisotopes. However, image quality evaluation studies were performed using the Tera-Tomo 3D-OSEM image reconstruction algorithm only. FWHM values measured using glass capillary tubes positioned in air at 3 radial positions were 2.2, 1.5, and 0.9 mm for 18F, and 2.5, 1.9, 0.9 mm for 68Ga respectively. Corresponding values using spherical point sources were 2.3, 1.9, 1.3 mm for 18F and 3.4, 3.3, 1.3 mm for 68Ga respectively. Significant reduction in spatial resolution was observed when using 68Ga with 2D-FBP and 2D-OSEM reconstruction algorithms. STD (%) of pixel values in the uniform region of the image quality phantom were 10.1% and 11.6% for 18F and 68Ga respectively. RC obtained for various rod sizes varied from 0.08 to 1.3 for 18F and from 0.09 to 1.16 for 68Ga. SOR for air and cold water filled cylinders were 0.11 and 0.23 for 18F filled phantom and 0.2 and 0.37 for 68G filled phantom. SOR values were significantly higher for 68Ga than for 18F.
Abbreviations: PET: Positron Emission Tomography; FDG: Fluoro-2-Deoxy-D-Glucose; GUI: Graphical User Interface; SSRB: Single-Slice Rebinning; FBP: Filtered-Back Projection; FWHM: Full Width at Half-Maximum; FWTM: Full Width at Tenth-Maximum; SNR: Signal-to-Noise Ratio; SF: Scatter Fraction; SOR: Spill-Over Ratio; RC: Recovery Coefficient; VOI: Volumes of Interest
Tracers labeled with positron-emitting radioactive nuclides such as 11C, 15O, 13N, and 18F are widely used in positron emission tomography (PET) (Liu, et al. [1]). The most commonly used radiopharmaceutical is 2-[18F]fluoro-2-deoxy-D-glucose ([18F]FDG). It is mainly used for diagnosis and staging of various cancer types (Liu, et al. [1]). Interest in other radioisotopes such as Gallium-68 (68Ga), Cupper-62 (62Cu), Rubidium-82 (82Rb), Iodine-124 (124I) and Zirconium-89 (89Zr) have grown recently (Attarwala, et al. [2]). These radioisotopes have distinctive physical properties, such as long half-lives, unique decay modes, or mode of complexation. Gallium-68 (68Ga) is increasingly being used in radiolabeling of small molecules such as peptides and antibodies (Attarwala, et al. [2,3]). It has also been used to label peptide agents showing promising results particularly in imaging neuroendocrine tumors (Jalilian [3]). 68Ga is readily available by simple elution of 68Ge/68Ga generators. Additionally, 68Ga is easily labelled using commercially available labelling kits (Attarwala et al., Conti et al., Cañadas et al., [2,4,5]). However, its relatively large positron range causes significant blurring of 68Ga-PET images without positron range correction. This effect is very clearly seen in small-animal PET imaging where blurring on a milli-meter scale can clearly effect image quality (Cañadas, et al. [5]).
While the positron range in itself is a fundamental physical aspect of the slowing-down processes of highly energetic positrons, it is possible to correct for the blurring effect in the reconstructed images. This can be achieved by incorporating a deconvolution model based on the knowledge of the spatial distribution of the blurring effect of the positron range in the reconstruction algorithm (Rahmim et al., Ruangma et al., Disselhorst et al., [6-8]). Liu and Laforest have shown that the incorporation of point spread function modelling increases quantitative accuracy of small lesions for long-range positron emitters (Liu, et al. [1]). The imaging performance of a variety of small-animal PET imaging systems and a range of radioisotopes (tracers), including 18F, 68Ga, 64Cu, 89Zr, 11C, 124I, 89Rb have been evaluated. These investigations have demonstrated the affect of positron range on image quality and image resolution in particular (Alanazi, Szanda et al., Nagy et al., Gaitanis et al., Presotto et al., Ferguson et al., Teuho et al., and Liu et al. [1,2,5, 8-16]). This study aims to evaluate the performance of a small-animal Mediso nanoScan PET/CT system using 18F and 68Ga positron emitter radioisotopes. The study aims to evaluate the effects of choice of reconstruction algorithm on image quality. It also aims to assess the effect of application of CT based attenuation and scatter corrections and Monte Carlo simulation based positron range correction supported by the Tera-Tomo™ multi-GPU based reconstruction algorithm (Peter Major, et al. [10,17]). The image quality evaluation study is performed according to the NEMA NU 4-2008 standards protocols.
NanoScan PET/CT Scanner and Radioisotopes
In this study, a small animal Mediso-nanoScan PET/CT scanner (Hungary) was used to evaluate the image quality and spatial resolution of phantom images acquired using 18F and 68Ga radioisotopes. The nanoScan PET/CT is a compact multimodality small-animal scanner developed and manufactured by Mediso Medical Imaging Systems (Hangary). The system combines large axial and trans-axial fields of view of the PET ring and high-performance CT system with Tera-Tomo 3D PET iterative reconstruction algorithm. The Tera-Tom properietry 3D iterative reconstruction applies deep Monte Carlo based physical modelling of particle-level interaction from positron emission to detection. It incorporates advanced corrections for energy, time, dead-time and random events and positron range with CT based attenuation and scatter corrections (Peter Major, et al. [10,17]). A comparison between image quality and spatial resolution of 68Ga and 18F radioisotopes was performed.
18F was selected as a reference radioisotope as it is the most commonly used PET tracer and is required for most NEMA standard assessments. Most important physical characteristics of both radioisotopes are summarized in Table 1. It is important to remember that 68Ga typically emits extra photons (1.08 MeV) at a low branching ratio (0.03) and produces a very small number of single events. Despite being small compared to those caused by annihilation photons, these high-energy photons contribute to the image’s creation and cannot be ignored (Cañadas, et al. [5]). King Faisal Specialist Hospital and Research Centre produces both radioisotopes in-house in its Cyclotron facility: 18F is obtained from a CS-30 cyclotron (Cyclotron Co. Ltd, Obninsk, Russia) as [18F]FDG; and 68Ga is obtained from a 68Ge/68Ga generator as [68Ga]GaCl3 (eluted with 3 mL of 0.5 mol/L hydrochloric acid).
Table 1: The most important physical characteristics of 18F and 68Ga (Cañadas, et al. [2,5]).

Evaluation of Spatial Resolution
Spatial resolution is a critical measure to assess imaging performance of PET systems (Gong, et al. [18]). According to the NEMA NU 4-800 standard on performance measurement of small animal positron emission tomography systems, a 22Na point source should be used to measure the spatial resolution of small animal PET scanners (Szanda, et al. [10]). In this investigation, two test objectives were used for spatial resolution assessment of the nanoScan PET/CT scanner. The first test object is made of a small acrylic sphere (< 1 mm radius) glued on a thin acrylic plate. The sphere was injected with 2 MBq and 0.8 MBq for 18F and 68Ga, respectively to create a small spherical point source. The sphere and plate were positioned in air at 3 radial positions (0, 10, and 15 mm from the axis of the scanner). In the second test, 75 mm long glass capillary tubes with 1.0 mm inner diameter and 0.3 mm wall thickness were injected with 2.8 MBq of 18F and 68Ga radioisotopes each. The capillary tubes was positioned in air at 3 radial positions (0, 10, and 15 mm from the central axis of the scanner). Mediso proprietary Nucline acquisition software was used to perform the scans. It provides graphical user interface (GUI) for setting up and starting acquisitions, operating mechanical functions, starting PET reconstruction, visualizing results, and other operational functions.
List-mode data was acquired in 1–5 coincidence mode, with an energy window of 400–600 keV and coincidence window of 5 ns. Acquired data was normalized to correct for different detection efficiencies and then and re-binned into a set of 0.3 mm bin-sized 2D sinograms using the Single-Slice Rebinning (SSRB) method (Daube-Witherspoon ME, et al. [19]) with a maximum ring difference of 16. Sinograms data was then reconstructed using a Filtered-Back Projection (2D-FBP) algorithm with a Median filter (Hounsfield GN [20]). Ordered-Subset Expectation Maximization (2D-OSEM) algorithm with 4 subsets, and 8 iterations (Hudson HM, et al. [21]), and the Tera-Tomo 3D-OSEM reconstruction algorithm with 8 iterations. In all three reconstruction algorithms (2D-FBP, 2D-OSEM, 3D-OSEM), randoms, attenuation, and scatter corrections were applied. However, positron range correction was only applied in the TeraTomo 3D-OSEM reconstruction algorithm. Image spatial resolution was reported as the Full Width at Half-Maximum (FWHM) and Full Width at Tenth-Maximum (FWTM) of tangential and radial profiles obtained across the activity point and line sources.
Image Quality Evaluation
The NEMA NU-4 compatible image-quality phantom (part no. PH- 60-00-42; Mediso Ltd.) was used for image-quality evaluation. The phantom comprises of three compartments as illustrated in Figure 1. The first compartment is homogeneous block (30 mm diameter and 30 mm length) used to calculate the system’s Signal-to-Noise Ratio (SNR). The second compartment consists of two cylinders filled with air and water respectively (length 15 mm; outer diameter 10 mm; wall thickness 1 mm) used to estimate Scatter Fraction (SF), and Spill- Over Ratio (SOR). The third compartment is a solid PMMA region (30 mm in diameter and 20 mm in length) with 5 holes drilled through with different diameters 1, 2, 3, 4, and 5 mm, used to assess Recovery Coefficient (RC). The image quality phantom was filled with a total volume of 25 mL activity for each study. To ensure equivalent number of positron decays, we used 20 minutes acquisition time for both radioisotopes studies, and injected the phantom with 3.7 MBq of 18F and 4.17 MBq of 68Ga.
Figure 1

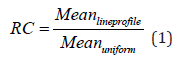
The phantom was positioned on the scanner bed and centered manually. The acquired data were reconstructed with the Tera-Tomo 3D-OSEM algorithm with a 0.3 mm voxel size and 8 iterations settings. Random, attenuation, scatter, positron range and dead-time corrections, and normalization were applied. A cylindrical Volume of Interest (VOIuniform) with dimensions (22.5 mm-diameter and 10 mm-long) was drawn over the center of the phantom to determine image uniformity. In this VOI, the mean, minimum, and maximum pixel values, as well as the Standard Deviation percentage (% STD), were calculated. Line profile of pixel values along the activity rods were obtained. Recovery Coefficient (RC) curves were obtained by mean pixel value over a 10-mm volume of interest at the center of the active rods (VOIrods). Recovery Coefficient (RC) for each rod size is obtained by dividing average pixel values of the line profile measured along the rods by mean pixel values obtained from the uniform region VOIuniform as stated in equation (1) below.
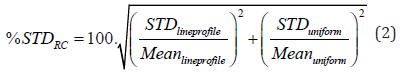
The STD percentage of the RC (%STDRC) is calculated using the STD and mean values of the line profiles and uniform region’s VOI as stated in equation (2) below.
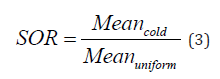
To assess accuracy of scatter correction for both radioisotopes, Spill-Over Ratio (SOR) is obtained by dividing average activity concentration in each of the two cold air and water cylinders by the average activity concentration in the uniform region as defined in equation (3) below. The average activity concentration in each of the two cylinders is obtained as the mean pixel values of 4 mm diameter and 7.5 mm long Volumes of Interest (VOI) calculated at the center of each cylinder.
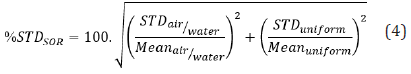
The STD percentage of SOR (% STDSOR) is calculated using the STD and mean pixel values of air and water cold cylinders VOIair/water and uniform region’s VOIuniform as defined in equation (4) below.
Spatial Resolution
For the glass capillaries tubes positioned at radial positions (0, 10, and 15 mm from the axis of the scanner), obtained FWHM (FWTM) values were 2.2 (4.8), 1.5 (3.4), and 0.9 (1.6) mm for 18F radioisotope reconstructed using FBP, 2D-OSEM, and 3D-OSEM algorithms respectively. Corresponding values using the spherical point sources (Acrylic spheres) were 2.3 (5.2), 1.9 (4.1), 1.3 (2.4) mm for 18F, and 3.4 (7.1), 3.3 (6.0), 1.3 (2.3) mm for 68Ga. FWHM and FWTM values obtained for various radial positions and two different setups are shown in Figures 2-5. FWHM to FWTM ratio (FWHM/FWTM) values for glass capillaries tubes’ pixel value profiles using FBP, 2D-OSEM, and 3D-OSEM reconstruction algorithms were 0.45, 0.44, and 0.56 for 18F; and 0.43, 0.46, and 0.54 for 68Ga respectively. Corresponding values obtained using the spherical point sources were 0.44, 0.46, and 0.54 for 18F and 0.48, 0.55, and 0.56 for 68Ga respectively.
Figure 2

Figure 3

Figure 4

Figure 5

Image Quality
Figure 6 below shows circular ROIs drawn on axial images of the three compartments of the image quality phantom reconstructed using the Tera Tom 3D-OSEM reconstruction algorithm. Obtained ROI pixel values were used to calculate Recovery Coefficient (RC) and Spill-Over Ratio (SOR) values for 18F and 68Ga filled phantoms.
According to Teuho et al., Recovery Coefficient (RC) of uniformly distributed radioactivity in a phantom, should be approximately be equal to 1 (Teuho, et al. [15]). Using the Tera Tom 3D-OSEM reconstruction algorithm with all previously mentioned corrections applied, RC values ranged from 0.08 to 1.3 for 18F and from 0.09 to 1.16 for 68Ga as illustrated in Figure 7. RC values for 68Ga were generally lower than those obtained for 18F for all rods sizes. However, difference between RC values for 18F and 68Ga for the same rod sizes were statistically insignificant. Image noise obtained as the standard deviation (% STD) of pixel values in the uniform region of the phantom was 10.1 % for 18F and 11.6 % for 68Ga (Table 2). Spill-Over Ratio (SOR) values in air were (0.11 and 0.23); and (0.2 and 0.37) in water for 18F and 68Ga, respectively (Table 3). As would be expected, the spill-in effects are higher for 68Ga than 18F images. It is also noticeable that the spill-in effects are generally higher for water filled cylinders than for air-filled cylinders for both radioisotopes (18F and 68Ga).
Table 2: Statistical Uniformity parameters in terms of mean, maximum and minimum values of activity concentration and % STD obtained in uniform Volume of Interest (VOIuniform).

Table 3: Spill-Over Ratio (SOR) and percentage Standard Deviation (% STD) for cold water- and air- cylinders for both 18F and 68Ga filled phantoms.

Figure 6

Figure 7

In this study a comparison between image quality and spatial resolution performance of a Mediso NanoScan PET/CT system using 18F and 68Ga radioisotopes is reported. Our results indicate that physical properties of a radioisotope significantly influence the performance of small animal PET/CT scanner’s image quality parameters such as RC, SOR, and spatial resolution. Spherical Acrylic point sources and cylindrical line sources of each radioisotopes were used to estimate radial and tangential resolution for both 18F and 68Ga reconstructed images. Variation of spatial resolution with radial position in the axial field of view is also investigated for both radioisotopes according to NEMA NU 4 protocols. FWHM and FWTM of the line profiles were used to compare spatial resolution performance of the scanner using the 2D-FBP, 2D-OSEM, and the Tera-Tomo 3D-OSEM reconstruction algorithms. Tera-Tomo 3D-OSEM algorithm produced the highest resolution images followed by the 2D-OSEM iterative reconstruction algorithm.
There was a significant variation in spatial resolution values between measurements performed using Acrylic spheres and glass capillary tubes. This could be attributed to the partial volume effect on the spherical point sources in comparison to the cylindrical capillary tubes line sources. This may also be attributed to the large difference in the density of glass tube walls (2.2 g/cm3) and the sphere’s acrylic walls (<1.2 g/cm3), as wall thickness and density effects positron range and radioactivity spill-out significantly. As to be expected, spatial resolution was poorer for 68Ga than 18F for images reconstructed using the 2D-FBP and 2D-OSEM reconstruction algorithms (Figures 2-5). This is mainly due to the effect of positron range on the spatial resolution of PET images (Bai, et al. [22]). However, there was no significant difference in spatial resolution for 68Ga than 18F for images reconstructed using the Tera-Tomo 3D-OSEM reconstruction algorithm, which can be attributed to the effectiveness of the positron range correction applied in this reconstruction algorithm.
Considering that an ideal FWTM/FWHM ratio for a Gaussian distribution profile is 1.82, and should be ≤ 1.9, our resolution estimation results have met this requirement for all image reconstruction algorithms performed using the glass capillary tubes in contrast to earlier reported results by Cañadas, et al. [5,8], where an important deviation from a Gaussian profile (ratio ~1.82) was observed for 68Ga. However, an apparent deviation from the ideal Gaussian profile for both radioisotopes was observed when spherical point sources was used. This again could be attributed to the inherent partial volume effect of the spherical shape of the point source and the lower density of the Acrylic point source wall. The possibility of formation of micro air bubbles in the small sphere may also cause significant partial volume effect resulting in the over estimation of FWHM of point spread function of the point source. Furthermore, a gradual deterioration in the spatial resolution was observed, especially for 2D-FBP and 2D-OSEM reconstruction methods, with increased distance from the center of the axial FOV, which agrees with the results of Attarwala [2]. Employing the Tera-Tomo 3D-OSEM reconstruction algorithm has produced significantly improved spatial resolution values for both radioisotopes with almost identical spatial resolution values for 68Ga and 18F. These results agree with those reported earlier by Dahle, et al. [9,23], who both showed that spatial resolution values were greatly enhanced by using the 3D-OSEM reconstruction algorithm. A NEMA NU-4 compatible image-quality phantom was used to evaluate image-quality parameters for 18F and 68Ga imaging (Teuho, et al. [15]). Images with comparable injected activities were acquired using 30 minutes acquisitions and reconstructed using the Tera-Tomo 3D-OSEM algorithm. Our results have shown that there was no significant variation in noise levels expressed as % STD for the two radioisotopes. We did not investigate the effect of choice of image reconstruction algorithm on image quality parameters such image noise, contrast recovery and spill-over ratio due to technical issues and time constraints.
However, it is well established that choice of reconstruction algorithm and reconstruction parameters including number of iteration, subset and choice of filter will affect image quality parameters as reported by Disselhorst et al. and others (Disselhorst, et al. [8]). It is has been reported that 68Ga will have lower contrast recovery expressed as RC due to the relatively high positron range (Attarwala, et al. [2,15]). However, our results have shown insignificant reduction in estimated RC using 68Ga as compared to 18F. This better than expected result is probably due to implementation of the positron range correction technique on the Tear Tomo 3D-OSEM algorithm. Furthermore, the RC values for both 18F and 68Ga have exceeded 1 for rods with diameters 4 and 5 mm (Figure 6). This could be attributed to the distinct hot object edge artifacts; in which the hot rods’ activity was underestimated inside and overstated at the edges (Ferguson, et al. [14]). However, our results differ from those of Ferguson et al., who suggested that RC values exceed one for only short-range positron emitters such as 64Cu and 18F (Ferguson, et al. [14]), while our results have shown RC values exceeding 1 for a relatively long positron range emitter 68Ga.
As stated by Teuho et al., Spill-Over Ratio (SOR) in a model system should be equal to 0, as there is no actual radioactivity in cold regions (Teuho, et al. [15]). Low SOR values however indicate how well the scatter and positron range correction work for the system (Attarwala, et al. [2]). Our results have shown that SOR in both air and water was significantly higher for 68Ga (0.23 and 0.37, respectively) than for 18F (0.11 and 0.2, respectively). This variation is in agreement with previous published results (Teuho, et al. [2,5,8,15]). Furthermore, SOR values were significantly higher in water than in air for both radioisotopes. This is probably due to the huge difference in positron range in water and air (positron range in air is 1.66 m and 6.69 m for 18F and 68Ga respectively). Positron range effects can be ignored in SOR estimation in air but not for water or equivalent tissues (Disselhorst, et al. [8,24]).
Our study provided a comparison of image quality indictors including spatial resolution between 18F and 68Ga radioisotopes on a small-animal scanner (Mediso NanoScan PET/CT). This allowed the investigation of the effect of positron range on image quality and spatial resolution. It also allowed the evaluation of the positron range correction technique implemented on the Tera-Tomo 3D-OSEM reconstruction algorithm. Significant reduction in spatial resolution was observed when using 68Ga with 2D-FBP and 2D-OSEM reconstruction algorithms. However, employing the Tera-Tomo 3D-OSEM reconstruction algorithm with positron range correction has resulted in identical and improved spatial resolution parameters for both radioisotopes. There was no significant difference in image noise (% STD) for 18F and 68Ga images performed using the Tera-Tomo 3D-OSEM reconstruction algorithm. Insignificant reduction in estimated RC using 68Ga as compared to 18F was observed. This indicates the effectiveness of the positron range correction technique implemented on the Tera-Tomo 3D-OSEM algorithm. Spill-Over Ratio (SOR) values measured in both air and water cold cylinders were significantly higher for 68Ga than for 18F. SOR values were significantly higher in water than in air for both radioisotopes indicating that positron range effects can be ignored in air but not for water or equivalent tissues in quantification studies.
The authors declare that there is no conflict of interest regarding the publication of this paper.
The authors express their thanks and appreciation to King Faisal Specialist Hospital and Research Centre (KFSH&RC) for providing access to facilities and radioisotopes including the Mediso-nanoScan PET/CT scanner (RAC # 2210033).
All authors contribute, read, and approved the final manuscript
This submission complies with ethical guidelines and all authors contributed to this manuscript.
The authors express their thanks and appreciation to King Faisal Specialist Hospital and Research Centre (KFSH&RC) for providing access to facilities and radioisotopes including the Mediso-nanoScan PET/CT scanner, and to Mr. Y. AlMalki for his technical assistance. This research did not receive any specific grant from funding agencies in the public, commercial, or not-for-profit sectors.


