info@biomedres.us
+1 (502) 904-2126
One Westbrook Corporate Center, Suite 300, Westchester, IL 60154, USA
Site Map
Received: February 02, 2024; Published: February 19, 2024
*Corresponding author: Hissah Alzahrani, Mathematical Sciences Department, College of Applied Sciences, Umm AlQura University, Meccah, 24382, Saudi Arabias
DOI: 10.26717/BJSTR.2024.55.008657
Cluster analysis is dividing the individuals into clusters or groups. This job is valuable and helpful to provide facts and information about individuals. Here in this paper, we proposed the cluster analysis for a special model. It is the connected model for repeated measures called longitudinal and survival for individuals or patients. The statistical analysis of the connected model from the longitudinal and survival datasets has become popular recently because it comes together in many medical applications. Here in this study, we utilized two statistical methods, cluster analysis and, connect the two models from longitudinal and survival data. It is bene cial since it gathers information from repeated measurements, and survival responses. The shared random e ect term is used joint multivariate Gaussian distribution (longitudinal) and Cox proportional hazard model (survival)for the same patients. Then, the pseudo-liklihood algorithm (clustering methodology) is performed for the joint model to distinguish the clusters or groups of patents. The application is HIV patient’s dataset with CD4 + counts responses and time to death (survival data) with some independent variables as gender and drug treatments. We conducted the clustering for S=2 and estimated the parameters from the longitudinal and survival models with and without clustering and compared the estimations. Our results showed the generated clusters are different from each other, the estimation parameters are located around the original estimations (without clustering). It is a helpful methodology to identify distinct groups or clusters from population. Finally, there is a big need for this type of application in medical elds.
Many clinical trials applications generate repeated measurements and time to event (survival data). In longitudinal studies the patients are followed over many occasions (repeated measurements) and their data indicates biomarkers. Sometimes these longitudinal data include time to event, for example time to death, Alzahrani [1]. There are many statistical methodologies designed to joint or connect the analysis of the repeated measurements and survival data for some reasons. Here in our study, we conducted the cluster analysis for a group of patients from their longitudinal and survival models. Moreover, cluster analysis is a statistical methodology that seeks to separate subjects into new groups based on increase homogeneity inside each group and heterogeneity between groups. The clustering analysis could be performed for variables or whole models, which include dependent and independent variables, Ilmarinen, et al. [2,3]. Clustering or classi cation the patients based on joint analysis of longitudinal and survival models could be bene cial to gather more facts and information from the new groups. The joint statistical analysis for longitudinal and survival data together has a wide range of resent applications Ghisletta [4,5]. The joint latent class model can be viewed as clustering the longitudinal and survival data, dividing the population into nite of latent homogeneous subgroups. The latent term model is based on assuming the population are homogeneous latent groups of subjects, Henry [6-8] applied the latent term method for subjects sharing same responses and same risk of event using MLE method via EM algorithm.
MLE through EM algorithm starts to be complicated for models with random e ects of higher dimensions. Also, the clustering of the repeated measurements and survival data can be connected by de ning the marginal density of the responses also as mixture distribution. Kom rek [9] applied the Bayesian estimation of the nite mixture models to cluster longitudinal and survival outcomes. Clustering is a common method and there are many R packages applicable for these problems. Bruckers, et al. [10] propose clustering using pseudo-likelihood algorithm for multivariate re- peated measurements outcomes and performed the clustering using k-means criteria using the pair- wise approach. Their algorithm allocates N observations in clusters or groups based on maximizing their joint models. The cluster criteria are the individual's likelihood contribution. We borrow this idea but for the individual's joint likelihood model as a cluster criterion. We accommodate his algo- rithm, but for connected model from repeated measurements(longitudinal) and survival datasets. The goal is an attempt determines clusters or groups of patients based their characteristics from repeated measurements and survival data. The clustering algorithm will be based on connected models of the change in the longitudinal responses of a subject and the risk of the survival event. The repeated measure’s part and time to event part are conditionally independent given the subject- speci c intercept and slope (latent variables).
The main interesting point in this study is connecting the repeated measurements and survival datasets, since they were obtained from the same patients. This natural correlation may lead to new conclusions from the new unknown groups. Modeling the longitudinal and survival data is familiar in real life, Sweeting, and Thompson [11,12]. We applied clustering algorithm in a suitable application, which the is HIV study. AIDS clinical trial is an appropriate example in which the information of the patients is obtained over many occasions. Here in the HIV study, we compared two treatments, didanosine(ddl) and zalcitabin(ddc). The response is the longitudinal outcome, which is the number of CD4 cells per cubic millimeter of blood, obtained over many occasions to measure the progression of the AIDS disease. However, the time to death (survival data) has a logical relationship to the CD4 biomarker in the longitudinal model. Classi cation the AIDS patients based on their longitudinal and survival data is an interesting research idea to evaluate the two treatments, ddl and ddc. This paper has the following structure, the clustering algorithm in section two is reviewed. Then, section three contains the application of the HIV study where the clustering algorithm is applied. Section 3 contains the study description, the proposed model, and the results. Finally, the conclusion is in section 4.
Let i =1, 2,....N is the number of observations and j =1, 2,....ji is the number of occasions. For easier notations, we will refer to ji to j, assuming all patients have the same number of occasions. timeij is a time of subject i at j occasion. Then, the outcomes can be seen as multivariate Gaussian distribution for the longitudinal responses:

The Cox proportional hazard ration is:
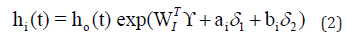
where 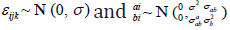 . δ1 and δ2 are scalars. For survival part, hi(t) is hazard of death of occasion t conditional on


Assuming ϑ vector is containing all the parameters from the repeated measurements model, the survival model, and the variance covariance of the random effects. Then, we will use maximum likelihood estimation to estimate ϑ , Song, et al. [14,15]. The clustering approach is based on the likelihood framework. It performed on the following steps:
1. Assume the number clusters S=2 and randomly divide the observations into S clusters.
2. 2- Run the joint modeling of the longitudinal and survival for each cluster separately.
3. Iterate the following steps (a to c) until no observation’s switches cluster anymore.
a. Change the cluster assigning for each observation to the other clusters and compute their likelihood depending on the parameters for each cluster.
b. For each observation, compare the likelihood for each cluster and reclassify it for the cluster that has maximum likelihood.
c. Apply the joint modeling of longitudinal and survival for each cluster.
Study Description and Models
Starting by introducing the HIV disease, it is a virus attacks the immune system. It results in destroying the CD4 cells, which are the white blood cells in our immune system. It gradually declines the count of CD4 and breaks down a patient’s immune system. When a patient lives with HIV without any treatment, he will be vulnerable to infections and diseases. Thus, HIV disease progression is delayed when there is a high amount of CD4 cells. The count of CD4 cells is a primary indicator of HIV disease. This study belongs to the Community Programs for Clinical Research on AIDS (CPCRA). There were 467 patients who were diagnosed with HIV infection. It was performed in accordance with relevant guidelines and regulations and consents were obtained from all patients. Also, Informed consent has been obtained for all participants in the study. The National Institute of Allergy and Infectious Diseases (NIH) sponsored the CPCRA. The HIV study was performed in accordance with relevant guidelines and regulations to NIH institution (Abrams, et al. [16]). These HIV patients are assigned randomly to get the study treatments are didanosine(ddI) or zalcitabine(ddC), starting by 230 patients in ddI group and 236 in ddC group. The non-missing patients over the ve time points in ddI is (230,182,153,102,22) while it is (236,186,157,123,14) in ddC group. It happens in the longitudinal studies to have an increase in the missingness rate over time (dropout) due to many causes such as lack of communications or cure of disease De Gruttola [17-19].
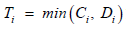
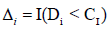
The main outcome is the CD4 count, which is recorded at the study entry is measured at 6, 12 & 18 months. However, the time to death or censoring is measured for each patient. The dataset is a combination of repeated measurements(longitudinal) and survival data. In this study, Yij denotes the square root of CD4 count and the independent variables are included in Table 1:
Table 1: Covariates Variables.

The linear random effects model for square root CD4 count is specified as
The Cox proportional hazard ration is:

Our main goal is to cluster to HIV patients into two groups (S=2) based on the association among CD4 count, survival time, drug group, gender, AIDS diagnosis at baseline (an indicator of disease progression status), and stratum, accounting for all relevant correlations and subject- specific random effects. Since the survival time for each patient in the study is assumed to follow its own hazard function hi(t), we assume the survival time for the ith subject follows exponential distribution exponential distribution,


The Results
To get a better comparison view, we start by conducting the connected modeling analysis for re- peated measurements and survival datasets without clustering. Then, we performed the clustering methodology in that is described in section2 for the same joint model using SAS software. Assuming the number of clusters is two (S=2), then our methodology divided the HIV patients into two groups from their connected model of the longitudinal and survival data. This clustering is carried out by using a 3-steps process to ensure the best classification from their connected model. Now, we will compare the results of parameter estimations with and without clustering. All these results are from the joint model from the repeated measurements(longitudinal) and survival data of HIV patients. Starting from Table 2, we have the description statistics for the covariates and outcomes. The main outcome for the longitudinal model is the mean of the square root of CD4 counts and time to death (the survival data). From these two outcomes, we see group 2 has better results, longer time to death (13.06) and higher count of CD4 over occasions=0, 2 and 6 months are (mean=13.06; SD=5.17), (mean=7.73; SD=4.81), (mean=8.33; SD=5.11), unless at occasion 12 and 18 months where the missingness rate is increased. For the results of covariates, the clustering did not make big difference over the two groups. The key point here is the readings of the longitudinal and survival outcomes for all patients are located between the estimations of the two groups.
Table 2: Descriptive statistics of demographic and clinical variables.

In Table 3 the parameter estimations of the longitudinal model for all patients together and after conducting clustering into two groups. The estimated average of regression coefficient of time covariate for all patients is -0.1668 while its estimation for group 1 is -0.1868 and -0.1618 for group 2. The regression coefficient of Prev covariate, diagnosis of AIDs before stratum, is also significant at -2.3152 before clustering procedure, -2.1774 for group 1, and -2.2064 for group 2. After clustering the patients, we figured out some points. It seems the regression coefficients after clustering are around (less and more) the estimations before clustering. Also, the regression coefficients of Gender covariate are statistically significant in group 1 and group 2 while it was not significant before clustering the patients into two groups. In this study there are 90.36% are male which makes sense to have significant parameter estimation. Table 4 has the survival model regression coefficients for groups 1 and 2. The Gender coefficient estimation has significant estimation on group 2 (95%CI:, 0.4873; p-value=0.0009) where it was not significant before clustering the patients. However, Figure 1 presents Kaplan-Meier survival plots of group1 versus group 2. Looking for the rst 7 months, approximately one month after the baseline, group2 survival outcome has significantly better results than group 1 survival outcome. In Figure 2, the survival curves show the differences between the two types of treatments didanosine(ddI) and zalcitabine (ddC)for each group separately. The Kaplan-Meier survival curves of group2 generally still has higher results for both treatments than group1. However, the survival outcomes of the two types of drugs in group1 has similar curves, but in group2 the treatment didanosine(ddC) has higher survival outcome than zalcitabine (ddI). We conclude the clustering procedure divides the patients into two really distinct groups.
Table 3: Estimations of coefficients, SD and p-value from the longitudinal models for all patients, group1 and group2.

Table 4: Estimation of coefficients, SE and p-value from Cox survival models for all patients, group1 and group2.

Figure 1

Figure 2

In this paper, we build a clustering methodology from the connected models of repeated measurements and survival datasets. The methodology is using the MLE in the clustering algorithm to divide the patients into new groups. The cluster criteria are the joint likelihood from longitudinal and survival models. After some iterative steps, the results are a new classification for S clusters, here we apply it for S=2. The contribution here is identifying new groups of patients based on their repeated measures and survival outcomes. In future, this methodology can be generated in S groups. We found estimation parameters of the new clusters or groups located around the estimation parameters that resulted without doing the clustering procedure, just one group. The application we used is HIV study, consists of patients' reading of CD4 count, time to death and some covariates. The results distinguish two different groups of patients having different patterns of health associated with longitudinal and survival outcomes. The estimation parameters of the new clusters have deeper facts and information. This classification could help to know the group of that has better outcomes of interest.


