info@biomedres.us
+1 (502) 904-2126
One Westbrook Corporate Center, Suite 300, Westchester, IL 60154, USA
Site Map
Received: November 21, 2023; Published: November 29, 2023
*Corresponding author: Marwah Al-Maato, Faculty of Electrical Engineering and Information Technology, Institute for Medical Technology, Chair of Medical Systems Technology, Otto von Guericke University, 39106 Magdeburg, Otto-von-Guericke-Universität Magdeburg Otto-Hahn-Straße 2, Gebäude 82, Raum 147 39106 Magdeburg, Germany
DOI: 10.26717/BJSTR.2023.53.008477
Fundamental prerequisites for MRI biopsy needles involve being non-magnetic while generating minimal MRI artifacts. Advancements in medical science emphasize the significance of visualizing and optimizing spinal biopsy needles through MRI. When developing polymer-based biopsy needles, a balance between mechanical traits and artifact reduction is crucial. The proposed polymer-based needles require mechanical evaluation. Among MRI-compatible spinal cord biopsy needles, magnetic nickel-titanium alloys are common, but their magnetism hinders imaging quality due to susceptibility artifacts. To address this, a coaxial polymer-based biopsy needle design is proposed, using non-metallic materials for the enforced core, inner sheet, and outer hollow sheet, enhancing compatibility and reducing MRI artifacts. This work verifies mechanical disparities between the standard needle and the four proposed polymer-based needles. The objective is to optimize the mechanical performance of polymer-based spinal biopsy needle design. The proposed designs undergo mechanical testing and AutoCAD 3D evaluation. Finite Element Analysis (FEA) in ANSYS assesses mechanical performance, saving time and costs. The design closest to the standard emerges as the best. Further tests explore parameter effects; a comparative mechanical analysis is performed. In conclusion, this study integrates testing, the model design in AutoCAD 3D, and FEA simulation to optimize polymer-based spinal biopsy needles. The proposed modeling design offers promising performance with the specifications of 18.5 gauge and 20 gauge used in biopsy needles.
Keywords: Finite Element Analysis (FEA); Simulation-Driven Optimization; Mechanical Modeling; Structural Analysis; Numerical Simulation; Mechanical Performance Assessment; Polymer-Based Design; MRI-Guided Interventions; Biopsy Needle
Abbreviations: FEA: Finite Element Analysis; PIC: Prospered Inner Core; FoS: Factor of Safety; SBN Standard Biopsy Needles; SS: Stainless Steel
Finite Element Analysis (FEA) technique has gained widespread use in the study of biomedical challenges [1]. Specifically, FEA has been intensely used in biomedical contexts to examine, simulate, and predict the material behavior and non-linear biomechanical properties of soft tissues, organs, bones, and joints. It is also instrumental in applications of modeling, testing, and verification of medical device designs, such as artificial implants, stents, biopsy needles, catheters, and guide wires. The number of reported studies that utilize finite element modeling and related computational numerical methods in the advancement of biomedical and clinical research, development, diagnosis, and treatment applications has constantly increased since 1980 [1-4]. The modeling step is preferred due to the software’s flexible options, lower time and cost requirements, and ability to simplify complex designs for prototyping. It provides an intermediate step in the proposed design Version September 15, 2023 submitted to Journal Not Specified process to apply many mechanical tests and ensure the desired requirements are met. FEA 33 encompasses several crucial testing steps in the simulation process, which are fundamental in achieving accurate and reliable results [5,6]. The experimental results, obtained through the utilization of the mechanical measurement machine (Zwick Roell Z0.5, Ulm, Germany) for testing the biopsy needle prototypes, have indicated the imperative for further analysis and optimization to achieve a satisfactory solution.
This requirement arises due to the associated raw material costs for the prototypes and the necessity to streamline the design and testing process. To address these concerns, a computational model utilizing Finite Element Analysis (FEA) in ANSYS software, specifically the Academic Teaching Mechanical version (R2, 2020), is employed to assess the mechanical properties and enhance the functionality of the non-metallic MRI biopsy needle. The use of FEA allowed for a thorough examination of the biopsy needles’ mechanical properties, enabling a more precise evaluation of their strength, stiffness, and durability. To execute the finite element simulation of the geometry, ANSYS software was used, which requires the specification of geometry, material properties, boundary conditions, and mesh with high precision during the input phase. Any deviation from the specified parameters can lead to unfavorable results [7-11]. The mesh element size is a critical parameter that significantly affects simulation outcomes. When the mesh element size is decreased, accuracy increases, but this also leads to an increase in simulation time. The meshing strategy plays a pivotal role in determining simulation accuracy and duration. A mesh element, a small geometric shape such as a 52 triangle, quadrilateral, tetrahedron, or hexahedron, discretizes the overall structure geometry into simpler subdomains. These elements are interconnected at nodes and defined based on the material properties and structure geometry. Each element generates a local stiffness matrix, characterizing its rigidity.
On the other hand, the global stiffness matrix, assembled from contributions of all individual mesh elements, represents the combined stiffness and interactions of the entire structure. Consequently, FEA with ANSYS involves 58 dividing the structure into mesh elements, each having its local stiffness matrix. These local stiffness matrices are merged to create the global stiffness matrix, governing the overall structure behavior during simulation. The meshing strategy is integral in attaining accurate and efficient simulation results. Initially, ANSYS applied linear elements throughout the model. As the analysis progressed, more complex element types might have been adopted to achieve greater accuracy, especially when capturing intricate behaviors in specific areas. To comprehend needle behavior, the model is subjected to defined boundary conditions, restricting degrees of freedom. Toward the conclusion of the analysis, a global stiffness matrix is generated, enabling the solution of a system of equations for obtaining results [12]. In this work, the execution steps for FEA are illustrated as a flow chart in Figure 1.
Figure 1

In this section, the computational modeling using FEA is performed in two distinct stages, denoted as Design I and Design II, as depicted in Figure 2. This two-stage approach is motivated by the structure of the biopsy needle, comprising an inner core and an outer sheet. In Design I, the focus lies on optimizing the inner core of the biopsy needle, while in Design II, the emphasis shifts to the design and optimization of the outer sheet. The simulation steps were executed for both Design I and Design II in the following steps: -
• Designing the models in 3D AutoCAD software to create biopsy needle structures with the required mechanical test setups.
• Setting the mechanical properties of the materials used with test parameters to evaluate the performance and validate the prototypes by finite element analysis in ANSYS simulation.
• Applying the mechanical bending test in the simulation environment with the required boundary conditions to find the best-proposed biopsy needle performance corresponding to the standard biopsy needle.
• Employing fatigue or breaking point analysis for the needles by calculating the safety factor to find the maximum deflection based on the mechanical properties range.
• Validating the results of simulation for the non-metallic needles using critical parameters.
Figure 2

In Design I, the focus lies on optimizing the inner core of the biopsy needle, while in Design II, the emphasis shifts to the design and optimization of the outer sheet. Consequently, to enhance the performance of the non-metallic PIC of the biopsy needle, mechanical bending tests were conducted. The process of the prospered inner core (PIC) was utilized for the inner core. Expanding upon this, FEA was introduced to analyze PICi with varying diameters. The subscript ’i’ (i) denoted different diameters, considering four distinct designs referred to as proposed inner cores: PIC 1, PIC 2, PIC 3, and PIC 4 as shown in Figure 3. These inner cores were carefully designed with incremental diameters and subsequently compared to the standard NiTi inner core. The non-metallic inner core that was found to work mechanically closer to the standard inner core NiTi was selected as the best proposed inner core. While Design II aimed to find the best non-metallic biopsy needle. As well, four proposed biopsy needles with different diameters for the outer sheet and materials were constructed and compared to the standard biopsy needle. The selected PIC from Design I was used as the core to construct the four non-metallic outer sheets of the biopsy needles in Design II. The four non-metallic outer sheets were referred to as PBNs numbered 1, 2, 3, and 4, while the NiTi needle was referred to as SBN. The PBN that behaved mechanically closer to the SBN was selected as the best non-metallic PBN for MRI-guided interventional procedures. The modeling process was carried out in two distinct steps.
Figure 3

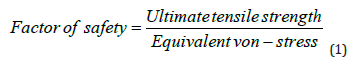
Firstly, the design was created using AutoCAD software (2021). Secondly, ANSYS, was employed for conducting simulations. In this second step, the geometric assignment, meshing, and static structural analysis were performed. The proposed materials used during the initial stage of the fabrication process for biopsy needles, as well as in the subsequent mechanical testing through experimental setup along with its parameters were applied and executed in FEA. In the mechanical characterization, it should be noted that ultimate tensile strength is the maximum stress that material can withstand while being stretched or pulled before breaking [13]. Therefore, the equivalent test in FEA is the stress vs. displacement for the core needle in Design I and then for the biopsy needle in Design II. An important test parameter used in this work during the simulation implementation is the Factor of Safety (FoS), as shown in equation 1. The FoS is calculated in ANSYS and serves to inform the user about the material’s fatigue analysis and its potential for breakdown [14]. An important test parameter used in this work during the simulation implementation, defined as the Factor of Safety (FoS) as shown in equation 1 is calculated in ANSYS, which informs the user of the fatigue analysis or breakdown of the material [14,15]. FoS is the ratio between the ultimate tensile strength and the equivalent stress ultimate tensile strength is a material property used to describe the maximum stress a material can withstand before it fails in tension.
It is a critical mechanical property for evaluating the structural integrity and safety of engineering components. While equivalent von - stress is a scalar value used to represent the combined effect of different types of stress on a material element. FoS values are typically within the range of 0 to 15, which can help engineers assess the safety of their designs. Understanding the FoS values is crucial to identifying whether a material or structure can withstand applied loads without failure. When the FoS value is between 0 and 1, it signifies that the equivalent stress has exceeded the ultimate tensile strength of the material. This situation indicates a critical safety concern, as the material is prone to failure and breakage under the applied load. On the other hand, FoS values between 1 and 15 indicate a safer scenario, as the equivalent stress is below the ultimate tensile strength. In this range, the material has a sufficient safety margin, and it is less likely to fail due to applied loads [16-19]. A FoS value below 1 suggests that the design may not be safe and requires further modifications, while a value between 1 and 15 indicates a design with an acceptable level of safety, as the stress levels are below the material’s ultimate tensile strength. In this study, I applied the factor of safety in both Design I and Design II. This parameter plays a significant role in assessing the structural integrity and safety of the designs.
To validate the results of the final prototype, ANSYS was used to perform an automatic mesh convergence test. Meshing is a critical step in FEA that involves dividing the geometry into a set of finite elements called nodes and elements [20]. The mesh ensures the accuracy and reliability of results. The accuracy of the FEA results is heavily dependent on the size and quality of the mesh used in the simulation [21]. It is essential to generate a mesh that has a sufficient element size, which increases the number of nodes and elements in the model. As the mesh element size decreases, the number of nodes and elements generated increases, resulting in a more accurate representation of the physical system being analyzed [22-24]. The following section presents the computational modeling of Design I first then Design II in FEA consecutively.
3D model in AutoCAD for Design I
Three-dimensional (3D) drawing designs were created for both the standard inner core, made of NiTi, and four proposed inner cores, each consisting of three main structures: the inner core, tip, and inner core holder as presented in Figure 3. The designs included varying diameters to evaluate mechanical performance in comparison to the NiTi core. All sketches were initially created in the’. dwg’ format, which stands for ’Drawing.’
and is a file format used by AutoCAD. Later, these sketches were converted to the’.sat’ format, which stands for ’Standard ACIS Text’, SAT files are used to represent 3D solid models and can store data related to the geometry, topology, and other attributes of the model. SAT files are commonly used for interoperability between CAD and FEA software, enabling simulation in ANSYS. Before conducting a simulation in ANSYS, the model was imported, and the materials for the FEA were specified as follows: NiTi was chosen for the NiTi core, Fiberglass (FG) was selected for the PIC with 4 different diameters, and Stainless Steel (SS) was used for the structural support to fix the core in place for performing the test. The dimensions used to sketch for both the NiTi core and PICs are shown in Table 1. The total length of the standard and proposed inner cores is 133.23 mm when all parts are assembled (Figure 4). While the dimensions to design the 3D parts for the mechanical 2-point bending setup were taken from the measurements of the dimensions of the experimental bending setup presented in Appendix Figure 1 and displayed as a 3D model from AutoCAD in Figure 5 with the following dimensions for the pusher (length 20mm x width 2mmx height 97mm) and for the fixation (length 25mm x width 35mm x height 25mm). Subsequently, the complete setup used for the needles with different diameters is illustrated in Figure 6.
Figure 4

Figure 5

Figure 6

Table 1: Dimensions used in FEA simulation for the standard inner core and proposed inner cores.

Simulation in ANSYS for Design I
The 3D AutoCAD sketch was imported into ANSYS Workbench. The simulation steps for Design I were executed as follows:
Geometry and Properties of Materials Used: The initial step in conducting an FEA using ANSYS simulation involved assigning the material properties to each part used in the model. The mechanical specifications of the materials used in needle design and bending setup were presented in Table 2. In our study, I assigned the bending setup parts as SS, the standard core as NiTi, and the proposed inner cores as FG.
Table 2: Mechanical properties of the materials used in the FEA simulation in Design I [7–10,24–29].

Meshing and its Parameters: Generating a mesh composed of discrete elements 184 that are connected by nodes to represent the geometry of the model. In the 2-point bending test used in this study, the regions of interest were the face where the inner core emerged from the fixation and the faces where the pusher came into contact with the inner core. FEA simulations include three essential parameters: element size, resolution, and refinement. Element size refers to the size of each element in the mesh, with smaller elements resulting in higher mesh density and a more accurate representation of the geometry. When the mesh element size is decreased, accuracy increases, but this also leads to an increase in simulation time. Resolution determines the number of elements in the mesh, with a higher resolution resulting in a finer mesh, allowing for more detailed representation and improved analysis accuracy. Mesh refinement involves concentrating higher mesh density in specific regions of interest, capturing critical details, and obtaining accurate results while using a coarser mesh in less critical areas to optimize computational resources. By carefully optimizing these mesh parameters, engineers can strike a balance between accuracy and computational efficiency, ensuring reliable and meaningful results in FEA simulations. The resolution is typically specified as the number of elements per unit length, area, or volume, depending on the type of mesh being used. Refinement controls the level of mesh refinement in regions of interest.
It is usually applied in areas where there are rapid changes in geometry or where high stresses are expected. A higher refinement level results in more elements being used in these regions, leading to a more accurate solution. Adjusting and selecting the appropriate mesh parameters is essential to achieve reliable and precise outcomes from the FEA analysis. In this study, the mesh parameters used for the 2-point bending test were specified as element size = 6mm, resolution = 3, and refinement = 3. Despite attempts to further reduce the mesh size, it was not feasible to do so due to inherent limitations within the ANSYS software version. It is important to note that the mesh element size had to be maintained at a minimum value of 6mm to ensure accurate simulations within these software constraints. However, to ensure the accuracy of the obtained results, the selected mesh element sizes were thoroughly validated and their impact on the study outcomes was discussed in the results and discussion section as uncertainty analysis. Table 3 presents the number of nodes and elements that are generated during the simulation for the standard and the proposed inner cores. Nodes and elements for the mechanical bending setup are illustrated in Table 4. The mesh behavior of all modeled core 219 designs is depicted and presented in Figure 7.
Table 3: Number of nodes and elements for NiTi core and proposed inner cores used in the ANSYS simulation for the bending setup.

Note: PIC stands for Proposed Inner Cores.
Table 4: Number of nodes and elements for SBN and PBNs in mechanical setup.

Figure 7

Static Structural Analysis: According to the mechanical 2-point bending setupthe boundary conditions required that one side of the setup, including the standard inner core and proposed inner cores, be fixed in place (fixed support), while the other side remained free to move and underwent displacement. The fixed support was achieved by securing the faces of the inner core holder and the fixation, totaling nine faces, preventing any movement of the standard and proposed inner cores on that side. On the opposite side, all faces of the pusher, including the standard and proposed inner cores, were subjected to displacement in the direction of bending, amounting to four faces. The mechanical setup for both the standard and proposed inner cores was illustrated with fixed support and displacement boundary conditions in Figure 8.
Figure 8

Force Reaction vs. Displacement: In the bending test simulation of Design I cores using ANSYS, the pusher displacement was set to 2 mm. The force was indirectly applied through a pusher displacement of 2mm. The pusher represented the mechanism that applied the bending load to the cores’ needles. As the pusher was displaced by 2mm, it induced bending deformation in the cores’ needles. This deformation generated internal forces, known as reaction forces, within the cores, resisting the applied displacement. To measure these reaction forces, a force reaction probe was used, which recorded the force values in Newtons (N) exerted by the inner core structures in response to the bending load. The pusher displacement for the bending test was set to 2mm for the cores needles in Design I under ANSYS simulation. In this context, to check the variation for the force reaction results compared to the pusher displacement, minimum and maximum values of material mechanical properties were used in the ANSYS simulation from Table 2.
Stress vs. Displacement: After the force reaction displacement test for the core needles, further mechanical simulation tests by FEA were applied to optimize the performance of the non-metallic biopsy needles. Therefore, a stress test was simulated to check if the stress crosses the ultimate tensile strength of the standard inner and the best proposed inner cores from the force reaction vs. displacement test. The ultimate tensile strength of the standard inner core material NiTi is 1450MPa, as shown in Table 2. On the other hand, the proposed inner cores made of fiberglass material have a range of ultimate tensile strength values, ranging from 2415MPa to 4890MPa, as also shown in Table 2. Therefore, based on the results, there is conclusive evidence that the stress values did not cross the ultimate tensile strength limit when the pusher displacement was 2mm for both minimum and maximum values of mechanical material properties. For this reason, pusher displacement must be increased to find the breaking point in the standard inner core and proposed inner cores.
Breaking Point (Safety Factor vs. Displacement): As noted in the previous point, the stress vs. displacement test indicated that increasing the pusher displacement beyond 2mm up to 10mm was necessary to assess the breaking point or fatigue of both the standard and optimal non-metallic inner cores. This evaluation will incorporate the minimum and maximum range values of mechanical material properties to ensure accurate and comprehensive analysis. In the Design II stage, the simulation process commenced by using the optimal PIC diameter identified from Design I to develop a new coaxial configuration for the biopsy needles. As the study required a biopsy needle with a multi-layer concept, the single-core structure in Desgin I was replaced with three core structures, each supporting a 0.245mm diameter for the fiber bundle. Combining the diameters of the three cores resulted in an inner diameter of 0.49mm. The proposed design, shown in Figure 9, was accurately represented by applying four outer hollow sheets with varying diameters and different materials in the biopsy needle. Subsequently, a 3D model of four non-metallic biopsy needles was developed in AutoCAD, incorporating the best inner core diameter from Design I. The simulation process in ANSYS for Design I was replicated in Design II, encompassing the essential steps such as static structural analysis, mechanical bending test, and meshing. The detailed procedures for these simulations have been included in the Appendix for reference (Appendix Figures 1-4) (Figure 10).
Figure 9

In Design II, I employed an advanced simulation methodology, refining it by adjusting additional parameters to significantly enhance result accuracy. The simulation process was precisely described, including the precise materials assignment. The focus was on modeling both standard biopsy needles (SBN) and the innovative proposed biopsy needles (PBN) are illustrated in the Appendix Table 1. Display the material properties used for SBN and PBN, respectively. The standard and non-metallic biopsy needles were designed using the dimensions represented in Tables 5 & 6. For the non-metallic needles, the proposed outer hollow sheet materials included PEEK, PTFE, and FEP, while PI was assigned to the core needles as the middle hollow sheet layer. The mechanical properties of the materials used in Design II are listed in Table 7. The mesh parameters used in Design I were also applied in Design II, and the nodes and elements were generated as shown in Appendix Figure 2.
Figure 10

Figure 11

Figure 12

Figure 13

This section presents the simulation results obtained through the FEA modeling technique. The results are presented in two distinct stages. The first stage describes the outcomes of Design I, which involved the design and testing of core needles. The second stage presents the findings related to the optimal structure and design of biopsy needles in Design II.
Design I: Inner Cores
The results for simulation by FEA for Design I introduced the following tests sequence:
Force Reaction vs. Displacement: This test is utilized to conduct a 2-point bending simulation in ANSYS, employing static structural analysis. The obtained results are based on a spectrum of values assigned to the mechanical properties of the materials, as detailed in Table 2. This section presents and examines these results, with a specific focus on the correlation between observed deformation and applied loading. Additionally, the acquired data is compared and an- alyzed against a standard NiTi needle (Figure 11a) illustrates the force values in Newtons (N) in relation to the pusher displacement of 2mm, corresponding to the minimum values of Young’s modulus, Bulk modulus, and Shear modulus as extracted from Table 2. The pusher displacement was initiated at 0.1mm and incremented at 0.1mm until reaching a maximum displacement of 2mm. Throughout the displacement process, force reaction readings were recorded, providing data on the mechanical response of the core needle under this test. A pusher displacement of 2mm was applied to the standard inner core (SIC) and the corresponding force required to achieve this displacement was measured, resulting in a value of 0.35N. Simultaneously, the corresponding forces for the proposed inner cores referred to as PIC 1, PIC 2, PIC 3, and PIC 4, were found to be 0.06N, 0.99N, 79N, and 14.37N, respectively as presented in Figure 11a.
Figure 14

Based on the observations, PIC 2 exhibited superior mechanical and logical performance compared to the other four core needles in Design I. Consequently, it was chosen as the optimal inner core for this experiment and found comparable to SIC. This determination arises from the force required to achieve a pusher displacement of 2mm, which serves as a direct indicator of the mechanical efficiency and resistance of each inner core design. PIC 2’s force of 0.99N falls within a reasonable range, indicating a balance between stiffness and flexibility. This suggests that PIC 2 is able to withstand the applied force without excessive deformation, making it mechanically robust. The consistency of force-displacement behavior across the different inner core designs is an important consideration. While PIC 1 and PIC 3 show significantly lower and higher forces, respectively 0.06N and 4.79N, PIC 2’s force of 0.99N lies between these extremes. This suggests that PIC 2 maintains logical consistency with the expected behavior of an optimal inner core design. The force required to displace the SIC by 2mm is measured as 0.35N. PIC 2’s force of 0.99N is in closer proximity to the force exhibited by the SIC, indicating that it offers a balance between the desired performance and the existing standard. This comparability ensures that PIC 2 is a suitable candidate for practical use. Notably, the measured diameter of PIC 2 was 0.49mm, which exhibited minimal divergence from the diameter of the standard inner core, measured at 0.40mm. This close alignment in diameter between PIC 2 and SIC is a crucial factor, indicating that PIC 2 can be seamlessly integrated into the existing framework without requiring substantial modifications.
Figure 15

The 2-point bending test was repeated under conditions of maximum values for Young’s modulus, Bulk modulus, and Shear modulus from Table 2, and the resulting force reactions versus pusher displacement are presented in the following Figure 11b. For a pusher displacement of 2mm, the force reactions (N) for SIC, PIC 1, PIC 2, PIC 3, and PIC 4 were found to be 0.64N, 0.10N, 1.65N, 7.99N, and 23.96N, respectively. Among the PIC variants, PIC 2 exhibited mechanical performance closer to that of SIC. While PIC 3 and PIC 4 displayed higher tensile strength, their diameters surpassed the acceptable range for an MRI biopsy needle, previously specified to be within 18-22 gauge (0.70mm-1.27mm). This made PIC 2 the optimal choice once again for this test. Hence, PIC 2, with a diameter of 0.49mm from FG material, was selected as the final output core for Design I. PIC 2 will serve as the input for the second stage of Design II, contributing to the completion of the biopsy needle’s design. To assess uncertainty using the maximum and minimum material properties, a sensitivity analysis can be conducted. This involves varying the material properties within their defined ranges (maximum and minimum values) and observing the resulting effects on the design outcomes. By performing simulations or calculations with different property combinations, the design’s sensitivity to variations in material properties can be quantified. Such an analysis provides insights into how uncertainties in material properties might influence design performance, aiding in informed decisions regarding the design’s robustness and reliability under varying conditions.
Stress vs. displacement: The NiTi material exhibited an ultimate tensile strength of 1450MPa when tested for the SIC, as reported in Table 2. The theoretical simulation requires the ultimate tensile strength to be surpassed to indicate material breakage, along with a safety factor indicator of less than 1 [25]. In Table 8 it was observed that the SIC had a loading of 528.17MPa and a safety factor of 2.74 at 2mm pusher displacement, which indicates that there is no breaking point in the material. Likewise, the best-performing PIC 2 from the force vs. displacement test exhibited an ultimate tensile strength of 2415MPa for fiberglass (FG) material. The stress and safety factors at 2mm pusher displacement for the best PIC were 45 MPa, and the safety factor was 3.41, indicating no breaking point in the material as well as stability. The interval safety factor for the maximum values of Young’s modulus, Bulk modulus, and Shear modulus is presented in Table 9. The data show that the stress values for 2mm pusher displacement are well below the ultimate tensile strength limit. This robustly suggests that the materials have not reached their breaking point under the current loading conditions. However, to fully characterize the mechanical behavior of the SIC and PIC, it is recommended to increase the pusher displacement until the breaking point is reached. This will allow for a comprehensive understanding of the materials’ strength and failure properties, which is crucial for ensuring their safe and reliable use in the intended application [26-28].
Table 5: Dimensions used in FEA for the Design II stage for the standard biopsy needle (SBN).

Table 6: Dimensions of the non-metallic PBNs in FEA.

Table 7: Material Mechanical Properties Used in FEA Simulation for Design II.

Table 8: The stress and safety factor for the SIC and the best PIC were obtained through simulation testing of Design I. The test was conducted at a 2mm pusher displacement, using the minimum range values for Young’s modulus, Bulk modulus, and shear modulus.

Table 9: Simulation test results for the stress and safety factor for standard and best proposed inner core for 2mm pusher displacement when the mechanical properties of the materials are at maximum range in Design I.

Table 10: Breaking point simulation test in Design I for the SIC and PIC at 10mm pusher displacement when mechanical properties are at a minimum range.

Breaking Point (Safety Factor vs. Displacement): The pusher displacement was incrementally increased up to 10mm to identify the point of failure in the SIC and determine the optimal PIC. This assessment was conducted for mechanical properties at both the minimum and maximum ranges of mechanical properties, including Young’s modulus, Bulk modulus, and Shear modulus. In this context, 10mm displacement was applied to the SIC using the ultimate tensile strength for the range values of Young’s modulus, Bulk modulus, and Shear modulus. The results of this test are shown in Table 10. It is observed that the stress and safety factor of the SIC indicates breaking of the material between 5.0mm and 5.5mm for a 10mm pusher displacement because the value of safety facts was 0.94, less than 1. Similarly, the optimal PIC exhibits a safety factor of less than 1, signifying failure occurring at a displacement range between 6mm and 6.5mm. Table 11 presents the breaking point performance for both SIC and PIC materials at the maximum value of their Young’s modulus, Bulk modulus, and Shear modulus mechanical properties. The results indicate that the breaking point occurred for the SIC when the displacement was between 2.5mm to 3mm. Simultaneously the PIC 2 breaking takes place displacement between 7 to 7.5mm. Based on these findings and considering all the mechanical properties tested, it can be concluded that the PIC 2 has a higher breaking point than the SIC, as a larger pusher displacement is needed to reach failure [29-30].
Design II: Biopsy Needles
The second stage of the FEA simulation involved presenting the mechanical characteristics of the complete biopsy needle, which includes the outer sheet and inner core. To obtain the necessary data, the mechanical material properties from Table 7 were applied.
Force Reaction vs. Displacement: The simulation results of force versus displacement for Design II, utilizing materials with minimum mechanical properties for Young’s modulus, Bulk modulus, and Shear modulus, are presented in Figure 12a depicting the relationship between the force values, measured in Newtons (N), and the pusher displacement of 2mm for the biopsy needles at the minimum range of Young’s modulus, Bulk modulus, and Shear modulus. Similarly, Figure 12b illustrates the force reaction behavior of the needles when the mechanical properties of Young’s modulus, Bulk modulus, and Shear modulus are set to their maximum range. Based on the mechanical material properties analysis, the PBN 1 design is selected as the optimal biopsy needle. This is due to the use of a hollow outer sheet made of PEEK material with a diameter of 1.15mm. The superior mechanical performance of PBN 1 becomes evident when considering the biomechanical behavior under conditions of minimum material properties. The inclusion of a hollow outer sheet made of PEEK material introduces increased structural integrity and stability. This design feature enhances the needle’s ability to withstand applied bending forces without experiencing detrimental deformation. Furthermore, the larger diameter 1.15mm of the PBN 1’s hollow outer sheet provides enhanced resistance to bending and buckling, particularly when compared to the SBN as shown in Figure 12b. This resistance translates to improved structural robustness and reduced vulnerability to mechanical failure, even when subjected to conditions of minimum Young’s modulus, Bulk modulus, and Shear modulus. The PBN 1 design is seen as the optimal biopsy needle design, with a diameter of 1.15mm.
Figure 16

Stress vs. Displacement: In the second phase of our design process, Design II, additional test analyses aimed at comparing and evaluating the stress and safety factors of the new PBNs in comparison to the SBN. Utilizing a 2mm pusher displacement for the mechanical bending setup, I present the details of the simulation results at both the minimum and maximum range for Young’s modulus, Bulk modulus, and Shear modulus in the Appendix Tables 2 & 3. The results conclusively demonstrate that, under a 2mm pusher displacement for mechanical material properties, the stress values remain well within the ultimate tensile strength limit. This indicates that the material’s structural integrity remains intact, as the stress levels experienced do not surpass the maximum threshold for deformation or failure. The corresponding mechanical material properties are provided in the accompanying (Table 7). For this reason, pusher displacement was increased to 10mm, similar to the procedure for Design I, to find the breaking points in the standard and proposed inner cores.
Table 11: Appendix Table 1: Materials assignment in the mechanical setup for proposed biopsy needles

Table 12: Appendix Table 2: Stress and safety factor for standard and best-proposed biopsy needle with 2 mm pusher displacement at minimum material properties values in Design II.

Table 13:Appendix Table 3: Simulation test results in Design II for the stress and safety factor for the needles at 2 mm pusher displacement for maximum mechanical properties.

Breaking Point (Safety Factor vs. Displacement): After conducting an analysis, the pusher displacement was increased to 10mm. The corresponding results are presented in Table 12, and they are cross-referenced with the minimum values of Young’s modulus, Bulk modulus, and Shear modulus found in the Table 7, it is evident that the safety factor falls below 1, and the stress exceeds the ultimate tensile strength for the NiTi inner core and outer sheet material used in the SBN. Specifically, when the pusher displacement is increased from 5.5mm to 6.0mm, the safety factor falls below 1, indicating that the SBN is highly likely to break under these loading conditions. While the performance of PBN 1 under pusher displacement revealed that the safety factor dropped below 1 when the pusher displacement was increased from 7.5mm to 8.0mm, indicating that the fiberglass core experienced a failure between these displacements and the stress values reached 2530.3MPa. Subsequently, the mechanical properties of SBN were investigated, and at their peak, the material exhibited maximum values for Young’s modulus, Bulk modulus, and Shear modulus. The ultimate tensile strength of SBN was determined to be 1461.2MPa, as illustrated in Table 13. However, when the pusher displacement was increased from 3.0mm to 3.5mm, the safety factor dropped below unity, indicating that the material had failed between these displacement values. The cause of the failure was attributed to the applied stress exceeding the ultimate tensile strength of the material.
In the case of PBN 1, the safety factor also dropped below unity when the pusher displacement increased from 9.0mm to 9.5mm, and the applied stress reached a level of 5188.1MPa. This decrease in safety factors suggested the potential failure of the needle’s inner core. This event could cause severe damage and have significant consequences. Finally, it is important to note that the failure points for both SBN and PBN 1 were successfully identified, indicating an increased time to failure as pusher displacement increased under all the mechanical properties ranges. In comparison, SBN failed at a faster rate than PBN. These findings are significant in understanding the failure behavior of biopsy needles under varying conditions and can influence design and optimization efforts for improved structural performance. From the observations, several notable mechanical 457 property features were achieved in PBN 1 in comparison to SBN. Firstly, PBN 1 exhibited a higher ultimate tensile strength, indicating its ability to withstand greater applied forces before reaching a point of failure. This increased strength is indicative of enhanced load bearing capacity and structural robustness, suggesting potential improvements in biopsy needle durability. Secondly, PBN 1 demonstrated a more uniform stress distribution along its length under varying pusher displacements. This uniform stress distribution signifies a balanced load distribution and reduced localized stress concentrations, which can contribute to minimizing tissue damage during biopsy procedures.
Table 14: Breaking point simulation test for the SIC and best PIC at 10mm pusher displacement for maximum values of material properties in Design I.

Table 15: Simulation results for the breaking points of SBN and the top performing PBN 1 were obtained for a 10mm pusher displacement using the minimum values of Young’s modulus, Bulk modulus, and Shear modulus.

Table 16: Simulation results for the breaking points of needles at 10mm pusher displacement for maximum mechanical properties in Design II.

Additionally, PBN 1 exhibited a higher safety factor across different displacement ranges, highlighting its improved capacity to handle mechanical loads without compromising its integrity. These observed mechanical property features in PBN 1 underscore its potential for enhanced performance and safety in clinical applications compared to SBN. The outcome of the FEA model-generated design presented in Figure 13, resulting in the proposed biopsy needle PBN 1 with a diameter of 1.15mm, holds significant importance due to its direct implications for optimizing the design of biopsy needles. By successfully tailoring the diameter to match the necessary mechanical performance of the standard biopsy needle (SBN), this achievement highlights the capability of the FEA modeling approach to guide and inform engineering solutions for medical applications. The selection of a 1.15mm diameter for PBN 1, based on simulation-derived insights, demonstrates a rational and data-driven approach to enhancing the structural integrity and functional effectiveness of biopsy needles. This not only showcases the potential of computational tools in guiding design decisions but also underscores the feasibility of achieving improved performance while adhering to essential mechanical requirements. Therefore, this outcome provides a valuable precedent for utilizing advanced simulation techniques in the medical device design process, leading to more refined and optimized solutions that can contribute to enhanced patient care and procedural outcomes.
A comprehensive analysis was done in this work to optimize the dimensions for the biopsy needles in parallel with functionality, keeping in mind the standard needle gauge. It is important to mention the FEA allowed for evaluating the prototyping for the biopsy needles across a range of mechanical material properties, including both minimum and maximum values of Young’s modulus, bulk modulus, and shear modulus. Through modeling, four proposed biopsy needles of different materials and diameters were constructed and placed in the simulation mechanical bending test to verify mechanical performance. According to the tensile strength, the closest version to the SBN was in PBN 1 with a diameter of 1.15 mm (18.5 gauge), made of PEEK material hollow outer sheet with three fiberglass rods as inner core. It was chosen as the best-proposed biopsy needle. Further optimization was carried out to match the mechanical performance of SBN. Consequently, From the best achievement of PBN 1, the diameter for the hollow sheet was reduced to 0.95 mm (20 gauge) with a minimum range for mechanical properties. Then the hollow outer sheet diameter for the same PEEK materials was increased to 1.25 mm (18 gauge) at maximum material properties. With all simulation changes, PBN performed mechanically closer to SBN. The idea of this change was to provide a flexible range for the structure of the biopsy needle according to the medical needs, following a standard gauge. The breaking point analysis was carried out on PBN 1 and SBN 1, and it was found that PBN 1 could deflect higher than SBN 1 before breaking. As a result, we found that the proposed non-metallic concept achieved promising mechanical performance compared to the standard needle.
Writing-original draft, Methodology, Investigation, Formal Analysis, M.A., H. K., Investigation M.A., H. K., review and editing M. O. All authors have read and agreed to the published version of the manuscript.
Please add: “This research received no external funding.
Not applicable.
Not applicable.
Not applicable.
Thanks to Otto von Guericke University, for providing software to implement the simulation the support of the project experimental equipment.
The authors declare no conflict of interest.


