info@biomedres.us
+1 (502) 904-2126
One Westbrook Corporate Center, Suite 300, Westchester, IL 60154, USA
Site Map
Received: November 13, 2023; Published: November 22, 2023
*Corresponding author: Bin Zhao, School of Science, Hubei University of Technology, Wuhan, Hubei, China
DOI: 10.26717/BJSTR.2023.53.008468
With the rapid growth of China’s economy, all walks of life have developed healthily and stably. The relationship between education, finance and the economy is becoming closer and closer. It is urgent to investigate the relationship between the three to achieve the right remedy. It is urgent to investigate the relationship between the three to achieve the right remedy. The study of the relationship between education, finance and economy has a certain representativeness and practical significance. Firstly, using Pearson correlation coefficient analysis method and copula entropy, this paper selects the index data of the three subsystems of education. Firstly, using Pearson correlation coefficient analysis method and copula entropy, this paper selects the index data of the three subsystems of education, finance and economy in Hubei Province from 2005 to 2020, and discusses the correlation degree between education, finance and economy in detail. Secondly, it constructs the coupling coordination degree model of the three subsystems of education, finance and economy, obtains the coordination degree and Secondly , it constructs the coupling coordination degree model of the three subsystems of education, finance and economy, obtains the coordination degree and coordinated development level of the three subsystems, and constructs the GM (1,1) grey-prediction model to predict the coupling coordination degree in The results show that there is a strong correlation between education and finance, education and economy, finance and economy.
It is predicted that it will continue It is predicted that it will continue the previous slow upward trend from 2021 to 2024, and initially reach the stage of good, coordinated development in 2024. In order to further promote the coordinated development of regional education, finance and economy in China and provide reference for the construction of domestic education finance In order to further promote the coordinated development of regional education, finance and economy in China and provide reference for the construction of domestic education finance economy system, this paper puts forward reasonable suggestions: starting from the internal governance of the two systems, promote the benign This paper puts forward reasonable suggestions: starting from the internal governance of the two systems, promote the benign development of the three systems; Increase investment in education and pay attention to the quality of education and teaching; Accelerate the The paper puts forward reasonable suggestions: starting from the internal governance of the two systems, promote the benign development of the three systems; Increase investment in education and pay attention to the quality of education and teaching; accelerate the optimization and upgrading of education structure and economic structure; Strengthen financial supervision and improve the participation of The Government of the Republic of Korea will continue to promote the development of the three systems;
Increase investment in education and pay attention to the quality of education and teaching; Accelerate the optimization and upgrading of education structure and economic structure; Strengthen financial supervision and improve the participation of investors in the financial market.
Keywords: Education; Finance; Economics; Pearson Correlation Coefficient; Copula Entropy; Coupled Co Scheduling
Background
In the context of the new era, China’s economy has grown rapidly, and according to the National Bureau of Statistics-China Statistical Yearbook 2021, China’s domestic GDP has grown continuously, from 367.87 billion yuan in 1978 to 100,878.25 billion yuan in 2020, an increase of nearly 273 times. Since the reform and opening up, the level of education has also gradually increased along with the economic development, financial construction and the improvement of people’s living standards. During this period, the state has made a large amount of investment in education, and in 1977, college entrance examinations were resumed throughout the country, and the education level of students has increased year by year. With the gradual deepening and reform of the education system, the investment in education funds has played a great role in the development of China’s national economy Promoting role [1]. With the gradual deepening and reform of the education system, the investment in education has greatly contributed to the development of China’s national economy. Developing education and improving the quality of the population is a prerequisite for implementing the strategy of strengthening the country through education, promoting economic growth and social progress and development, and is a long-term strategic choice for realizing China’s socialist modernization. The report of the 19th Party Congress points out that “building a strong education country is a fundamental project for the great rejuvenation of the Chinese nation, and we must give priority to education, speed up education modernization, and provide education that satisfies the people”.
The national “14th Five-Year Plan” and “2035 Vision” also emphasize the need to improve national quality, build a quality education system, optimize the population structure, and expand the population quality dividend.[1] The national “14th Five-Year Plan” and “2035 Vision” also emphasize the need to improve national quality, build a quality education system, optimize population structure, and expand the population quality dividend. The relationship between education level, financial construction and economic development is becoming increasingly close, and a better education system will drive economic development and improve economic structure. In order to further improve the construction of domestic education-finance- economy system, the correlation between education, finance and economy needs to be explored more deeply.
Significance
In the process of economic and financial development, there exists a dynamic relationship between the level of education, financial development and economic growth, which is mutually influential, mutually constraining, interdependent and mutually promoting. On the one hand, sustained and stable economic growth and rapid financial development provide a good material basis for improving education investment; on the other hand, the improvement of education level can also accelerate the speed of economic development and improve the quality of financial development by improving human capital, increasing the quantity of talents and improving the quality of talents. The system constituted by education level, financial development and economic growth is an open system with high complexity, uncertainty and multiple levels, and the three aspects both promote and constrain each other, so it is worthy of in-depth research and exploration. The correlation analysis of the three aspects, namely, education level, financial development and economic growth, on the one hand, the analysis between the two helps us to gain a deeper understanding of the reasons for the incompatibility between education level, financial development and economic growth, and provides a scientific basis for the reasonable regulation of the construction between the two. On the other hand, the analysis between the three helps to further control the construction of the domestic education- finance-economy system, and the conclusions drawn can provide certain reference for the improvement of China’s comprehensive national power, which can provide reference for the relevant departments’ decision making at the macro level.
Review of Domestic and International Literature
Financial development can accelerate economic development, and it is the increase in the level of economic development that truly and effectively creates equity in education, which in turn plays an active role in promoting human capital optimization, scientific and technological progress, and direct wealth creation. In conclusion, financial development can provide the financial needs for economic development, while economic development promotes the equity of education. The exploration of the relationship between education level, financial construction and economic growth has been studied by many scholars at home and abroad.
Analysis of the Correlation between the Level of Educational Development, the Level of Financial Development and the Level of Economic Development: QIN Qiaoling [2] analyzed the impact on educational equity from the perspective of financial development, constructed an econometric model, and conducted an empirical analysis on the impact of financial development and economic development on educational equity, collected panel data of 31 regions in China from 2000-2016, and established a panel cointegration and error correction model, the empirical results show that, overall, the direct impact of economic development on educational equity is significant, and the financial development has a non-significant direct effect on educational equity, but shows different indirect effects in different regions through economic development: significant at the national level and in the eastern region, but not in the central and western regions; Wang Chengzong [3] indicates that the Friedman test in non-parametric statistics shows that there are significant differences between the central provinces in both hard power (economic development level) and soft power (education resource situation), and the Spearman rank correlation coefficient indicates that the correlation between financial development and economic development is strong and the correlation between higher education development and economic growth is weak in the six central provinces, and on this basis, corresponding policy recommendations are put forward to promote the rapid rise of the six central provinces.
Analysis of the Correlation between the Level of Financial Development and the Level of Economic Development: Zarrouk [4] find that the direction of causality between finance and economy is from financial development to economic growth, and reverse causality does not drive this relationship, using Islam as an example. Jinping Dai[5] showed that financial frictions are an important factor leading to economic turmoil in China, and financial fluctuations caused by financial frictions are significantly correlated with real economic changes; Ren Xiaoyi [6] showed that local economic development indicators set too high significantly raise the risk of company stock price collapse; Chen Yulu [7] show that only when the financial cycle is in a more stable norm does it contribute to economic growth and financial stability. Conversely, the negative impact on economic development and financial stability is evident whether the financial cycle is too hot or too cold; Jinping Dai and Dongpo Liu [8] found through empirical analysis that in the short run, economic growth is beneficial to financial stability, but in the medium and long run, economic overheating is detrimental to financial stability.
Analysis of the Correlation between the Level of Educational Development and the Level of Economic Development: MG Kolosnitsyna and YE Ermolina [9] found the results of the study confirm the positive long- term impact of total education spending on GDP. However, the difference is that in rich and powerful countries investment in education at all levels has a positive impact on GDP, while in poor countries only primary education has a positive return, while spending on secondary and vocational education reduces GDP; Prince B [10] showed a positive relationship between human capital and short-term economic growth in their analysis. Xie Xiugang [11] found through the analysis of 17 years of statistical data of 30 provinces, it is concluded that education investment and economic growth are positively correlated, that is to say, education investment can significantly improve economic growth, but its effect is in the shape of a wave, and when basic education reaches a certain level, the influence of education investment on economic growth becomes stronger and weaker; Chen Miao miao and Yang Jiaxin [12] pointed out that regional vocational education in Guangxi has a great influence on the economic development of Beibu Gulf Economic Zone; Ji Huadong, Huang Seedjie [13] found the study shows that the equitable distribution of educational resources can better promote economic development; Miao Long, Bingxun Wen and Qianya Wen [1] found taking 31 provincial administrative units in China from 2009 to 2019 as research objects, on the basis of clarifying the mechanism of coupling and coordination between local financial investment in education and the development level of economy, an evaluation index system of local financial investment in education and economic development level was established, the comprehensive index of local financial investment in education and economic development level was measured by using comprehensive evaluation model and entropy weight method, and the coupling coordination degree and spatial self The spatio-temporal characteristics of the coupling coordination degree and its spatial correlation evolution pattern were analyzed by using the coupling coordination degree and spatial autocorrelation model; Zhu Cingchan [14] analyzed the contribution of financial education investment to regional economic growth based on inter-provincial empirical data from 2003 to 2013, and concluded that the contribution of financial education to economic development was higher than that of physical capital investment; Wu Hui [15] explored the relationship between financial investment in higher education and economic growth in China, and showed that financial investment in higher education has a significant contribution to China’s economic development.
Analysis of the Correlation between the Level of Educational Development and the Level of Financial Development: Cole [16- 18] use U.S. Census of Finance information and find, after accounting for the effects of age, income, and other important factors, that increasing educational attainment has a significant growth effect on household financial market participation, for example, there will be a 20% increase in participation from high school to college. Ma Hong [19] found using panel data of 25 Chinese provinces and cities from 1999-2015, we empirically tested the impact of the degree of educational inequality on the relationship between financial development and income distribution, showing that the development of formal finance is conducive to narrowing the gap between residents’ incomes, while the development of informal finance is detrimental to narrowing the gap between residents’ incomes, that the reduction of educational inequality can narrow the gap between residents’ incomes, and that the higher the degree of educational inequality, the financial and informal financial development has a greater negative impact on income distribution; Yang Fan, Zhao Yue and Yue Shengyuan [20] found from the perspective of modern human capital theory investment, based on the dual role of “government-market” in China, financial development and financial education expenditure are included in the same research framework, and provincial panel data from 2003-2018 are selected. empirical analysis, we found that financial development significantly promoted human capital accumulation, and financial education expenditure played a partly mediating role in this process, that is, financial development could promote human capital accumulation by influencing financial education expenditure.
Lihua Zhang, Sheng Hou, and Yiran Wang [21] found by selecting the inter-provincial panel data of 17 resource-based provinces in China. It is shown that both financial development and higher education have a positive contribution to the science and technology innovation capacity of resource-based regions, and at the same time, higher education has an important contribution to the financial development and science and technology innovation capacity of resource-based regions. To sum up, there are a lot of studies on the relationship between education level, financial development and economic growth and between the three at home and abroad, and certain research results have been achieved. The consensus is that there is a certain correlation between education level, financial development and economic growth and between the three. However, relatively speaking, not many scholars in China have studied the above-mentioned series of issues, especially in-depth regional studies, and most of them have focused on the relationship between the two or the three from a qualitative perspective, lacking more detailed and in-depth studies that quantify the influencing factors into specific indicators for examination. Therefore, this paper will study the correlation, causality and coupled coordination among education, finance and economy in China’s regions, taking Hubei Province as an example, and analyze the correlation among education, finance and economy in Hubei Province in the past decade, so as to draw corresponding conclusions and put forward corresponding effective suggestions to provide a scientific theoretical basis for the rational regulation of coordinated development in Hubei Province and the whole country.
Research Content and Framework
The Research in this Paper is Divided into Two Core Parts:
1. Correlation Analysis of Education, Finance and Economy in Hubei Province Since the reform and opening up, China has made excellent achievements and obvious progress in all aspects, and the relationship between regional education, finance and economy has been constantly influencing each other and the conflicts have become increasingly intense, so it is necessary to study the relationship between regional education, finance and economy. This paper first uses Pearson correlation coefficient to study the correlation between education, finance and economy. To further investigate the correlation between the three, Copula entropy is chosen to compare the degree of influence, and on this basis, the causality between the two is investigated to support the conclusion.
2. Analysis of the Coordination of Education, Finance and Economy in Hubei Province In the study of (1), it was found that regional education, finance and economy have a strong correlation. To further confirm that the three are mutually supportive and symbiotic, this paper uses the entropy weighting method to calculate the weights of each subsystem and analyze the development index of each subsystem, followed by the construction of a coupling coordination degree model to analyze the changes of the interactive coupling coordination degree of the two systems, as well as to analyze the trend of the coupling coordination degree of the three systems.
The research framework of this paper is shown in Figure 1 below:
Figure 1

Innovation Points
1. The current method of correlation analysis between education, finance and economy mostly uses Pearson correlation coefficient analysis, which is only applicable to the case of linear bivariate. Therefore, in this paper, we combine Copula entropy to conduct analysis on this basis, not only to compare the depth of influence between the three, but also to study the causality between the two to help draw conclusions.
2. In the regional perspective, we study the representative and exemplary data of Hubei Province, quantify the influencing factors into specific indicators for correlation and coordination analysis between two or three systems of education, finance and economy as a whole, and compare them, so as to explore not only the overall correlation and coordination degree of correlation and coordination among education, finance and economy in Hubei Province, but also the differences and the degree of coordination between three systems and two systems. It is also possible to explore the differences and the strength of the influence between the three systems and the two systems.
The Relationship between Economy and Education
Education and Regional Economy are Interdependent and Mutually Reinforcing: The level of development of productivity is consistent with the level of development of education. Generally speaking, in regions with rapid economic development, education also develops faster, while in regions with slow economic development, education also lags behind relatively. Regional economic development not only provides the material and technical conditions needed for education development, but also puts forward objective requirements for education, i.e., education is required to provide more scientific and technological achievements and human resources to promote regional economic development. It can be seen that there is an interdependent and mutually promoting relationship between regional economic development and education [22].
Education and Regional Economy Influence and Constrain Each Other: Education influences the dynamics of socio-economic development and the degree of sustainability by increasing the level and quality of human capital accumulation. Demand for education is divided into two aspects: social demand and individual demand. However, both social and individual needs are often influenced by multiple factors such as political, economic and cultural factors, among which the most critical influencing factor remains the state of economic development. Economic foundation is the material basis of all human social activities. The level of economic development determines the level and scale of investment in education, and the speed and degree of economic development determines the demand for human capital for social development, which in turn affects the scale, level and structure of human capital cultivated by education. Only when the overall level of socio-economic development is higher, the scale of education will be expanded accordingly, and there will be new demands for the level and professional structure of talents. As can be seen, the two influence and constrain each other [22].
The Relationship between Economy and Finance
Economic Development is the Determining Factor of Finance: Economic development is the key to finance, and finance is secondary, economic growth in the short term is conducive to financial stability, finance cannot be superior to economic development; financial services in economic development, when the financial cycle is relatively smooth helps economic growth, but in the uncertain financial cycle, it can also bring negative effects and negative effects [23]. Economic development has a decisive influence on finance, which is manifested as follows: firstly, finance is born in the commodity economy and continues to develop along with it; secondly, the differences in financial demand at different stages of commodity economy development determine the financial structure, stage of financial development and the level of financial development in China.
Finance as a Driving Force for Economic Development Factors: Finance promotes economic development mainly in the following four aspects [23]. Firstly, financial operation can provide a variety of favorable environment for economic development; secondly, the basic function of finance can provide a variety of financing support for economic development; furthermore, operating financial institutions can effectively promote economic development; finally, the productive value-added of finance itself has a direct role in promoting economic development.
The Relationship between Education and Finance
Simply, financial development can provide the financial needs for economic development, and economic development promotes the development of education. Financial development promotes economic development mainly by improving the efficiency of investment conversion of savings, which is based on an effective financial system and financial market medium. Furthermore, financial development can provide a good market environment for economic development and effectively. guarantee stable economic growth. To sum up, we should correctly handle the relationship between education, finance and economic development, follow the principle of balance and interaction, and consciously make dynamic adjustments to ensure the organic unity of the development of the three.
Descriptive Statistics of the Current Status of Education, Finance and Economic Development
Education Level Development: Education level refers to the extent to which people receive education, and the education level of a country plays a key role in its future development. Since the reform and opening up, China’s education development has made rapid progress, but the problem of imbalance in regional education development has become increasingly serious. Although there is no clear definition of the concept of educational equity in China, scholars from different aspects and regions have made relevant explanations for it, mainly including the following three views: First, equal educational rights and equal educational opportunities. Now China has realized nineyear compulsory education. Therefore, education is a basic right enjoyed by every citizen and cannot be influenced by one’s background of origin, economic strength and social status, and the state also has the responsibility to ensure that every citizen enjoys equal access to education and the right to education. Second is the equal matching of educational resources. The state should ensure that every citizen has equal and fair access to public educational resources. Educational resources should be allocated to match local economic development so that they can be used to maximum advantage and promote better economic and social development. Currently China as a whole is divided into eastern (11 provinces and cities), central (8 provinces and cities) and western (12 provinces and regions), of which, for the time being, Hong Kong, Macao and Taiwan are not considered, as follows: Eastern region: Beijing, Fujian, Guangdong, Hainan, Hebei, Jiangsu, Liaoning, Shanghai, Shandong, Tianjin, Zhejiang; Central region: Anhui, Heilongjiang, Jiangxi, Hubei, Hunan, Henan, Jilin, Shanxi;
Western region: Chongqing, Guizhou, Gansu, Guangxi, Qinghai, Inner Mongolia, Ningxia, Shaanxi, Sichuan, Yunnan, Xinjiang, Tibet. According to the China Statistical Yearbook 2021, the number of general higher education schools and the number of full-time teachers in general higher education in each region are selected as indicators, from which the education development of each province and city in the country in 2020 can be derived, as shown in Figure 2. From Figure2, it can be seen that the highest number of general higher education schools in 2020 is 167 in Jiangsu and the lowest is 7 in Tibet, and the number of general higher education schools in Jiangsu is almost 24 times higher than the number of general higher education schools in Tibet. Meanwhile, the highest number of full-time teachers in general higher education institutions is 133,367 in Henan and the lowest is 2,712 in Tibet, and the number of full-time teachers in Henan is about 49 times higher than the number of full-time teachers in Tibet. From the distribution of the graph, the following information can be obtained: the overall educational development of China’s regions is uneven, showing a ladder-like distribution. In a comprehensive view, the overall number of general higher education schools and full-time teachers of general higher education institutions in the eastern region are 1142 and 812,480, respectively, while 862 and 566,538 in the central region and 734 and 453,964 in the western region, respectively. Therefore, the overall number of general higher education schools and the number of full-time teachers in general higher education institutions are the highest in the eastern region, followed by the central region, and the western region is relatively backward in terms of education level development. That is, the problem of unbalanced development of regional education is still more serious in 2020.
Figure 2

Financial Construction Development: When people mention finance, they first think of money. In fact, finance refers to a series of economic activities including the issuance and circulation of money, the issuance and recovery of loans, the withdrawal of deposits, remittances and exchanges, etc. It is a dynamic process. Therefore, financial development refers to the changes in the volume of financial transactions carried out in a short period of time, as well as the changes in the scale of finance in different periods. A good financial development means the expansion of financial scale, the increase of financial assets and the increase of the number of financial products [23]. According to the China Statistical Yearbook 2021, the number of listed companies and the total assets of insurance companies from 2002 to 2020 were selected as indicators, from which the financial development in the country in recent years can be derived, as shown in Figure 3. From Figure 3, it can be seen that from 2002 to 2020, the number of listed companies and total assets of insurance companies in China are on the rise, and the rate of increase is slowly accelerating. Finance is in a key position in the economy, which is related to economic development and social stability, and has the role of optimizing resource allocation as well as supervising, reflecting and regulating the economy.
Figure 3

Economic Level Development: China’s economic development is mainly reflected in the following three aspects: whether the total economic volume increases, whether the quality of the economy improves, and whether the economic structure is optimized [23] The growth of economic volume is achieved by looking at the quantity of products and services in the country or a region. The growth of economic volume is achieved by observing the quantity of products and services of the whole country or a certain region; economic quality refers to the economic efficiency of the whole country or a certain region. At the same time, economic efficiency also includes human environment, natural environment and sustainable development, etc.; while economic structure refers to the industrial, technological, distribution and consumption structure of the country or a region. Economic structure optimization means that the above-mentioned structures are improved at a higher level. Therefore, when measuring economic development, the indicators of economic development are mainly growth, quality and structure. According to the China Statistical Yearbook 2021, the GDP from 2002 to 2020 and the GDP of each region are selected as indicators, from which the economic development of the country in recent years can be derived, as shown in Figures 4 & 5. In Figure 4, it can be seen that from 2002 to 2020, our GDP is on an upward trend and the rate of increase is slowly accelerating. From Figure 5, it can be seen that the highest regional GDP in 2020 is 110,760.94 billion yuan in Guangdong and the lowest is 190,274 billion yuan in Tibet, and the regional GDP of Guangdong is almost 58 times of the regional GDP of Tibet. From the distribution of the graph, the following information can be obtained: the economic development of China’s regions is also uneven in general, showing a ladder-like distribution. In a comprehensive view, the regional GDP of the eastern region is 550,867.25 billion RMB, that of the central region is 248,255.90 billion RMB, and that of the western region is 213,291.87 billion RMB. Therefore, the eastern region ranks first in terms of GDP, followed by the central region, and the western region lags behind in terms of development. That is, there is also an imbalance in regional economic development in 2020.
Figure 4

Figure 5

Selection of Indicators
In order to further explore the relationship between regional education, finance and economy in Hubei Province, a representative city in China, we follow the principles of comparability, hierarchy, comprehensiveness and representativeness of data, select the indicators that can objectively reflect the development of regional education, finance and economy, and combine them with the actual situation in Hubei Province. The three systems of regional education, financial and economic development were constructed from 12 indicators at three levels: regional education development, financial development level and economic development level. The research unit is Hubei Province, and the research period is 2005-2020, with the level of education development, financial development and economic development of Hubei Province as the research object. All data are obtained from the Hubei Provincial Statistical Yearbook from 2005 to 2020, and the missing data are supplemented by the average growth rate. Specific data are shown in Tables 1-3 in the Appendix Tables 1-3.
Table 1: K-S one-sample test.

Table 2: Correlation test between GDP and the number of students enrolled in general universities.

Note: **. Significant correlation at the 0.01 level (two-tailed).
Table 3: P-values and Pearson correlation coefficients of correlation tests between educational indicators and economic indicators.

Appendix Table 1: Specific data on education indicators in Hubei Province, 2005-2020.

Appendix Table 2: 2005-2020 Hubei Province, the specific data of economic indicators.

Appendix Table 3: Specific data on financial indicators in Hubei Province, 2005-2020.

Pearson Correlation Analysis
Model Introduction and Modeling Steps
Normality Test: For binary normal data, the sample correlation coefficient is the maximum likelihood estimate of the overall correlation coefficient, which is asymptotically unbiased and valid. That is, the correlation between variables can be estimated accurately when the data come from a normal distribution and the sample size is moderate or large enough. In contrast, samples from non-normal distributions may not be valid estimates, although the correlation coefficients still remain asymptotically unbiased. Therefore, in this paper, the normal distribution test is conducted first, and the K-S one-sample test is the most commonly used test for normal distribution, and the results are obtained using IBM SPSS 24 software as shown in Table 1 below. The results show that all the indicators conform to normal distribution except for the number of general college graduates and the number of general higher education institutions.
Correlation Coefficient: Pearson correlation coefficient is a method used to determine whether two sets of data are on a straight line, that is, a method to determine the linear relationship between the variables, generally denoted by the letter r , which can reflect the closeness of the correlation between two variables, and its definition formula is:

where n denotes the sample size, xi denotes the value of GDP for the total level of the economy, yi denotes the value of the variable for higher education, and x and y denote the mean of the variables.
,p>Coefficient Judgment Rules: In general, the value of r ranges from 0 to 1. The closer the value of r is to 1, the stronger the correlation between the two variables x and y . Conversely, the closer the value of r is to 0, the weaker the correlation between the two variables x and y .The Pearson correlation coefficient, which reflects the correlation coefficient between the two indicators of economy and education, is specified as follows: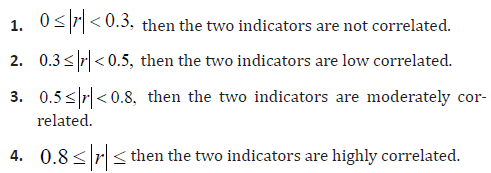
Correlation Analysis of Results: The IBM SPSS 24 software was used to analyze sample data and was able to derive the degree of correlation between various indicators of education, finance and economy.
Correlation between Education and Economy: Higher education is an accurate indicator of education, and the number of students in general colleges and universities is an indicator of the level of higher education in China, and an increase in the number of students in general colleges and universities indicates an increasing enrollment in colleges and universities. The correlation between the number of students in general colleges and universities and GDP can reflect the investment in higher education in a country. Table 2 shows the test results output by SPSS software based on the correlation analysis between GDP and the number of students enrolled in general colleges and universities in Hubei province during 2005-2020, it can be seen that there is a significant correlation between GDP and the number of students enrolled in general colleges and universities, with a p-value of 0.000 significantly less than ∝ for 0.01, which passed the significance test, and the correlation between them is strong and linear, with a value of Pearson correlation coefficient is 0.909, which is greater than 0.8 and is highly correlated. Therefore, for Hubei Province, during the nearly 16 years of development from 2005 to 2020, the investment in education in Hubei Province has increased, which has well driven the economic development of the whole Hubei Province. With the continuous improvement of Hubei’s economy year by year, it in turn drives the development of education.
The economic indicators, including GDP of regional gross product, GDP per capita, consumption level of residents, and investment in fixed assets of the whole society, were tested in the same way with the educational indicators, namely the number of students in general colleges and universities, the number of full-time teachers in colleges and universities, and the number of enrollment in general colleges and universities and the number of graduate students in colleges and universities, and the results are presented in the form of Table 3 as follows. The results show that education indicators and economic indicators are significantly correlated with each other, and the p-value is 0.000 significantly less than ∝ for 0.01, which passes the significance test, and the correlation degree between them is strong and linear. The Pearson correlation coefficient between the number of enrollments in general higher education institutions and the investment in fixed assets of the whole society is 0.794, which is a moderate correlation. In summary, there is a strong linear correlation between the level of economic development and the level of educational development in Hubei Province.
The Degree of Correlation between Economy and Finance: The economic indicators, including GDP of regional GDP, GDP per capita, consumption level of residents, and investment in fixed assets of the whole society, and the financial indicators, including the year-end balance of domestic and foreign currency deposits of financial institutions (including foreign capital) and the year-end balance of domestic and foreign currency loans of financial institutions (including foreign capital), were tested by Pearson correlation coefficient, and the results are presented in the form of Table 4 as follows. The results show that education indicators and financial indicators are significantly correlated with each other, and the p-value is 0.000 significantly less than ∝ 0.01, which passed the significance test, and the correlation between them is strong and linear, and the values of their Pearson correlation coefficients are all greater than 0.8, which are highly correlated. In summary, there is a strong linear correlation between the level of economic development and the level of financial development in Hubei Province.
Table 4: P-values and Pearson correlation coefficients of the correlation test between financial and economic indicators.

Relevance of Education to Finance: The education indicators are the number of students in general colleges and universities, the number of full-time teachers in colleges and universities, the number of enrollment in general colleges and universities and the number of graduate students in colleges and universities, and the financial indicators including the year-end balance of deposits in domestic and foreign currencies of financial institutions (including foreign capital) and the year-end balance of loans in domestic and foreign currencies of financial institutions (including foreign capital) were tested by Pearson correlation coefficient, and the results are presented in the form of Table 5 as follows. The results show that education indicators and financial indicators are significantly correlated with each other, and the p- value is 0.000 significantly less than ∝ 0.01, which passed the significance test, and the correlation between them is strong and linear, and the values of their Pearson correlation coefficients are all greater than 0.8, which are highly correlated. In summary, there is a strong linear correlation between the level of educational development and the level of financial development in Hubei Province. The Pearson correlation coefficient is an important correlation measure concept in the history of statistics and is widely used, but it has many limitations because it is a concept introduced early in statistics.
Table 5: P-values and Pearson correlation coefficients of correlation tests between educational and financial indicators.

First, theoretically, it is only applicable to the linear case, implicitly assuming a Gaussian distribution, which makes it inapplicable in most practical situations. Secondly, it is a bivariate metric concept, and there is no multivariate version of it. Finally, because the two metrics, the number of general college graduates and the number of general higher education institutions, do not pass the normality test, no Pearson correlation coefficient test is conducted in this section for these two metrics. In summary, this paper will continue to use Copula entropy [24-26] (Copula Entropy, hereinafter referred to as CE) to supplement as well as to conduct causality analysis.
Copula Entropy Correlation and Causality Analysis CE is a more advanced correlation measure that has significant advantages over the Pearson correlation coefficient. First, it has no assumptions of linearity and Gaussianity and is a multivariate correlation measure. Secondly, CE also has monotonic transformation invariance. Finally, in the case of Gaussian distribution, it is equivalent to the correlation coefficient. The following are the advantages of CE:
1. No model assumptions.
2. Can handle non-linear relationships.
3. Statistical independence measures.
4. Monotonic transformation invariance.
5. CE is equivalent to the correlation coefficient in the Gaussian
case.
Model Introduction: Given the joint distribution function F(X ) , the marginal distribution function Fi (Xi) and the Copula function c(μ ) for any N-dimensional random variable X , the joint distribution function can be expressed as
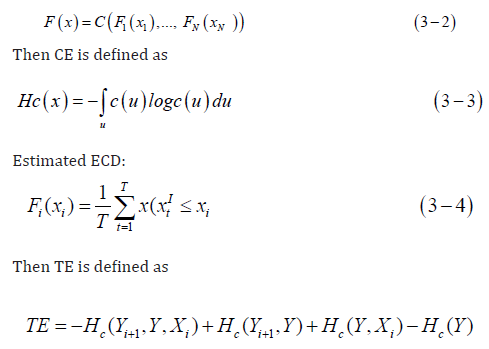
whereu denotes the marginal distribution function of Xui = Fi(xi),i =1 ,..., N, X is the cause and Y is the effect.
Correlation Analysis of Results: After completing the work of model building, the sample data were analyzed using R software and were able to derive the degree of correlation between various indicators of education, finance and economy. Unlike the Pearson correlation coefficient, which measures the degree of correlation and is a relative quantity, and therefore has a fixed range of values, the CE measures the amount of information of correlation and is an absolute quantity without a clear upper limit, so there is no uniform numerical standard to decide whether it is correlated or not, and the standard threshold of correlation has to be decided according to the specific situation. Figure 6 and Table 6 are the summary of the results output by R based on the correlation analysis of education, finance and economy in Hubei Province from 2005 to 2020, it can be seen that for Hubei Province, the correlation between finance and economy is the highest, education and economy is the second, and education and finance is currently the most backward correlation during the development process of the last 16 years from 2005 to 2020. And the correlation between education, finance and economy is inferior to the correlation between finance and economy both, and superior to the correlation between education and economy both and education and finance both.
Table 6: CE of both or all three: Economics, Finance and Education.

Figure 6

Causality Analysis of Results: As the most common variable, this paper selects the indicator of gross regional product (GDP) to characterize the total development level aspect of the regional economy. Firstly, GDP has been favored by many scholars as a necessary reference indicator for economic analysis. Second, GDP can well reflect the economic development of a region, so this paper uses the core variable of GDP to represent the total level of regional economy. The selection of indicators is then based on the comparison of the relationship with the strength of correlation with the variable GDP, and the two indicators with higher correlation are selected for the causality analysis. Table 7 is the summary of the results output by R based on the correlation analysis of GDP with education and finance related indicators in Hubei province from 2005 to 2020, it can be seen that for Hubei province, in the development process of the last 16 years from 2005 to 2020, two indicators of GDP and finance have the same correlation, and among the six indicators of education have the highest correlation with the number of graduate students in higher education, so education For the indicators of education, finance and economy, we choose: the number of graduate students in higher education and the number of general higher education institutions, the year-end balance of domestic and foreign currency deposits of financial institutions (including foreign capital) and the year-end balance of domestic and foreign currency loans of financial institutions (including foreign capital), GDP and regional GDP per capita, respectively.
Table 7: CE of GDP and financial indicators and education indicators.

Figures 7-9 are a summary of the results output by R based on the causality analysis of economic and education and finance-related indicators in Hubei Province from 2005 to 2020. As can be seen from Figure 7, for Hubei Province, the causality of the two influences of education on the economy over the nearly 16 years of development from 2005-2020, outcome 1 is relatively flat in the first 10 hours of time lag, while outcome 2 is up and down, but both factors reach a trough in the 11-hour time lag, and in general, the trends are not similar As can be seen in Figure 8, for Hubei Province, the causality results of both influences of the economy on finance rise slowly with a 12-hour time lag over the nearly 16 years of development from 2005-2020, and in general, the trends are very similar and nearly identical. As can be seen in Figure 9, for Hubei Province, the causality of two influences of education on finance over the nearly 16 years of development from 2005-2020, outcome one rises slowly over a 12- hour time lag, while outcome two goes up and down, but both factors peak over a 12-hour time lag, and in general, the trends are not similar. In summary, the causality between education and economy and education and finance may not be immediately apparent, but rather a cumulative process, and they have a relatively greater impact 10 hours later, while some causality may exist for finance and economy.
Figure 7

Figure 8

Figure 9

Summary of this Section
In summary, whether from the results of Pearson correlation coefficient or Copula Entropy, there is a strong correlation between the level of economic development and the level of education development, between the level of economic development and the level of financial development, and between the level of education development and the level of financial development in Hubei Province. The correlation between finance and economy is the highest, education and economy is the second, and education and finance is the most backward. And the correlation between education, finance and economy is inferior to the correlation between finance and economy both, and superior to the correlation between education and economy both and education and finance both. This also indicates that the coordinated development of the three systems is more worthy of attention than the two systems. If the government increases the investment in education, it can well drive the economic and financial development of the whole Hubei province; if it increases the investment in economy, it can well drive the education and financial development of the whole Hubei province; if it increases the investment in finance, it can well drive the economic and educational development of the whole Hubei province. Therefore, in the future development, at the time of rapid economic and financial development, the government should pay more attention to the current slow development of education level, invest more on education, strengthen the system management, make the development of education more efficient and comprehensive, and finally promote the complementary and coordinated development between education, finance and economy.
In the previous study, it was found that regional education, finance and economy have a strong correlation. In order to further confirm that the three are mutually supportive and symbiotic, it is necessary to pay attention to the coordinated development of the three. When the development among regional education, finance and economy is coordinated, enhancing education can promote the good operation of finance and economy, growing finance can promote the good operation of education and economy, and enhancing economy can promote the good operation of education and finance; when the coordination among regional education, finance and economy is unbalanced, the three may have lagging development or even influence each other.
Index System Construction and Research Method
Data Selection: According to the availability and comparability of statistical data, the same indicators and data as in Chapter 3 are selected to initially construct the dynamic imbalance between education, finance and economic development, taking into account the real situation in Hubei Province.
Standardization of Index Values: It is necessary to determine the positive and negative nature of the indicators before standardizing the indicator values. Among them, positive indicators refer to indicators that develop forward and grow upward to bring positive benefits or good effects to the subject’s results; while negative indicators (also called negative indicators and reverse indicators) refer to indicators that develop forward and grow upward to bring negative benefits or worse effects to the subject’s results. The larger the positive indicator, the better, and the smaller the inverse indicator, the better. Commonly used de-rating methods are standardization method, extreme value processing method and efficacy coefficient method, this paper uses the extreme value processing method [27,28]. In this paper, we use the extreme value method.
The formula for calculating the positive indicator is as follows:
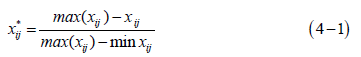
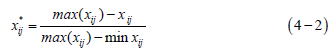
where, x*ij is the standardized value of the jth indicator in year i , i = 2005,...2020, j =1 ,...,12, and xij are the actual values of the jth indicator in year i . The final calculation results may have zero values, and in order to make the logarithm meaningful when calculating the weights, the data need to be non-zeroed, and the specific standardized data are shown in Tables 8-10 in the following Appendix Table 4.
Table 8: Hubei Education, Finance and Economy Coupling Coordination Index System.

Table 9: Classification criteria of coupling coordination.

Table 10: Development index of coupling coordination between education, finance and economy in Hubei Province.

Appendix Table 4: Coupling degree of education, finance and economy in Hubei Province.
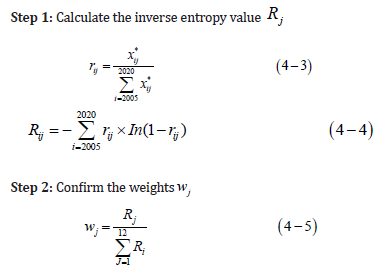
Confirmation of Indicator Weights: There are many methods to calculate the weights, including quantitative statistics, hierarchical analysis, pairwise comparison and principal component analysis, etc. In this paper, we mainly use the inverse entropy method, which is rarely used in the objective weighting method, to assign weights to indicators. First, the inverse entropy method can circumvent the extreme situation of indicator failure. Second, the inverse entropy method can reflect the differences between indicators. Finally, the inverse entropy method can reduce the subjective errors caused by human assignment in the case of limited sample size.
The system of quality indicators for the coupled development of the three systems of education, finance and economic growth is shown in Table 8 below.
Calculation of Development Index: The subsystems of education level, financial development, and economic growth are denoted by J, F, and E, respectively, and the development indices of each subsystem UJ, UF, and UE Are calculated as follows [29]:
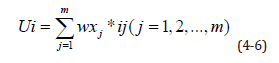
By weighting and summing the indicators of each subsystem, the coupled development index of education, finance and economy is derived.
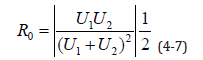
Coupling Coordination Evaluation Analysis: Coupling refers to the phenomenon that two or more systems are affected by various interactions and is a reflection of the dynamic connection between the systems. If multiple subsystems are positively coupled, the original properties of the subsystems will change, making them higher-level systems. The degree of coupling describes the possibility of a system becoming a higher-level system and the degree of influence of interactions [30,31]. The coupling degree model of the two systems is as follows:
The three-system coupling degree model is as follows:
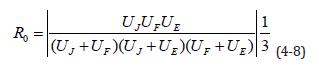
Among them, 1 U and 2 U represent the development index of each subsystem respectively, and 0 R represents the coupling degree, which belongs to [0,1]. The specific data of the coupling degree of the three systems of education, finance and economic growth are shown in Table 11 in the following >Appendix Text. However, the coupling degree generally refers to the degree of interaction between systems, which means that the coupling degree does not reflect the level of synergistic assessment among systems well. Therefore, a coupling coordination degree model is invoked on this basis to measure the level of synergistic assessment of multiple systems to reflect the orderly development and good coupling synergy of the systems. The model organically combines the coupling status of each subsystem R0 and the evaluation level T0 to make the collaboration of each system more adequate and to assess the coordination level of each subsystem [29].
Table 11: Education level-financial development, education level-economic growth and financial development-economic growth coupling coordination.

The calculation formula is:
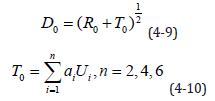
In the above two equations, D0 is the coupling coordination degree; T0 is the integrated development index among several subsystems in the region; i a is the coefficient of subsystem to be determined. Also, since these three subsystems have the same importance in the study of system interaction, the weights are taken as the average of the total weights1. Based on this, the two-system coupling degree model is used to calculate and analyze the coupling development of education level-financial development (JF system), education level- economic growth (JE system) and financial development- economic growth (FE system), and the coupling relationship of education level- financial development- economic growth (JFE system) is explored using the theory of three-system coupling degree model. This paper refers to Jin Universe and Chen Bingpu [32]’s classification for the detailed classification of coupling coordination degree, and the settings are shown in Table 9.
σ Convergence Test: Theσ convergence test allows measuring the discrete degree of development of coupling coordination between JF, JE and FE systems. The observation of the t σ function can explain
to some extent the development gap in the future coupling coordination of the JF, JE and FE systems and analyze their development advantages and structural adaptability. Compared with the absolute value of the standard deviation, the coefficient of variation in this method is more effective in preventing the influence of the deviation on the convergence, and therefore the coefficient of variation is used as the convergence indicator of σ . The convergence test function σt
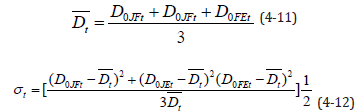
With σt representing the coefficient of variation of the 3 coupling coordination degrees among the interacting systems at the time t, if the σt index gradually decreases, it means that the coordination coupling degrees of the 3 interacting systems will converge, while on the contrary, their coordination coupling degrees will show divergence. The judgment rule is as follows:
1. If σt+1 < σt then convergence exists. 2. If σt+T < σt then convergence exists. , then it is considered to have T-stage convergence between these 3 coupling coordinators. 3. If σt+T < σt is available for any T > 0 , the convergence of σ is considered consistent for these 3 coupling coordinators.
GM (1,1) Gray Forecast Analysis: Predicting the development trend can control the law of change, make prevention in advance, and provide a reliable basis for the corresponding decision, so it is of some significance to predict the coordination development trend. Gray prediction [33,34] By determining the change pattern between different sequences, the uncertainty of the sequence is transformed into a strong regular sequence to predict the future development trend of the sequence. The gray prediction model can effectively predict time series with low data volume and low data integrity and reliability. The method uses differential equations to extract the nature of the data, which has the advantages of small amount of information, high accuracy, simple operation, easy testing, and does not consider the distribution pattern or change trend. There are many kinds of gray prediction models, among which GM (1,1) is the most commonly used model. The first number represents a first-order differential, while the second number represents a data series.
Step 1: GM (1,1) differential equation dynamics model
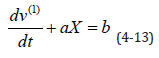
where a and b are coefficients to be determined, a is the developmental gray number and b is the endogenous control gray number.
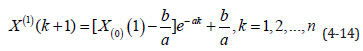
Step 2: Solve the parameter a by the least squares method to obtain the time response function of the gray prediction.
The GM (1,1) model generally considers two values of p and C when testing the accuracy of the prediction model. The posterior test difference ratio C value is used for model accuracy assessment, and the smaller its value, the better. The test rules are as follows:
1. C ≤ 0.35, then the model accuracy level is good.
2. 0.35 < C ≤ 0.5, if the model accuracy passes.
3. 0.5 < C ≤ 0.65, The model accuracy is basically up to standard.
4. C > 0.65 The model accuracy level is not up to the requirement.
The small error probability p-value test rule is as follows:
1. p ≤ 0.7 If the model fails, the model fails.
2. 0.7 < p ≤ 0.8 The model barely passes.
3. 0.8 < p ≤ 0.95 If the model passes, the model is qualified.
4. p > 0.95The accuracy of the model is good.
Analysis of Single System Development Index Results
The coupled development indices of education, finance and economy systems are shown in Table 10 below as well as the trend chart in Figure 10 below. As shown in the figure and table above, the development of the JFE system can be divided into 2 phases:
1. Low-level financial development lag phase (2005-2015). In this phase, the development indexes of the financial subsystem are basically in line with those of the economic subsystem. the development indexes of all 3 systems are in a more stable but slow development process. The development indexes of the education system are significantly higher than those of the other two systems, indicating that the advantage of education level is greater than that of economic growth and financial development at this stage. The development indexes of the education level system, the economic growth system, and the financial development system are ranked from highest to lowest.
2. High education level lagging stage (2016-2020). After 2016, the financial and economic development indexes continue to rise, while the change in the education level index is stable, and the financial and economic development indexes gradually overtake the education level index. The economic growth system, financial development system, and education level system development index rank from high to low. The main feature of this period is that the rapid development of economic and financial systems in Hubei Province has far surpassed the index of education development and entered the stage of high-level education level lagging. In summary, during the development of the JFE system, the economy of Hubei Province first entered a rapid development phase. During 2005-2015, the financial development temporarily lags behind. During 2019-2020, the economic development system has entered the middle and high level, and the development of the economic system will promote the GDP growth of the financial system and the continuous improvement of the financial system, and even catch up with the economic system. During the period of 2011-2020, while the financial and economic systems are developing at a high speed, the education system in Hubei Province has entered a slow growth stage and the JFE system has entered a lagging stage in education level. This means that one of the keys to solve the coordinated development of the three systems in Hubei Province at this stage is to solve the problem of lagging education level.
Figure 10

Analysis of the Results of the Coordination Degree of Interactive Coupling of the Two Systems
Coupling Coordination Degree Results Analysis: The coupling coordination degree between these two systems is obtained by solving the relational equation of the coupling degree of the two systems from formula (4-7), as shown in Table 11 and Figure 11. the changes of the coupling coordination degree between the JF and JE systems are similar. both the JF and JE systems go through three stages of recovery from intermediate coordination development to primary coordination development and then rise to intermediate coordination development. Overall, the coupling coordination degree is gradually optimized. Compared with the JF and JE systems, the coupling coordination degree of the FE system developed rapidly. Compared with 0.058 for the JF system and 0.062 for the FE system, the coupling coordination degree of the JE system only increased by 0.056 throughout the study interval, which is relatively low. In the temporal dimension, the three systems interacting coupling coordination is in the leading position in 2005-2011, 2012-2015, and 2016-2020 for the FE system, JE system, and FE system, respectively, i.e., although the coupling coordination of the FE system has ups and downs in the middle, its growth rate of obtaining the best coupling coordination is higher compared to the other 2 interacting systems higher. From the trend dimension, the coupling coordination of the FE system is the first to enter the stage of high-quality coordination development. From the development dimension, although the interactive coupling coordination among the three systems has entered the range of coordination evaluation, its coupling coordination degree not only fluctuates in the middle, but also develops slowly and has a medium coupling degree. Among them, the JE system coupling coordination degree is relatively low. Promoting the long-term coordinated development of education-economy is one of the main problems of coordinated development in Hubei Province.
Figure 11

σ Convergence Test Analysis of Results: σt The trend with time t is shown in Figure 12. From 2005 to 2006, the coupling coordination of the interactive systems of JF, JE and FE in Hubei province showed a divergence, indicating that the difference in the coupling of the interactions of the three systems increased in this stage and the development structure of the three systems tended to be unreasonable between the two. After 2006, the coupling trend gradually converged, indicating that after 2006, the coupling difference of the 3 systems decreased significantly, and the development structure of the 3 systems tended to be reasonable, synchronous and coordinated.
Figure 12

Analysis of the Results of the Coupling Coordination Degree of Education-Finance-Economy Triple System
Coupling Coordination Degree Results Analysis: The coupling development of Hubei JFE system from 2005 to 2020 is shown in Table 12. The minimum value of coupling coordination degree of Hubei JFE system is 0.646 and the maximum value is 0.764, which is always in the coordination development area from 2005 to 2020. However, among them, the coupling coordination degree is less than 0.7 from 2006 to 2009, which is the primary coordinated development, and the coupling coordination degree is greater than 0.7 again after 2010, which enters the intermediate coordinated development stage. 2005- 2020 coupling degree of Hubei JFE system is between 0.4 and 0.5, and the average relative level is 0.483, which is in the fly-down stage. The coupling coordination degree increases with the increase of coupling degree, and the average relative level is 0.722, and the overall is in the intermediate coordination development stage, which indicates that the overall level of coupling coordination degree of Hubei JFE system is relatively low and the coordination development role is relatively weak. It should start from the whole situation of the three systems to further improve the level of coordinated development of the three systems in Hubei Province.
Table 12: Education level-financial development-economic growth coupling coordination.

Analysis of GM (1,1) Gray Prediction Results: With the online software SPSSAU, a gray GM (1,1) prediction model was used to forecast the coupling coordination of the JFE system in Hubei Province during 2021-2024. The first step is the level ratio test to determine whether the data series has a suitable regularity and is suitable for the model. The results are shown in Tables 13 below, and the values of the cascade test are within [0.889, 1.125], indicating that this data series is suitable for the GM (1,1) model. Table 13 Model-level ratios of GM (1,1) in Hubei In the GM (1,1) model, the development coefficient a, the amount of gray effect b, and the posterior difference ratio C value and the small error probability p value should be found respectively, and the p value and C value are usually considered in the accuracy test of the prediction model. The results of the model construction are shown in Table 14 below, with a small error probability p-value of 0.938<0.95, implying that the accuracy of the model is up to standard. The posterior test difference ratio C value of 0.0991<0.35 implies that the model has a high accuracy level. The prediction results of GM (1,1) model are shown in Table 15 below, the coupling coordination of Hubei JFE system in 2021-2024 basically continues the development trend of 2005-2020, and it is still in the intermediate level of coordinated development in 3 years from 2021-2023 and will basically achieve good coordination in 2024.
Table 13: Model-level ratios of GM (1,1) in Hubei Province.

Table 14: Results of GM (1,1) model construction in Hubei Province.

Table 15: Prediction results of GM (1,1) model in Hubei Province.

Summary of Chapter
The changes in the coupling level of the three-system JFE system are closely related to the coupling degree of the two-system JF, JE, and FE. after 2006, the two-system JF, JE, and FE have risen more steadily, by which the three-system JFE coupling level rose from primary to intermediate coordination development. However, there was a significant decrease in the two-system JF, JE, and FE coupling levels in 2006, causing a significant decrease in the three-system JFE coupling coordination. In addition, the three-system JFE coupling level slowly increased from 2005 to 2020, which maintained a basically consistent change trend with the two-system JF and JE coupling. According to the prediction results of GM (1,1) model, the overall coupling degree and evolution rate are relatively low, and it will take a long time to evolve into a high-quality and high-level coordinated development stage that guarantees coordinated development. Overall, the coupling level of the three systems will gradually rise in the future but the evolution speed will not be too fast, and the positive feedback mechanism of the three will gradually and slowly take shape, and thus form a virtuous cycle of mutual promotion.
Research Findings
This paper conducts an empirical study on the relationship between the coordinated development of education, economy and finance in Hubei Province in order to analyze the integrated change relationship among education, finance and economy and to explore the dynamic characteristics of the evolution of the three subsystems. The results of the study found that:
1. There is a strong correlation between economic development and educational development, between economic development and financial development, and between educational development and financial development in Hubei Province.
2. The education-finance-economy correlation is inferior to the finance-economy correlation and superior to the education- economy and education-finance correlation.
3. In terms of the single system, although there are problems such as insufficient development benefits and unreasonable development structure among all three systems, the economic and financial subsystems are better developed than the education subsystem. This means that solving the lagging problem of education level at this stage is one of the keys to solve the coordinated development of the 3 single systems in Hubei Province.
4. In terms of the two systems, education-finance, education-economy and finance- economy have been in a coordinated development stage, but there are still some gaps in the development level, and the education-economy system is temporarily lagging behind. Convergence analysis shows that there is an obvious trend of convergence in the degree of interactive coupling coordination of the two systems in Hubei Province after 2006, indicating that the gap has been gradually reduced in recent years and the development structure of the three systems has been gradually optimized to achieve rationalization and coordination. That is, at present, improving the coordinated development of education-economy in a more sustainable and long-term way is one of the keys to solve the coordinated development of the three two systems in Hubei Province.
5. In terms of the three systems, the education-finance-economy coupling degree is between 0.4 and 0.5, which is at the stage of mutual confrontation with the jerky down. The coupling coordination degree is once again greater than 0.7 after 2010, entering the intermediate coordination development stage, but the coordination level rises slowly. The forecast results of coupling coordination degree show that the coupling coordination degree of the three systems will rise slowly in the next four years and will initially reach a good stage of coordinated development by 2024. In summary, the correlation of the three systems is relatively better than the two systems, i.e., it is not enough to focus on the construction of the two systems, and promoting the overall construction of the education-finance-economy system is the ultimate goal. The current problem that needs to be solved in Hubei Province is the current situation of lagging education level. Improving the quality of education, and thus promoting the long-term coordinated development of education-economy, will finally achieve the effect that the development structure of the three systems will be optimized and gradually rationalized towards harmonization.
Research Recommendations
Based on the above findings, the following recommendations are made to further promote the coordinated development of regional education, finance and economy in China:
1. Promote the sound development of the three systems from the internal governance of the two systems.
The degree of coupling and coordination of the three systems is closely related to the degree of development of interactive coupling and coordination of the two systems. Therefore, in the future, China should start from the internal governance of each two systems and increase the coordination efforts from three aspects of education input, financial construction and economic transformation to promote the coordinated development of each two systems, so as to provide a solid guarantee for the benign development of the three systems.
2. Increase investment in education and focus on the quality of education and teaching If there is insufficient investment in education, it will constrain the development of the education sector to some extent. Therefore, compulsory education should be the focus of investment in education, standardize education standards, raise awareness of reading for all, and increase support for investment in education.
3. Accelerate the optimization and upgrading of education and economic structures Over-emphasis on investment in education does not fully promote economic development, but active and effective investment in human capital is a key factor in promoting China’s economic development. Therefore, it is necessary to increase investment in education, especially higher education, and accelerate the optimization and upgrading of the educational structure and economic structure, which is a necessary prerequisite for the sustainable development of our economy. At the same time, integrated planning of financial construction and continuous improvement of the overall quality of the workforce is an important way to promote sustainable economic development.
4. Increased financial regulation to improve investor participation in financial markets Volatility in financial markets can have some impact on economic growth, and the direction of the impact will change with changes in the economic environment. Therefore, banks should pay more attention to the volatility of financial markets when formulating and implementing monetary policy, especially in the case of significant changes in the economic environment [1]. The development of the economy should be accompanied by integrated planning of both education input and financial construction, and the comprehensive use of administrative, legal and economic means to promote the development of the three in the direction of optimal coordination.
We have no conflict of interests to disclose, and the manuscript has been read and approved by all named authors.
This work was supported by the Philosophical and Social Sciences Research Project of Hubei Education Department (19Y049), and the Staring Research Foundation for the Ph.D. of Hubei University of Technology (BSQD2019054), Hubei Province, China.


