info@biomedres.us
+1 (502) 904-2126
One Westbrook Corporate Center, Suite 300, Westchester, IL 60154, USA
Site Map
Received: October 12, 2023; Published: October 20, 2023
*Corresponding author: Krzysztof L Hyrc, Washington University School of Medicine,Department of Neurology (Campus Box 8111)660 S. Euclid Ave, Saint Louis, USA
DOI: 10.26717/BJSTR.2023.53.008398
Intracellular free calcium concentrations ([Ca2+]i) are commonly measured with fluorescent indicators. As Ca2+ chelators, they compete with endogenous buffers for Ca2+ ions, which may reduce [Ca2+]i. Indicator concentrations that are unlikely to markedly affect Ca2+ signals were defined long time ago, but they are usually too low to allow accurate fluorescence measurements. In consequence, most routine [Ca2+] i measurements utilize much higher indicator concentrations and may underestimate [Ca2+]i. Here, we propose a method to derive correct, indicator-independent) [Ca2+]i by extrapolating the reported [Ca2+]i to the indicator-free environment. Although similar to its predecessors, the proposed steady-state model avoids complexities of earlier approaches and requires only data collected in AM ester loaded cells. As such, it can be applied to determine the indicator-independent peak [Ca2+]i induced by any stimulus in any cell type. First, we tested the approach in well-defined in vitro systems and found that it determined the indicator-independent Ca2+ quite well and estimated albeit less accurately concentration and affinity of an endogenous buffer. When applied to the data collected in fura-2 loaded neurons depolarized with 50 mM K+, the method estimated the true Ca2+ in resting (22 nM) and stimulated (1.18 μM) neurons and characterized the endogenous buffer (~600 μM) as having low affinity (0.78≤ Kb ≤1.63 μM), values resembling those determined previously. While the method does not account for indicator-distorted Ca2+decay rates (a consequence of omitting the time component), it creates a simple way to assess peak Ca2+ amplitudes, the values most often desired in routine Ca2+imaging experiments.
Keywords: Intracellular Calcium; Fluorescent Indicators; Neurons; Fura-2; Endogenous Buffers; Mathematical Modelling
Abbreviations: Cat: Total Calcium Concentration; cafo and caffree: Free Calcium Concentration in the Absence (native) and Presence of an Exogenous Buffer (an Indicator); Ion, Buf and Dye: Total Concentration of Ions, Endogenous Buffer and Exogenous Buffer (Indicator); Iono, and Bufo– Native Ion and Intrinsic Buffer Concentrations in the Absence of an Indicator; Ionfree, and Buffree: Free Ion and Intrinsic Buffer Concentrations in the Presence of an Indicator; BufCa, an DyeCa: Concentrations of Calcium-Bound Duffer and Indicator; Kd and Kb - Indicator and Buffer Dissociation Constants; κS and κd -Cytoplasm and Indicator Calcium Binding Ratio Defined Precisely in Text and Previous Publications
The determination of cytosolic free calcium concentration ([Ca2+]i) an important secondary messenger [1-4], is typically accomplished with the use of fluorescent indicators [5-8]. Varying widely with respect to their spectral and binding properties [9-12], indicators share common design and operation principles. A typical indicator molecule comprises a calcium binding moiety, usually BAPTA [13] or a derivative [9], linked to a fluorophore, such as stilbene [14], fluorescein or rhodamine [15]. While the former determines indicator affinity and selectivity, the latter defines its spectral properties. The binding of Ca2+ ions by BAPTA changes electron distribution within the molecule, which in turn leads to a fluorescence change, which may involve a shift in excitation or emission wavelength [14,16]. In every case, the indicator must first bind Ca2+ and therefore inevitably acts as a calcium buffer (for recent reviews see [17,18]). The number of sequestered ions depends on indicator affinity and concentration. For the sake of simplicity, only the former is considered by the standard equation commonly used to convert indicator signal into [Ca2+]i [14]. Omitting the indicator concentration may be inconsequential in calibration solutions containing large amounts of calcium and EGTA (1-10 mM) whose proportion sets the free [Ca2+] (0-40 µM) [19,20], a balance practically unchanged by adding indicator at low concentrations (≤5 µM) in in vitro measurements.
The situation in in situ experiments however might be quite different. Not only is the buffering capacity of the cytosol much lower than in millimolar EGTA [21-26], but the cytosolic indicator concentrations tend to be much higher (30-150 µM [27-33]) than those used in vitro. While such high concentrations might be required to ensure high signal to noise ratio [34,35], the indicator may bind a substantial fraction of Ca2+ ions and lower their free concentration, in consequence, reporting a lower [Ca2+]i that is affected by indicator concentration and affinity [36-40].This problem was recognized in early studies demonstrating that higher indicator concentrations produced lower [Ca2+]i estimates [41-44]. Similarly, low affinity indicators were often found to report higher [Ca2+] values than their high affinity analogues. For example, fura-2 (Kd ~0.22 µM [14]) was shown to report higher Ca2+ transients [45-47] than quin-2 (Kd=0.115 µM [27]). Ito and coworkers observed marked differences in [Ca2+]i measured using fura-2 and BTC[48] (Kd ~12 µM [49]) in pancreatic acinar cells [50]. Similarly, BTC and mag-fura-2 [51] (Kd~20 µM [52]) reported higher [Ca2+]i than fura-2 in neurons exposed to NMDA [49,53-56] or a stimulus train [57,58] .
While alternative explanations are conceivable [59-62], substantial Ca2+ buffering by high affinity indicators has been suggested as the main reason [53,56,63]. While indicator-ion binding may be regarded as a “necessary evil” in most calcium imaging experiments, several studies have shown how indicator related distortions could be used to gain insights into the nature of endogenous buffers and free calcium traces [38,64-66]. For various reasons, however, application of these methods to the majority of routine calcium imaging experiments has not been a practical proposition. Consequently, results of these studies may be affected by the presence of an indicator. To address this problem, we have developed and tested a simple, steady-state modelbased method to account for indicator effects on the amplitude of calcium signals.
In Vitro Experiments
In vitro experiments were performed in solutions containing 100 mM KCl, 10 mM MOPS, 1 mM Mg2+ in which desired concentrations of Ca2+ were obtained by cross-diluting 10 mM EGTA and 10 mM CaEGTA standard solutions (Invitrogen Carlsbad, CA) or self-prepared and tested as described previously [67], using a protocol provided by Invitrogen. The concentration of free Ca2+ ions was independently verified using a calcium-selective electrode (Model 97–20, Orion Research Inc., Beverly, MA). After adding fura-2, the measurement was repeated with the ion selective electrode and fura-2 microfluorometry in 20 μm thick glass capillaries (VitroCom, Mountain Lakes, NJ) using an imaging system described below.
Cultures Of Primary Hippocampal Neurons
Cell cultures were prepared as described previously [68]. Briefly, hippocampi removed from 0–3 postnatal day Sprague Dawley rat pups were treated with papain (1 mg/ml) and mechanically triturated. Cells were then plated in type I collagen coated (0.5 mg/ml) 35 mm glass-bottom dishes (Cell E&G, San Diego, CA) ~650 cells/mm2 and cultured in Eagle’s medium supplemented with serum, D-glucose, glutamine, and antibiotics at 37°C in a humidified incubator. Cytosine arabinoside (6.7 μM) was added 3–4 days after plating to inhibit cell division. Cells were imaged 14–16 days after plating.
Imaging Experiments
All imaging experiments were carried out at room temperature in a HEPES-buffered salt solution (HCSS) containing, in mM: 141 NaCl, 5.4 KCl, 1 NaH2PO4, 1.8 CaCI2, 1 MgSO4, 12 HEPES, and 5.5 D- glucose, pH of which was adjusted to 7.35±0.05 with 0.1 M NaOH. Cells were loaded with fura-2 (Teflabs, Austin, TX) at room temperature by incubation with 10 μM AM ester in the presence of 0.1% Pluronic F-127 (Invitrogen), washed and incubated for another 30–60 min to allow for ester processing. After loading, cells were imaged on an inverted microscope (Nikon Eclipse TE300; Nikon, Melville, NY) equipped with a cooled CCD camera (Cooke, Auburn Hill, MI) using a 20x/0.75 S Fluor objective (Nikon). The fluorescence excitation (75 W xenon arc lamp) was delivered via band-specific filters (340 and 380 nm; Semrock, Rochester, NY) in combination with a XF73 dichroic beam splitter (Omega Optical, Brattleboro, VA). Pairs of images were collected at 5 sec intervals at alternate excitation wavelengths. After subtracting the matching background, image intensities were divided by one another to yield ratio values (R) for individual cells. [Ca2+]i in individual cells was calculated using formula [14]:
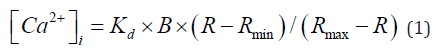
where Kd is the indicator dissociation constant for Ca2+ (0.22 μM) [14]; R is the ratio of fluorescence intensity excited at 340 and 380 nm; Rmax and Rmin are the ratios of Ca2+ -bound and Ca2+ -free fura- 2, respectively, and B is the ratio of the fluorescence intensity of the second excitation wavelength at zero and saturating Ca2+ concentrations [14]. The calibration constants (Rmin, Rmax, and B) were determined at the end of each experiment by exposing the cells first to 10 μM 4-Br-A23187 (Teflabs) and then to 10 mM EGTA. Cells that failed to respond to stimulation or provide calibration data were excluded from further calculations.The desired intracellular fura-2 concentrations were achieved by varying the time of indicator loading (15-180 min) and assessed by comparing cell fluorescence intensity excited at 360 nm to that of a 20 μm thick microslide filled with 0.1 μM free Ca2+ calibration buffer [67]. Image acquisition was controlled by Metafluor (Molecular Devices (San Jose, CA) and data processing was performed using a scientific graphing program SigmaPlot (Systat, Chicago, IL).
Modelling and Data Processing.
All simulations and numeric solutions to equations mentioned in text were created using Mathematica (Wolfram Research, Urbana- Champagne, IL). The calculated parameters were generated using Monte Carlo methods [69] Briefly, after adding first a random scatter to the data, the procedure was repeated 1000 times to determine the parameters. We determined median and median deviation for each parameter after rejecting values outside 2.5 and 97.5 percentile. The graphing software (SigmaPlot, Systat, Chicago, IL) was used for all basic data analysis and graph preparation.
Indicators and chemicals
Acetoxymethyl (AM) esters and K+ salts of fura-2 and 4-Br- A23187 were kind gifts from Dr. A. Minta (Teflabs, Austin, TX, USA). Ca2+ calibration kits were bought from Invitrogen. All other chemicals, including EGTA and MOPS, were purchased from Sigma (St. Louis, MO, USA).
Effect of an Indicator on Free Ion Concentration
Fluorescent indicators are used to measure cytosolic concentrations of free metal ions whose native concentrations can vary over a wide range, from ≤10-9 M (e.g.Zn2+) to ≅10-1 M (e.g. Na+ and K+). Regardless of these differences, the measurements are typically performed with indicator concentrations (dye) ranging from 30-150 μM, which are needed to provide sufficient signal for accurate intensity measurements. An indicator in such concentrations, however, may bind a substantial fraction of available ions creating a significant difference between the ion concentration before (iono) and after (ionfree ) adding an indicator (Figures 1-3 and supplementary Figure 1A). As determining the former is the ultimate goal of many experiments, and routine measurements provide only the latter [14], it is critically important to find out if and when the difference between iono and ionfree may become large enough to affect the interpretation of experimental results.
Figure 1

Figure 2

Figure 3

Supplementary Figure 4

To examine this issue, let us first consider a situation in which only an indicator can bind measured ions. A situation that assumes a simple 1:1 stoichiometry can be described by the following reaction:

At equilibrium, the concentration of free ions (ionfree) can be expressed as [31]

where ion and dye are the total ion and indicator concentrations, respectively, and Kd is the indicator apparent dissociation constant [31]. To make this equation applicable to a wide range of conditions and avoid indicator saturation, we first consider a hypothetical “smart” sensor whose Kd corresponds to the total and, in the absence of any buffering agents, also to the native ion concentration (iono).
Such an indicator (30 -150 μM) will not significantly reduce the free concentrations of ions whose intracellular levels fall in the milimolar range (i.e.Na+, K+ and possibly Mg2+), irrespective of its affinity for the measured ions (Figure 2A). In contrast, much lower indicator concentrations (dye<1 μM) would be sufficient to bind a vast majority of free Zn2+ and, to a lesser extent, Ca2+ ions (Figure 2A). Here, especially in the case of calcium whose native concentrations (cafo) range from ~0.1 μM in resting to 10 μM or even 100 μM in stimulated cells, the accuracy of the measurement (ionfree/iono) depends not only onion and indicator concentrations, but also on the dye dissociation constants. At this ion concentration range, low affinity probes yield markedly higher ionfree values than their high affinity counterparts (Figure 2A). For example, a standard “smart” indicator would report the cafo of 1 μM as either 0.99 μM or 0.01 μM when present in low (0.01 μM) or high (100 μM) concentrations (Figure 2A, black circles and squares), respectively. Likewise, the same cafo of 1 μM would be reported as 0.42 μM or 0.79 μM by the high (Kd=0.33 μM) or low (Kd=3 μM) affinity indicator (dye=1 μM; Figure 2A; vertical dashed line, white and gray triangles). Taken together these data illustrate how an indicator that can freely bind the ions it is supposed to measure can significantly reduce their free concentrations and report values (ionfree) markedly lower than those in the absence of the indicator whenever its concentration exceeds 10-20% of iono. Lowering probe affinity alleviates, but does not completely avoid the indicator buffering effect.
To put these data in perspective, we repeated the simulations for real-life, fixed affinity fluorescent indicators for 0.1 μM, 1 μM and 10 μM free Ca2+, concentrations corresponding to cytosolic free calcium levels in resting and stimulated cells. Indicator concentrations (1 μM <dye<250 μM) and dissociation constants (0.1 μM <Kd<10 μM) were selected to encompass those encountered in typical calcium imaging experiments and include commonly used indicators - fura-2 (Kd=0.22 μM) and its low affinity analogues, fura-4F (Kd=0.8 μM) and fura-2FF (Kd=6 μM) (Figures 2B-2D and Supplementary Figure 1B). It is worth noting that fura-2 and its low affinity analogue, fura-2FF at typical concentration of 50-100 μM would report caffree corresponding to merely 1% and 10-20% of cafo, respectively, for all considered cafo values (Figures 2B-2D).
The Role of Endogenous Buffers
In the absence of an indicator, the steady-state intracellular free Ca2+ concentration (cafo) is maintained by a balance between all available calcium ions (cat) and a variety of calcium binding proteins (CBP) [24,70]. Once introduced to a cell, an indicator, itself a calcium buffer competes with the endogenous buffers for the same pool of ions, which creates a new equilibrium and sets up a new free calcium level (caffree). This process can be described by a reaction

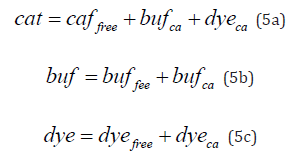
In which BUF and DYE refers to endogenous buffer and an indicator, respectively. The total pool of Ca2+ ions is split between the buffer (BUFCa) and the indicator (DYEca) with some ions remaining free (Cafree2+) . Assuming a simple 1:1 stoichiometry, total concentrations of calcium ions (cat), buffer (buf) and indicator (dye) can be expressed as sums of their free (caffree, buffree, dyefree) and calcium bound (bufca, dyeca) forms
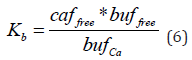
At equilibrium, the relationship between concentrations of free calcium ions (caffree), free buffer (buffree) and the Ca* BUF complex (bufCa) is determined by the dissociation constant (Kb) and defined as:
Consequently, the concentration of Ca*BUF complex can be expressed as
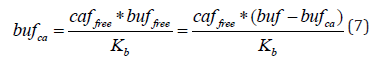
which is equivalent to

and by analogy the concentration of Ca2+-bound indicator (dyeCa) can be expressed as

where Kd is the dissociation constant of the DYECa complex. Substituting equations 8 and 9 into equation 5a yields expressions

that define the relations between the total (cat) and free (caf) calcium concentrations in the presence of endogenous (buf; Eqn.10a) and of both endo- and exogenous (dye; Eqn.10b) buffers with known affinities for calcium (Kb and Kd).
To examine these relationships more closely, we numerically solved Eqn. 10b for a set of conditions (section 3.1; Figures 2B-2D) assuming that cafo was maintained by low, medium or high affinity intrinsic buffers (Figure 3). The buffer concentrations were chosen to provide the same buffering capacity of 500 for cafo=0.1 μM; (Figure 3A, D, G). The same buffer concentrations were subsequently used for cafo of 1 μM (Figures 3B, 3E, 3H) and 10 μM (Figure 3C, F, I). The simulation results show that all considered indicators might be expected to yield caffree higher than 90% of cafo as long as the calcium concentration remains low (Figures 3A-3C). This is no longer the case when cafo exceeds the buffering range of the intrinsic buffer (cafo>>3*Kb) and Ca2+ ions can be more or less freely sequestered by an indicator. Here, just as in the absence of endogenous buffers (Figures 2B-2D), low affinity indicators, which bind fewer ions, report markedly higher caffree than high affinity ones, especially in the presence of high affinity buffer (Figure 3, Supplementary Figure 1C).
In summary, low cafo can be estimated quite accurately with almost any indicator, regardless of the properties of the endogenous buffers (Figures 1, 3A, 3D, 3G). However, as cafo rises, caffree becomes increasingly dependent on the complex relations between intrinsic and exogenous buffers (Eqn. 10b) and thus more likely to deviate markedly from cafo (Figures 1 & 3). The magnitude of this difference cannot be easily assessed without having, at least, rudimentary knowledge of the properties of the endogenous buffers. As a standard approach (Eq. 1) [14] does not consider this, the calculated caffree represents only a cafo estimate of uncertain accuracy.
Determination of the Native Ca2+ Concertation and Intrinsic Buffer Properties
Among the terms (dye, Kd, caffree, buf, cafo, and Kb) in Eqn.10b, only the first three are, at least in principle, known or controlled by the observer. The indicator concentration depends on the loading conditions and can be estimated by measuring fluorescence intensity [67]. The indicator dissociation constant (Kd) is determined by the choice of indicator, which is typically already well characterized [10,11] or can be measured in separate in vitro or in situ experiments. Finally, the free Ca2+ concentration (caffree) is derived from the indicator signal using the standard approach [14]. The other parameters, which include Ca2+ concentrations, cat and cafo, along with the concentration and affinity of the intrinsic buffer, are unknown and have to be determined.
Non-Linear Regression Analysis: As higher indicator concentrations tend to report lower caffree values (Figure1, Supplementary Figure 1), we hypothesized that the true indicator independent free calcium concentrations (cafo) and other system parameters (cat, buf, Kb) may be accurately estimated by extrapolating caffree values to the indicator-free environment. To test this hypothesis, we analyzed the data (Figure 1) using the “least square method” to minimize the function
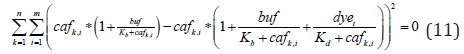
for k and i distinct calcium (cat) and indicator (dye) concentrations, respectively.
Figure 4

The effectiveness of this procedure may depend on the number of available datasets defined as either a number of different cat (k) probed with a single indicator concentration (i=1) or a number of distinct dye concentrations (i) used to measure a unique cafo level (k=1) (Figure 4). In addition, regression results are bound to be affected by data (caffree and dye) scatter (Figure 5). As the model systems contain several different calcium concentrations maintained by the same buffer (EGTA; dye=500 μM, Kb=0.15 μM), the procedure returns as many cafo and cat estimates as considered datasets (k), but only single buf and Kb value for each analyzed dataset array regardless of the number of indicator concentrations (i) (Figures 4A, 4C, 4E). Similarly, calculations utilizing data collected with i indicator concentrations in five solutions with different cafo (k=5) return five cafo and cat, but only single buf and Kb estimates (Figures 4B, 4D, 4F).
Figure 5

If the data collected with all five indicator concentrations (i=5) are taken into account, the regression procedure estimates cafo quite well regardless of the number of considered Ca2+ or their arbitrarily chosen combinations (Figure 4A). Using caffree data from two or more solutions featuring different calcium content (k≥2) reduces the scatter of the estimated cafo values, but does not avoid overestimating low, and underestimating high, cafo values (Figure 4A). On the other hand, caffree determined with at least two distinct indicator concentrations (i≥2) are required for accurate cafo estimates in a system comprising five different Ca2+ concentrations (Figure 4B). Likewise, to estimate the total calcium concentration and properties of endogenous buffer, the regression analysis must include caffree measured with at least two indicator concentrations in five test solutions (i≥2, k=5) or, alternatively, two solutions with five indicator concentrations (k≥2, i=5). If these minimal requirements are met or exceeded, regression analysis underestimates cat (Figures 4C, 4D) and buf (Figures 4E, 4F; black bars), but overestimates Kb (Figure E, F; grey bars)
To assess the impact of data scatter, on regression results, we analyzed all experimental data (k=i=5) after gradually raising their variability (Figure 5). Analysis of the nearly perfect data (Figure 5 σ =0) provides good estimates of all parameters, but as the data, particularly caffree, scatter increases, the accuracy of parameter determination begins to decline. The estimated cafo, the most stable parameter, becomes progressively higher (Figure 5A, open triangles) or lower (Figure 5A, open circles) than actual values. The total Ca2+ concentrations (Figure 5C) tend to be underestimated with higher values being relatively less affected. Finally, increasing the caffree variability leads to describing the endogenous buffer as weaker and less abundant than it actually is. (Figure 5E) and in consequence leads to underestimating its buffering capacity (data not shown). In contrast, increasing the variability (i.e. decreasing the accuracy) of indicator concentration determination, seems less consequential. Here, the estimated parameters are little affected by growing data scatter, but the confidence intervals, particularly those of buf and cat, become broader (Figures 5B, 5D, 5F).
In summary, non-linear regression can provide estimates of the Ca2+ concentrations and intrinsic buffer characteristics in an experimental system if at least two datasets (k≥2 or i≥2) are used for analysis. In this case, regression estimates of the true free Ca2+ concentration and approximates, albeit with a lesser accuracy, cat, buf and Kb. The accuracy of the estimates depends on the precision of caffree rather than dye determination. Consequently, contingent on the magnitude of experimental errors, regression results may constitute accurate estimates or just represent the lower or upper limits of the actual values.
Linear Approximation: To avoid complexities involved in solving equation 11, which requires specialized software, we have converted equation 10b into a linear form
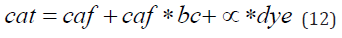
in which bc= buf/(Kb+caffree) and α= caffree/(Kd+ caffree) denote the buffering capacity of the intrinsic buffer and the fraction of Ca2+-bound indicator, respectively. Solving this equation for dye yields a simple linear function (y=a*x+b) in which y=dye, x=1/α, a=cat and b=- caffree / α - caffree *bc/ α =- caffree / α *(1+bc) =-(Kd+ caffree)*(1+bc). Assuming that the indicator concentrations (dye) and corresponding fractions of Ca2+–bound indicator (α) have been experimentally determined (Figure 1), analyzing this relationship (Eqn.12) provides estimates of the cat and cafo. While the former is determined directly as a slope (a=cat), the latter can be calculated from the x-intercept of the regression line (dye=0, cafo=Kd* α0 /(α0-1)) (Figure 6A). Once the cafo, cat and Kd are known, the buffering capacity (bc) can be calculated from the y-intercept b (bc=-b/(cafo+Kd)-1) or, alternatively, as the ratio of total and free calcium concentrations (bc=cat/cafo-1). The procedure provides accurate estimates of cafo (Figure 6B, grey bars) and underestimates cat and bco (Figure 6A, white and black bars) as long as the measured Ca2+ concentrations remain lower than 10 µM, at which point the calculated parameters, particularly cafo and bc, deviate markedly from the actual values (Figure 6B). This loss of accuracy may arise from assuming that the free term b in equation12 is independent on caffree, a simplification necessary for problem linearization. Once this procedure is repeated in several systems with the same intrinsic buffer but different Ca2+ concentrations, the relationship between the formerly determined values of bc and cafo can be analyzed to estimate the concentration and affinity of the endogenous buffer. This time, the definition of the buffering capacity (bc=buf/(Kb+cafo)) is converted into a linear form
In which the dependent (y=cafo) and independent (x=1/bco) variables are known. The slope and the y intercept determined by the regression analysis correspond to the buffer concentration (buf) and the buffer dissociation constant (Kb), respectively (Figure 6B inset). As the analyzed data, cafo and bco, are just estimates derived from another regression procedure (Eqn. 12), the results, buf and Kb differ somewhat from the actual values (Figure 6B, light grey bars).
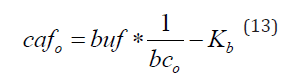
Figure 6

In which the dependent (y=cafo) and independent (x=1/bco) variables are known. The slope and the y intercept determined by the regression analysis correspond to the buffer concentration (buf) and the buffer dissociation constant (Kb), respectively (Figure 6B inset). As the analyzed data, cafo and bco, are just estimates derived from another regression procedure (Eqn. 12), the results, buf and Kb differ somewhat from the actual values (Figure 6B, light grey bars).
Cellular Data
To test this approach in situ, we measured free Ca2+ concentrations [Ca2+]i with fira-2 in cultured neurons subjected to brief depolarization with 50 mM K+ using a standard method (Eqn.1). These values (caffree) proved to be heavily dependent on fura-2 concentration (Figure 7A): the higher it was, the lower were the peak caffree values and their dissipation rates (Figure 7A, filled circles). While fura-2 concentration effect was evident in cells featuring elevated Ca2+ levels (Figure 7A), the indicator also reduced free Ca2+ levels in resting neurons (Figure 7C, black bars), patterns predicted by the theoretical models (Figures 2 & 3) and observed in in vitro buffer systems (Figure 1, Supplementary Figure 1A). Using the methods described in section 3.3.1 and 3.3.2., we analyzed the relationship between selected caffree values (Figure 7A, asterisks) and indicator concentrations. This approach efficiently corrected the peak amplitude, but not the time course of calcium change (Figure 7A, open circles). The estimated cafo in resting (~22 nM) and stimulated (1.18 μM) neurons (Figures 7A & 7C) are higher than caffree derived from singe measurements (Figure 7C). It seems therefore that routine experiments may provide accurate cafo estimates only if carried out with much lower fura-2 concentrations than the lowest one tested (33 μM). This critical indicator concentration is hardly a universal limit as it may vary depending on the cafo (Figures 1 & 3), properties of endogenous buffer (Figure 3) and indicator itself (Supplementary Figure 1C).
As indicator concentration increases, so does the gap between caffree and cafo in both resting and stimulated neurons (Figure 7C). Interestingly, the cafo in resting neurons with the highest fura-2 concentration (~ 288 μM) is much higher than overall cafo calculated by analysis of all available data (Figure 7C, horizontal line). The nature of this difference is somewhat unclear. It may result from inaccuracy of the collected data and processing (Figure 5) or reflect an actual effect an indicator at high enough concentrations may exert on calcium homeostasis.
Figure 7

In addition to estimating cafo, regression analysis provides an estimate of the total Ca2+ concentration (Figure 7B, grey bars) and offers an insight into the nature of the generic Ca2+ buffer in the cytosol (Figure 7B, black and white bars). We assessed this using both the non-linear regression (Eqn. 11) and its simplified linear version (Eqn. 12 and 13). The multiple regressions estimated the cat in resting and depolarized neurons to be 12.5 μM and 306 μM, respectively. Taken together with the cafo approximation of 22 nM and 1.18 μM (Figure 7B), we can calculate the buffering capacity as 560-570 in resting cells and ~260 at the peak Ca2+ response. Calculating buffering capacity from the concentration of endogenous buffer (buf=509 μM) and its affinity (Kb=0.78 μM) (Figure 7B), provides similar results, 634 and 259, in resting and stimulated neurons, respectively. In turn, the linear regression presented neurons as having somewhat higher concentration (buf=653±150 μM) of a lower affinity buffer (Kb=1.63 ± 0.62 μM) (Figure 7B), which corresponds to buffering capacity of 359 and 232. Although the results generated by both methods are somewhat different (Figure 7B), they are consistent with the consensus that neurons contain relatively high concentrations of a low affinity buffer. In either case, the data indicate that only a very small fraction of Ca2+ ions (<0.4%) remains free even when cafo peaks after depolarization. Even though this buffering system is quite efficient, adding another buffer such as fura-2 can markedly reduce cafo (Figure 7A).
Although accuracy of data provided by both methods cannot be independently verified, our experiments in model systems (Figure 5) offer some general guidelines for interpretation. In particular, the in vitro experiments demonstrate that the cafo estimates are the least prone to experimental errors (Figures 5A & 5B) with the exception of the non-linear regression being unable to correctly assess the cafo of 10 μM (Figure 7C). As the depolarization induced Ca2+ rise was 8-9 times lower than that, this shortcoming is not likely to affect the results provided by the simplified method. However, such possibility should be taken into account if the considered peak cafo are high. Regarding other parameters, the accuracy of their determination depends on the data scatter, particularly the variability of caffree. Following the lessons from the in vitro experiments (Figure 5), we expect the actual cat and buf to be higher and the Kb to be lower than the calculated values.
Fluorescent indicators are convenient tools to determine intracellular concentrations of calcium and other ions. Their application seems to fall into two broadly defined, but distinct categories. The first includes detailed analysis of biophysical aspects of calcium signaling in excitable cells and relies on complex methodology [37,71- 76]. The other, by far more popular, strives to examine changes in global calcium concentration in virtually any cell type using standard methods [14] Among many insights gained through the “biophysical” approach, the one regarding “safe” indicator concentrations seems particularly relevant for more generic studies. Namely, it has been postulated that an indicator does not affect and can therefore accurately trace Ca2+ signals as long as the calcium binding ratio (κd) [22] remains markedly lower than that of the cytoplasm (κS) [32].
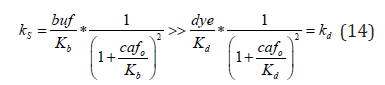
At least in principle, this equation allows determination of the maximum indicator concentration that would guarantee accuracy of the measurements (for recent reviews see [18,32]). However, practical use in experiments has proven difficult for several reasons. First, the equation itself is quite restrictive and calls for using indicator concentrations that are too low to allow accurate fluorescence measurements, and most routine measurements utilizes indicators at much higher concentrations (30-150 μM) [18,32]. Second, not only do κS values vary considerably between different cells and remain unknown in most cases, but they change with Ca2+ concentration (Eqn.14). Finally, even if κd and κS were known, a rather unlikely scenario, it is not clear how to interpret the “κS>>κd” requirement. While a κS/κd ratio exceeding 1000, a situation common in calibration solutions, certainly meets this condition, it is unclear what the critical value is in cells. In consequence, indicator signals, ratios or normalized intensities, taken directly or converted into [Ca2+]i 1[14] may be affected by the indicator itself. While the extent of this effect is hard to judge in any particular case, our data demonstrate the complexity of the effect and suggest that large [Ca2+]i rises in the presence of high affinity buffer are most likely to be influenced by high affinity indicators (Figure 3, Supplementary Figure 1).
These observations are relevant for two most common categories of routine calcium imaging experiments. When used to compare [Ca2+] i changes induced by different agents in the same cell type, an indicator might underreport caffree values, especially high ones, and diminish, or even mask, differences [53,56]. On the other hand, an indicator may report a similar change in [Ca2+]i as being different between two cells, if the compared cells feature different kS. This problem may be quite common, since intrinsic buffering capacity is known to differ between cell types [77,78] and may change with cell age [79-81]. To find out whether the observed [Ca2+]i is affected by an indicator, it is enough to repeat the measurement with reduced indicator binding ratio (κd). If lowering the indicator concentration or affinity results in increasing indicator response, it is a clear sign that the [Ca2+]i might be underestimated (Figures 1 & 7, Supplementary Figure 1). Unfortunately, such comparisons are rarely performed and indicator Ca2+ buffering and its potential implications do not receive as much attention as they deserve. Our own data suggest that fura-2 concentration in hippocampal neurons need to be much lower than 30-35 μM to report peak cafo of 1 μM accurately (Figure 7). Some conservative estimates recommend values as low as 6-10 μM [40, 82], concentrations that performed well in our EGTA-buffered in vitro system (Figure 1, Supplementary Figure 1).
If lowering the indicator concentration is not feasible, the use of lower affinity indicators [9,48,51] may be an attractive option as they will be less likely to affect Ca2+ homeostasis (Fqn.14; Figure 3, Supplementary Figure 1C). If we assume that accurate determination of a [Ca2+] of 1 μM can be accomplished with fura-2 concentration of 10 μM, the same can be achieved, at least in principle, with 12 μM fura-2FF (Kd=6 μM), 21 μM BTC (Kd =12 μM) or 40 μM mag-fura-2 (Kd=25 μM). However, as the indicator affinity decreases, so does the relative magnitude of the response (82% and 3.4% of the dynamic range of fura-2 and mag-fura-2, respectively), which limits usefulness to high Ca2+ concentrations (see also Supplementary Figure 1D). Interestingly, this is the range in which high affinity counterparts are most likely to fail (Figures 1 & 3, Supplementary Figures 1A & 1C). Despite this and other advantages [62], low affinity indicators have not gained much popularity and are rarely used.
As lowering indicator concentrations or affinity might not be feasible for practical reasons, and the formerly developed methods [21,63,76,77] may be too complex for routine experiment, we have developed a simplified approach to estimate indicator-independent free Ca2+ levels. Although conceptually similar to its predecessors [21,66,83,84], this procedure requires only data collected in almost any Ca2+ imaging experiment. To test it, we first processed data from well-defined in vitro systems (Figure 1) and found out that to work appropriately it requires data from at least two different cafo (k≥2), collected with two or more indicator concentrations (i≥2) (Figure 4). Practically, this means that to obtain a minimal amount of data it is necessary, and possibly sufficient, to repeat the same experiment using two different fura-2 concentrations (Figure 4). Analysis of model data also shows that, while cafo estimates are quite accurate, other parameters tend to deviate from the actual ones as the data scatter increases (Figure 5). As these trends are quite stable, it is possible to conclude that the actual valise are either lower (Kb) or higher (cat, buf) than those produced by the proposed method.
When applied to data collected in AM-loaded neurons, the tested procedure provided estimates of indicator-independent free Ca2+ concentration (cafo) in resting and depolarized neutrons (Figures 7A & 7C) and offered insight into the nature of endogenous buffer properties (Figure 7B). As the data scatter affects these values in different ways (Figures 5-6), only the cafo can be considered as reasonably accurate while the others, including buf, Kb and cat, constitute estimates of unknown accuracy. Although calculated buf (500-700 μM) and Kb (0.78-1.6 μM) (Figure 7B) are most likely under- or overestimated, they are consistent with the consensus notion that neurons contain large quantities of low affinity buffer. As the tested method also estimates total Ca2+ concentrations, subtracting the calculated values may provide a way to assess, albeit perhaps not very accurately (Figures 5C & 5D), the total calcium flux (Figure 7B).
It is interesting to note that mean cafo calculated by averaging cafo in individual neurons containing the highest fura-2 concentration (dye~288 μM) before (34±4 nM) and after stimulation (1.76±0.38 μM) are much higher than cafo derived from regression analysis of all data (22 nm and 1.08 μM, respectively (Figure 7C). These differences may result from inaccuracy of experimental data, but our in vitro experiments seem not to support this notion (Figure 5) Although we cannot rule this option out completely, there is ample, though indirect, evidence that excessive buffering might change the system behavior, increasing calcium influx by disrupting Ca2+ dependent inactivation of L-type voltage gated Ca2+ channels [85,86]. If fura-2 in high concentrations could do just that, it would create a paradoxical situation in which an indicator enhances Ca2+ influx (Figure 7C), yet masks the increase at the same time (Figure 7A). If this is confirmed to be the case, it would add to the growing list of indicator side effects [87] that includes inhibition of Na,K ATPase [88], activation of Ca2+ -activated K+ channels [89,90] and impairment of calcium release [91,92]. There is also no reason to think that the fluorescent BAPTA derivatives that are used as indicators act differently than BAPTA itself, which has been shown to reduce or even block neurotransmitter release [93,94], change neuron susceptibility to excitotoxicity [95,96] and impede cell differentiation [97].
It is clear that using the lowest possible indicator concentrations and replacing, when feasible, standard indicators such as fura-2 with low affinity analogues can minimize or even eliminate such unwanted effects. The same steps may also help to improve the accuracy of routine Ca2+ measurements. Should they prove insufficient, the indicator- independent free Ca2+ concentration, total Ca2+ influx and endogenous buffer properties can be estimated with the method we propose, using data collected in any AM ester loaded cells.
By binding calcium ions, fluorescent calcium indicators may markedly reduce their intracellular concentration and underreport [Ca2+]i. This problem may be theoretically solved by lowering indicator concentration to “safe” levels and/or using low affinity indicators. As these approaches may not always be feasible for practical reasons, extrapolating [Ca2+]i to “no dye” conditions may prove useful in estimating the native, indicator-independent free Ca2+ concentration ([Ca2+] o) even in AM ester loaded cells.
This study was supported by the Center for Investigation of Membrane Excitability Diseases (CIMED), the Hope Center for Neurological Disorders of Washington University and NIH grants P01 NS032636 and R01 NS36265 (to MPG). We are grateful to Ms. Ann Benz for providing the cells for this study and to Dr. C. McClenaghan and Ms. M. Hyrc for help in preparing the manuscript.
None.


