Impact Factor : 0.548
- NLM ID: 101723284
- OCoLC: 999826537
- LCCN: 2017202541
Fariba Mokhtarian1, Arman Ahmadzadeh2*, Alireza Razavi1*, Zahra Aghazadeh1, Saiedeh Omidian1, Abdolrahman Rostamian3 and Abbas Mirshafiey1,4*
Received: August 24, 2023; Published: September 04, 2023
*Corresponding author: Arman Ahmadzadeh, Department of Rheumatology, Loghman Hakim Hospital, Shahid Beheshti University of Medical Sciences, Tehran, Iran
Alireza Razavi, Department of Immunology, School of Public Health, Tehran University of Medical Sciences, Tehran, Iran
Abbas Mirshafiey, Livonian Biotech Millennium Ltd, Riga, LV-1013, Latvia and Department of Immunology, School of Public Health, Tehran University of Medical Sciences, Tehran, Iran
DOI: 10.26717/BJSTR.2023.52.008285
Background: Chemokines and their receptors are the main intermediators of migration of cells. Regarding the leukocytes infiltration into the different tissues of Systemic Lupus Erythematosus (SLE) patients, current study evaluated the effects of α-L-guluronic acid (G2013) [as a new member of Non- Steroidal Anti-Inflammatory Drugs (NSAIDs) family] on expression of chemokine receptors in Peripheral Blood Mononuclear Cells (PBMCs) of patients with SLE.
Methods: After taking blood from 12 SLE patients and healthy controls, PBMCs were separated and cultured in RPMI-1640 medium. The cells exposed with lipopolysaccharide (LPS) and then patients’ cells were treated with 5, 25 and 50 μg/mL dose of G2013 and optimum dose (1μg/mL) of diclofenac. Realtime PCR was used for evaluating the mRNA expression of CXCR3, CXCR4, CCR1, CCR2 and CCR5. Cell surface expression of CCR2 was measured using flow cytometry.
Results: CXCR3, CXCR4, CCR1 and CCR2 mRNA expression down-regulated significantly after treatment of the patients’ cells with all three doses of G2013 and optimum dose of diclofenac. CCR5 mRNA expression down-regulated significantly followed by treatment of these cells with moderate and high doses of G2013 and optimum dose of diclofenac. Cell surface expression of CCR2 diminished significantly followed by treatment of these cells with high dose of G2013 and optimum dose of diclofenac.
Conclusion: This study indicated that G2013 (Guluronic acid) modifies the expression levels of the chemokine receptors’ genes which may restrict the infiltration of immune cells into the inflammatory tissues.
Keywords: Systemic Lupus Erythematosus; SLE; Guluronic Acid; G2013; NSAID; Chemokine Receptors
Abbreviations: SLE: Systemic Lupus Erythematosus; NSAIDs: Non-Steroidal Anti-Inflammatory Drugs; PBMCs: Peripheral Blood Mononuclear Cells; CV: Cardiovascular; AS: Ankylosing Spondylitis; RA: Rheumatoid Arthritis; FT-IR: Fourier Transform Infrared; SLEDAI: Systemic Lupus Erythematosus Disease Activity Index’s; LN: Lupus Nephritis; TUMS: Tehran University of Medical Sciences
SLE is one of the systemic autoimmune diseases that is induced by the deposition of circulating immune complexes and complement activation which leads to infiltration of different type of leukocytes following local generation of chemokines. This process can amplify inflammation with action as inflammatory and profibrotic mediators' source e.g., cytokines, chemokines, and extracellular matrix proteins [1-4]. Although SLE is a multi-organs disease, Lupus nephritis (LN) and Cardiovascular (CV) complications are major causes of morbidity and mortality in SLE patients [4,5]. Chemokines have a fundamental role in trafficking and recruitment of leukocyte population under homeostatic and pathological conditions and perform their function through chemokine receptors [4,6]. C-X-C motif chemokine receptor type 3 (CXCR3) is one of the important receptors which expressed mainly on effector and activated T cells with IL-2 (specially Th1, Th17 and effector CD8+ T cells); so, it seems that contributing to effector stage of immune responses and selective collection of T lymphocytes [4,6,7]. The ligands of this receptor have induced expression by interferon and increased expression in patients, especially with skin and nephritis manifestations [4,6].
The results of a study on SLE patients in the flare phase showed the number of CD4+ CXCR3+ T cells in the blood decreases because of these chemokine receptors and subsequently cell infiltration into tissues. Also, in the group of pathogenic CD 19high B cells high rate of CXCR3 expression and migration to inflamed tissues were observed [4]. The C-X-C motif chemokine receptor type 4 (CXCR4) plays a role in many immune system functions, such as cell chemotaxis, proliferation, apoptosis, survival, and differentiation [4,8,9]. Despite increased expression of this receptor in the murine models of active nephritis lupus, SLE patients have shown upregulated, downregulated, or unchanged levels of that [8,10]. The C-X-C motif chemokine ligand 12 (CXCL12) as the most important ligand of CXCR4 has crucial function in the homing of B cells to lymphoid follicles and inflammatory tissues [9]. Different studies in mice models show blocking the CXCL12-CXCR4 axis can decrease T and B lymphocyte activation, autoantibody production and renal inflammation as well as improve lifespan [4,8]. The C-C chemokine receptor type 1 (CCR1) is involved in Th1-dependent systemic humoral immune response [6]. IL-2 and IL-15 can be induced its expression on activated T cells whereas in monocytes, IL-10 selectively up-regulated this receptor expression by prolonging mRNA half-life [7]. The use of this receptor antagonism can reduce the number of T and mononuclear phagocyte cells to kidney, but it does not change the humoral immunity [1,4,11]. C-C chemokine receptor type 5 (CCR5) is expressed on monocytes/ macrophages and T cells (both CD4+ and CD8+ subsets), especially on Th1 cells [4].
Expression of this receptor regulated by activation of MAP and STAT kinases and deficiency of that can have different outcomes in various diseases which depends on crucial cell types and whether the initial immune response (in lymphoid organs) or the effector phase (in nonimmune tissues) is involved. In lupus-prone mice CCR5 deficiency, in macrophages have decreased the ability to produce the inflammatory cytokines while this defect in the T cells can lead to production of high level of IFN-γ, GM-CSF and IL-4 with increased of humoral immune responses following antigen challenge [4,7]. Multiple studies show that the expression of these two receptors and their ligands is elevated both in SLE patients and animal models in the kidney during the development of LN. And despite similarity in target ligands; the pattern of their expression indicates that monocytes express a high level of CCR1 but low CCR5, while in activated/ memory T cells this pattern is opposite [6]. The C-C chemokine receptor type 2 (CCR2) is another effective chemokine receptor in the SLE. However different cell populations can express this receptor, but monocyte/ macrophages are the main population. So most renal-infiltrating CCR2+ cells are macrophages [4]. .This receptor can exhibit dual pro and anti-inflammatory function and it is dependent on the type of cell expressing that.
So that its expression on inflammatory cells like APCs, could be led to its pro-inflammatory function and if it is expressed on regulatory T cells (Tregs), it will have the anti-inflammatory properties [12]. CCR2 expression induced by IL-2 in T lymphocytes, whereas in monocytes IL-10 selectively up-regulated its expression by prolonging the mRNA half-life [4]. Studies in mice models indicate the increased expression of these molecules in the kidney during the development of LN [4]. Furthermore, in SLE patient’s basophil recruitment to skin lesions through upregulation of CCR1 and CCR2 chemokine receptors can be seen [13]. Although hydroxychloroquine and glucocorticoids are cornerstone of SLE treatment but limited use of NSAIDs is also available [14,15]. G2013 is a new member of NSAIDs which its anti-inflammatory and immunomodulatory properties along with high safety have been proven in numerous studies especially on animal model and phase Ⅰ/Ⅱ clinical trials on rheumatoid arthritis (RA) and ankylosing spondylitis (AS (diseases [16-25]. The present study aimed to investigate the anti-inflammatory efficacy of G2013 in low, moderate and high doses (5,25 and 50 µg/mL) and optimum dose (1µg/mL) of diclofenac (as a widely used NSAID) on mRNA expression of CXCR3, CXCR4, CCR1, CCR2 and CCR5; in addition to cell surface expression of CCR2 in PBMCs of SLE patients.
The protocol of this research was approved by ethical committee of Tehran University of medical sciences (TUMS), Tehran, Iran (No. IR.TUMS.SPH.REC. 1396.2660) and written informed consent was obtained from all study subjects. G2013 patented (DE-102016113017.6) and its preparation was done in immunology section of pathobiology department of TUMS. Extraction of α-L-Guluronic acid molecule took place from alginic acid sodium salt powder (Sigma-Aldrich, St. Louis, MO) by heavy acid hydrolysis using sulfuric acid and hydrochloric acid with heat and minimum 16 hours of incubation. Fourier transform infrared (FT-IR) spectroscopy and carbon-13 nuclear magnetic resonance (13C-NMR) spectroscopy used to confirm its molecular weight (194.139 g/mol) and exact/monoisotopic mass (194.043 g/mol).
Study Subjects
12 patients (11 females and 1 male, between 20-45 years) with kidney disease manifestations in flare or active phase of SLE (based on high anti-ds DNA and/ or Low Complement) were selected. Their disease severity was scoring based on the systemic lupus erythematosus disease activity index’s (SLEDAI) twenty-four criteria [seizure, psychosis, organic brain syndrome, visual disturbance, cranial nerve disorder, lupus headache, new onset of cerebrovascular accident (CVA), vacuities, arthritis, myositis, urinary casts, hematuria, Proteinuria, pyuria, rash, alopecia, mucosal ulcers, pleurisy, pericarditis, low complement, increased DNA binding, fever, thrombocytopenia, leukopenia].All of them had problems with at least one kidney function test at the time of sampling and patients were selected from score close together individuals (Table 1). Also 12 healthy individuals were considered with the similar age and sex.
Blood Collection, Isolation of PBMCs and Cell Culture
Blood was collected in sodium heparin venoject tubes (Broken Bow, USA) as an anticoagulant and were diluted to volume ratio of 1:1 with sterile PBS (Merk Company, Germany). PBMCs were isolated using centrifuges on a ficol-paque (Biosera, UAE). The number of cells were counted using the trypan blue (Thermofisher, USA) and then PBMCs were seeded at a density of 1 × 10⁶ cells per well in 24-well plates (SPL Life Science Company, Ireland) in CRPMI [90% RPMI-1640 (Biosera Company, UAE), 9%FBS (Gibco Company, USA), 1%Pen/Strep (Gibco Company, USA)] and exposed to 1µg/mL of LPS (Bioscience Company, USA). After 4 hours LPS exposure, the patients’ PBMCs were treated with 3 concentrations of G2013 (5, 25 and 50 µg/mL) and optimum dose (1µg/mL) of diclofenac (Daroupakhsh Pharmaceutical Company, Iran), and incubated for 18 hours, whereas other wells (healthy controls and untreated patients' PBMCs) were only exposed to LPS. Following the required incubation time, the cells were harvested and part of them after adding trizol reagent (Gene all, South Korea) (1 mL with 107 cells) was stoked at -70 °C and the rest of them was transmitted in liquid nitrogen after adding freezing media [80%FBS, 10% RPMI-1640, 10%DMSO (MP Biomedical Company, USA)] (1 mL with 107 cells).
RNA Extraction and cDNA Synthesis
The total cellular RNA was extracted from 2 × 10⁶ ˗ 4 × 10⁶ PBMCs after defreezing samples using Gene All Hybrid-R™ Mini kit (GeneAll, South Korea) according to the manufacturer’s guidelines and placed into 48 μL of Nuclease-free water. The concentration and purity of extracted RNA [measured absorption at A260/280 and 260/230 nm wavelengths and Optical Density (OD)] was determined by utilizing Nano Drop 2000 UV– Vis Spectrophotometer (Thermo Fisher Scientific Company, USA). To eliminate DNA contamination, RNase-free DNase I enzyme (Jena Bioscience Company, Russia) added based on the RNA concentration. Their density and purity were then assessed again, and all the samples RNA s' concentration was adjusted to ≤ 400 ng/μL, to cDNA synthesis. Total RNA was reverse transcribed using Takara-bio cDNA synthesis kit (GeneAll, South Korea) following the manufacturer's instructions. The cDNA synthesis reactions were 20μl, include 10μl total RNA, 1μl Random hexamer, 1μl dNTPs, 2μl Nuclease-free water, 2μl RT reaction buffer (10×), 2μl MDTT (0.1), 2μl HyperScript Reverse Transcriptase (200 U/μl), 1μl ZymAll™ RNase Inhibitor.
Quantitative Real-Time PCR (qRT-PCR)
Quantitative real-time PCR was done based on SYBR® Premix Ex Taq™ II (Takara-bio-Company, Japan) address instruction and using the primer probe sets (Bioneer Company, South Korea) (Table 2) and ABI step one plus real time PCR system (Applied Biosystems Company, USA). For this purpose, 20 µL of real-time PCR reactions including 7 µL nuclease-free water, 1.6 µL primers (with equal ratios of forward and reverse primers), 10 µL SYBR® Premix Ex Taq™ II, 0.4 µL Rox and 1µL template cDNA were used. Glyceraldehyde-3-phosphate dehydrogenase (GAPDH) was used as housekeeping gene for normalizing the reaction. Furthermore, a negative control (without cDNA) was used to detect any possible contamination. The multiplex thermal reaction program was done. One cycle of 95 °C for the 30s, 40 cycles of 95 °C for 5s, 60 °C for 60s, 95 °C for 15s.finally relative transcript level of each gene was calculated by the 2- ΔΔct method and normalized to the level of the GAPDH housekeeping gene.
Flow Cytometry
After taking out the samples from liquid nitrogen and melting, they were washed with RPMI-1640 and flow cytometric buffer (5⁒ FBS +95⁒ PBS) and then distributed into two tubes, one of them was considered as test and the other as isotype control. In the next step, the test cells were treated with PE-labeled anti- human CD192 (CCR2) (Biolegend, San Diego, CA, USA) and isotype control tube cells treated with PE-labeled mouse IgG2a, κ isotype control (Biolegend, San Diego, CA, USA). Test and isotype control tubes incubated at 37 ºC and 4 ºC for 30 minutes, respectively. After finishing the required incubation time, the cells were washed using flow cytometric buffer and CCR2 cell surface expression was characterized by utilizing BD FACS calibur flow cytometer (Partec Company, United Kingdom). Ultimately, the data were analyzed using Flowjo 7.6.1.
Statistical Analysis
Statistical analysis of the data was done by statistical package for the social sciences (SPSS) software (24.0; IBM Corporation, Armonk, NY, USA). Kolmogorov-Smirnov and Shapiro-Wilk tests were applied to estimate whether data distribution is normal. Parametric and nonparametric analyses were performed based on the finding of this evaluation. For the normal data, to compare the mean of the independent ones, independent sample T test and for comparing the intergroup data, Paired sample T test were used while, for the abnormal independent data, Mann-Whitney test and for the abnormal intergroup data Wilcoxon test were used. P-value ≤0.05 was considered as statistically significant. The statistical significance was categorized as *P ≤0.05, **P ≤0.01.
Effect of G2013 on mRNA Expression of CXCR3
The results of qRT-PCR demonstrated that CXCR3 mRNA expression in the patients' untreated cells was significantly higher than the healthy control group (1.94-fold, P=0.02). After treatment of the patients' cells with low, moderate, and high concentration of G2013 (5, 25 and 50 μg/mL), CXCR3 mRNA expression diminished in these cells (2.46, 2.87, 3.01-fold respectively), and these reductions were statistically significant (P=0.003, 0.002, 0.002 respectively). Also, optimum dose of diclofenac (1μg/mL), could down-regulate CXCR3 mRNA expression in these cells significantly (2.73-fold, P=0.002) (Figure 1).
Effect of G2013 on mRNA Expression of CXCR4
The results of qRT-PCR indicated that CXCR4 mRNA expression in the patients' cells was higher than the cells related to healthy controls. (0.22-fold), however, their difference was not significant statistically (P=0.38). After treatment of the patients' cells with low, moderate, and high doses of G2013 (5, 25 and 50 μg/mL), CXCR4 mRNA expression decreased significantly in these cells (0.67, 1.29, 1.29-fold, respectively), and these reductions were statistically significant (P=0.02, 0.003, 0.003, respectively). Optimum dose of diclofenac (1μg/mL), down-regulated CXCR4 mRNA expression in these cells significantly (1.09-fold, P=0.002) (Figure 2).
Figure 1 Effect of G2013 on CXCR3 gene expression. The relative quantification of genes mRNA was compared versus GAPDH gene mRNA and computed by the 2-ΔΔCt manner. The outcomes represent the mean±SEM. P-value ≤ 0.05 was supposed to be statistically significant. Significant reduction compared to the Untreated group: *P ≤ 0.05 and **P ≤ 0.01.
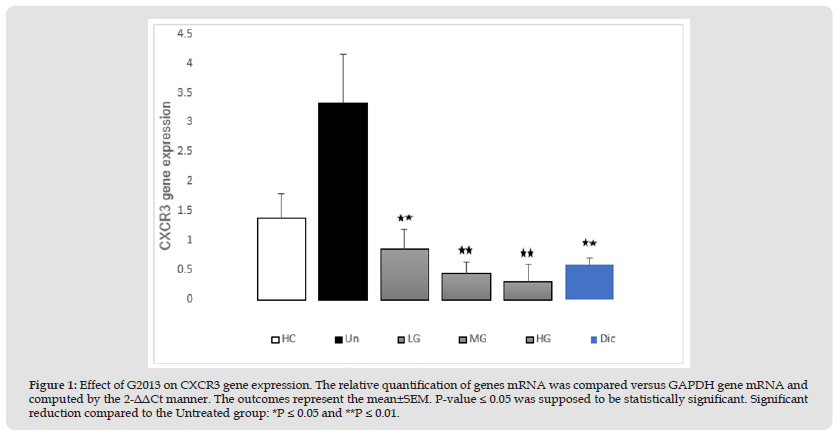
Note: G2013: α-L-Guluronic acid, HC: Healthy control, Un: Untreated patient, LG: Low dose G2013, MG: Moderate dose G2013, HG: High dose G2013, Dic: Diclofenac. RT-PCR; Real-Time Polymerase Chain Reaction, GAPDH: Glyceraldehyde-3-Phosphate Dehydrogenase.
Figure 2 Effect of G2013 on CXCR4 gene expression. The relative quantification of genes mRNA was compared versus GAPDH gene mRNA and computed by the 2-ΔΔCt manner. The outcomes represent the mean ± SEM. P-value ≤ 0.05 was supposed as statistically significant. Significant reduction compared to Untreated group: *P ≤ 0.05 and **P ≤ 0.01.
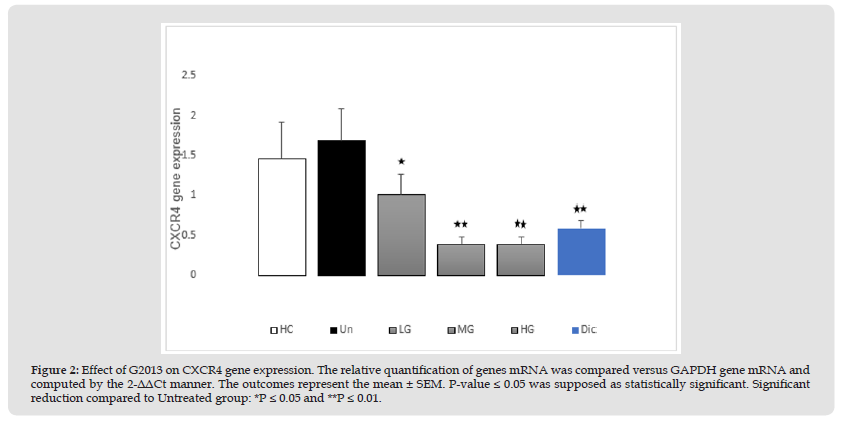
Note: G2013: α-L-Guluronic acid, HC: Healthy control, Un: Untreated patient, LG: Low dose G2013, MG: Moderate dose G2013, HG: High dose G2013, Dic: Diclofenac. RT-PCR; Real-Time Polymerase Chain Reaction, GAPDH: Glyceraldehyde-3-Phosphate Dehydrogenase.
Effect of G2013 on mRNA Expression of CCR1
The results of qRT-PCR showed that CCR1 mRNA expression in the patients' cells was higher than to healthy controls. (0.13-fold), however, their difference was not significant statistically (P=0.24), but treatment of the patients' cells with low, moderate and high concentrations (5, 25 and 50 μg/mL) of G2013 decreased CCR1 mRNA expression in these cells (1.41, 1.5 and 1.65-fold respectively) and these reductions were statistically significant, (P=0.01, 0.01, 0.002 respectively), as well as treatment of these cells with optimum dose of diclofenac (1μg/mL), reduced CCR1 mRNA expression significantly (1.19-fold, P=0.02) (Figure 3).
Figure 3 Effect of G2013 on CCR1 gene expression. The relative quantification of genes mRNA was compared versus GAPDH gene mRNA and computed by the 2-ΔΔCt manner. The outcomes represent the mean ± SEM. P-value ≤ 0.05 was supposed as statistically significant. Significant reduction compared to Untreated group: *P ≤ 0.05 and **P ≤ 0.01.
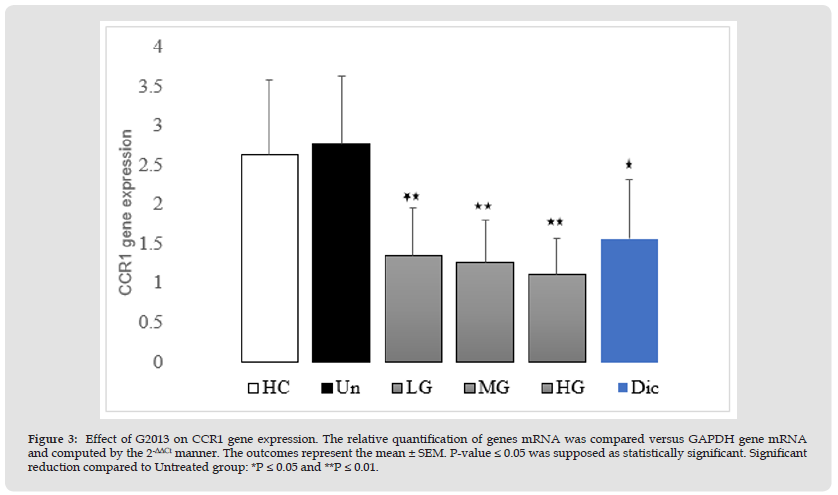
Note: G2013: α-L-Guluronic acid, HC: Healthy control, Un: Untreated patient, LG: Low dose G2013, MG: Moderate dose G2013, HG: High dose G2013,Dic: Diclofenac. RT-PCR; Real-Time Polymerase Chain Reaction, GAPDH: Glyceraldehyde-3-Phosphate Dehydrogenase.
Effect of G2013 on mRNA Expression of CCR2
The results of qRT-PCR demonstrated that CCR2 mRNA expression in the patients' untreated cells was higher than the healthy control group (1.28-fold), however, their difference was not significant, statistically (P=0.11). Treatment of the patients' cells with low, moderate and high doses (5, 25 and 50 μg/mL) of G2013 decreased CCR2 mRNA expression in these cells (2.64, 2.9, 2.81-fold respectively), and these down-regulation were statistically significant, (P=0.004, 0.002, 0.002 respectively), as well as treatment of these cells with optimum dose (1μg/mL) of diclofenac, reduced CCR2 mRNA expression and this reduction was statistically significant (1.86-fold ,P=0.01) (Figure 4).
Effect of G2013 on mRNA Expression of CCR5
The results of qRT-PCR indicated that CCR5 mRNA expression in the patients' untreated cells was higher significantly than the healthy control group (2.94-fold, P=0.01). Treatment of the patients' cells with low dose of G2013 (5 μg/mL), could down-regulate CCR5 mRNA expression in these cells, however this difference was not significant statistically (1.8-fold, P=0.06). Treatment of the patients' cells with moderate and high concentration of G2013 (25 and 50 μg/mL) and optimum dose of diclofenac (1μg/mL), reduced CCR5 mRNA expression (2.95, 3.48 and 1.97-fold), and these reductions were statistically significant (P=0.006, 0.005, 0.02 respectively) (Figure 5).
Figure 4 Effect of G2013 on CCR2 gene expression. The relative quantification of genes mRNA was compared versus GAPDH gene mRNA and computed by the 2-ΔΔCt manner. The outcomes represent the mean ± SEM. P-value ≤ 0.05 was supposed as statistically significant. Significant reduction compared to the Untreated group: **P ≤ 0.01.
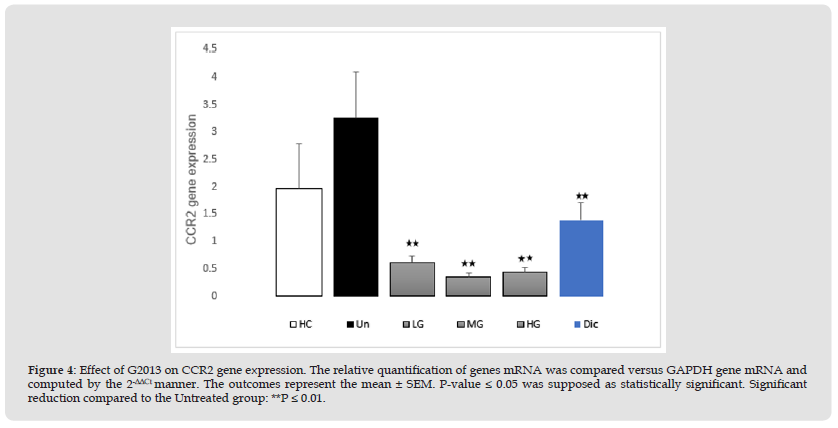
Note: G2013: α-L-Guluronic acid, HC: Healthy control, Un: Untreated patient, LG: Low dose G2013, MG: Moderate dose G2013, HG: High dose G2013,Dic: Diclofenac. RT-PCR; Real-Time Polymerase Chain Reaction, GAPDH: Glyceraldehyde-3-Phosphate Dehydrogenase.
Figure 5 Effect of G2013 on CCR1 gene expression. The relative quantification of genes mRNA was compared versus GAPDH gene mRNA and computed by the 2-ΔΔCt manner. The outcomes represent the mean ± SEM. P-value ≤ 0.05 was supposed as statistically significant. Significant reduction compared to Untreated group: *P ≤ 0.05 and **P ≤ 0.01.
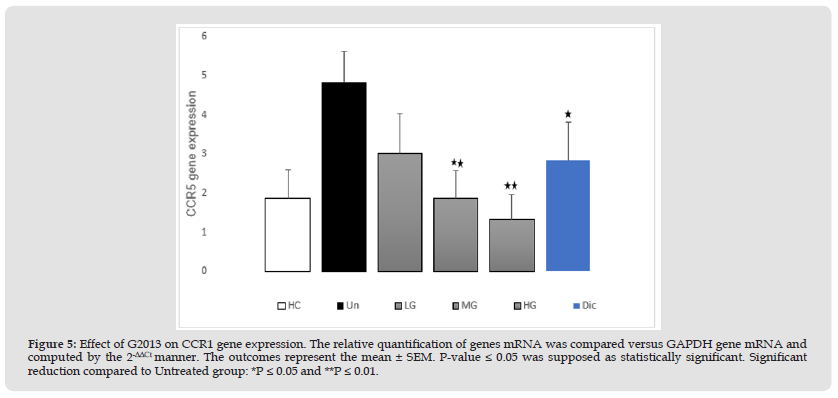
Note: G2013: α-L-Guluronic acid, HC: Healthy control, Un: Untreated patient, LG: Low dose G2013, MG: Moderate dose G2013, HG: High dose G2013,Dic: Diclofenac. RT-PCR; Real-Time Polymerase Chain Reaction, GAPDH: Glyceraldehyde-3-Phosphate Dehydrogenase.
Effects of G2013 on Cell Surface Expression of CCR2
Flow cytometry data illustrated that the expression of CCR2 in PBMCs of SLE patients was higher than the healthy control group, however their difference was not significant statistically (P=0.17). Treatment of the patients' cells with high concentration of G2013 and diclofenac, down-regulated CCR2 in these cells significantly (P=0.028 in both cases). But this reduction was not significantly in low and moderate dose of Guluronate (P=0.23 and 0.18, respectively) (Figure 6).
Figure 6 Effect of G2013 on cell surface expression of CCR2 marker. Cell surface expression of CCR2 was determined after treatment of the cells with PE-labeled Anti- Human CD192 (CCR2) and Mouse IgG2a, k Isotype Ctrl. The outcomes represent the mean ± SEM. P-value ≤ 0.05 was supposed as statistically significant. Significant reduction compared to Untreated group: *P ≤ 0.05.

Note: G2013: α-L-Guluronic acid, HC: Healthy Control, Un: Untreated patient, LG: Low dose G2013, MG: Moderate dose G2013, HG: High dose G2013, Dic: Diclofenac, PE: Phycoerythrin.
G2013 (Guluronic acid) with (C6H10O7) molecular formula and [(2R/3S/4S/5S)-2/3/4/5-tetrahydroxy-6-oxohexanoic acid] IUPAC name, is a small molecule with uronic acid structure. This molecule along with β-D-Mannuronic acid (M2000) are constituent monomers of alginic acid, which this polymer is a natural agent that exists in marine brown algae and as capsular polysaccharide in some bacteria with a wide application in the medicine and food industry [23]. Anti-inflammatory and immunomodulatory properties as well as high safety of Guluronate have been proven in many cellular and animal models and clinical studies [16-25]. Although NSAIDs can cause digestive, renal, and cardiovascular problems, such side effects have not been reported in association with G2013 [18,19,23]. Previous studies indicate the ability of NSAIDs to reduce the expression of chemokine and their receptors. Li Liang et al; 2003, have shown that the daily use of 50 mg/kg celecoxib for 15 days in irradiated skin tissue in mouse model, could significantly diminish the mRNA expression of CXCR4, CCR2, CCR5 and CCL2/MCP-1 [26]. Moreover, Seiji Futagomi, et al. 2010, have investigated the ability and effect of celecoxib on the migration of CD133+ cells in Helicobacter pylori contaminated gerbil. Results showed celecoxib through reduction the cell surface expression of CCR2 in CD133+ cells can limit migration of the cells and consequently reduce the risk of gastric cancer [27].
Furthermore corticosteroids, along with antimalarial agents, are considered as choice drug of SLE [3,14]. It is suggested that one of the anti-inflammatory mechanism of corticosteroids is inhibition of nuclear factor kappa B (NF-κB) and subsequently reduction of the pro-inflammatory gene expression contain cytokines and chemokines [28,29]. Paulus et al; 2013, have reported use of prednisolone in orthotopic lung transplantations (LTX) rat model; downregulated CXCR4 receptor and CCL2 pro-inflammatory molecules and enhanced survival significantly [30]. The results of current study on the one hand, confirm the anti-inflammatory and immunomodulatory properties of G2013 more than before and on the other hand, it agrees with other mentioned studies results. Followed by the treatment of PBMCs with different dose of G2013 our target chemokine receptors gene expression and the cell surface expression of CCR2 were decreased like diclofenac. One of the main signal transduction pathways of SLE disease is MAPK (mitogen-activated protein kinase) pathway that can be activated by phosphorylation in response to extracellular stimuli, such as mitogens, growth factors and cytokines.
It can induce and transactivate transcription factors including, NF-κB which activates cytoplasmic subunits and their migration to the nucleus; subsequently increases expression of the cytokine, chemokine, and leukocyte adhesion molecule genes [31-33]. Although NF-κB is known mainly by inflammatory activity but genes involved have many different immune functions ranging from the development, activation, and differentiation of lymphocytes to the maturation and inflammatory functions of innate immune cells. Several studies in humans and animal models suggest a key role of NF-κB signaling in disease of lupus, in which the activity of the NF-κB in addition to the occurrence of innate immune responses, subsequently in the development of adaptive immune responses, as well as activation, maturation and development of T and B lymphocytes and D.C are involved [31]. The various studies show Guluronate can reduce the expression of the inflammatory NF-κB factor and the mediators and product of the signaling pathway of this inflammatory molecule. Hajivalili et al; 2016, showed treatment of HEK-293 TLR4 cells with G2013 was able to reduce the expression of interleukine-1 receptor associated kinase-1 (IRAK1) and tumor necrosis factor (TNF) receptor associated factor 6 (TRAF6) as NF-κB activation mediator [17].
As well as the study by Sharifi and colleagues, 2017, display that treatment of common variable immune deficiency (CVID) patient PBMCs with G2013 is associated with decreased NF-κB, toll-like receptor 2 (TLR2) and toll-like receptor 4 (TLR4) expression (as one of the NF-κB targeting gene) [24,31]. Furthermore Mortazavi-Jahromi et al; 2018, indicated a significantly decline in expression of the NF-κB, myeloid differentiation primary response 88 (MyD88) and level of IL-1β as a pro-inflammatory cytokine under the influence of G2013 in cell line of HEK293 [21]. Since the chemokine and their receptors as one of the NF-κB targeting gene, have a crucial role in infiltration of immune cells into the inflammatory tissues and intensity of inflammation, therefore, reduction of their expression by decreasing cellular accumulation will probably ameliorate the disease intensity.
The α-L-Guluronic acid (G2013) as a new NSAID with immunomodulatory efficacy which has been passed its phase Ⅰ/Ⅱ clinical trials on RA and AS patients showed potent effect on the reduction of gene expression level of CXCR3, CXCR4, CCR1, CCR2 and CCR5 mRNA expression as well as CCR2 cell surface expression on SLE patients. This novel drug will probably be able to restrict infiltration of the immune cells into the inflamed tissues and reduce disease complications, through the downregulation of these chemokine receptors. It might be able to target active inflammatory pathways in autoimmune diseases such as SLE and ultimately down-regulate the expression of inflammatory genes.
The authors have declared that there is no conflict of interest.
This study was conducted in collaboration with the Department of immunology, School of Public Health, Tehran University of Medical Sciences and with Rheumatology ward of the Loghman Hakim and Emam Khomeini hospitals. We sincerely thank all the professors, doctors, staff, and students who have worked with us during this project.


