info@biomedres.us
+1 (502) 904-2126
One Westbrook Corporate Center, Suite 300, Westchester, IL 60154, USA
Site Map
Received: April 07, 2023; Published: May 01, 2023
*Corresponding author: Adil Khurshaid, Department of Mathematics, University of Swabi, Swabi, KP, Pakistan
DOI: 10.26717/BJSTR.2023.50.007901
In this manuscript, a new approach termed as ”Continous Galerkin-Petrov” is imple- mented to create a mathematical model after the HIV infection that represents the be- havior of uninfected CD4+ T-cells, infected CD4+ T-cells, and free HIV pathogens. Over- all dynamics of healthy, infected CD4+ T-cells and free HIV pathogens are governed by the stream function for CD4+ T-cells replenishment from the thymocytes. We further looked at the impact of several adjustable parameterization on the stream of new CD4+ T-cells in extensive detail. Secondly, the framework is determined using the Runge Kut- ta technique of fourth order (RK-4 method). Finally, the suggested scheme’s reliability and validity are confirmed by analyzing the graphical and numerical results to the re- sults of RK4-method. The numerical and statistical results were compared to the RK4 approach, which indicated that the cGP(2) − method works quite well. In contrast to pre- vious conventional schemes, the consistency and efficiency of the suggested system are mentioned in this research.
Keywords: Azidothymidine; Didanosine; Dideoxycytidine; Anti-Retroviral Thera- py; Cluster of Differentiation 4; Cluster of Differentiation 8; Highly Active Anti-Retroviral Therapy; Continuous Galerkin- Petrov; Finite Element Method; Runge-Kutta Method of Order Four
The human immunodeficiency virus (HIV) targets the immune system. The immune system is the human body’s natural defence mechanism against illnesses. This system has number of biological structures in an organism for defence processes against disease. The main part of the human body defence system in blood cells is known as T-helper cells which destroyed by these viruses. Inside these cells, the virus makes copies by itself. The immune system of a person be totally destroyed due to untreated HIV virus. The HIV virus gradually breaks down person’s immune system by making more copies of itself, as it spiflicate more CD4+ T-cells. This means that without treatment someone that got HIV, find more troubles to fight off diseases and infections. If HIV patient is not given medical care, it may take 7-10 years [1] for the immune system to be so bad- ly spoiled that it can no more support itself in any respect. Breast milk, blood, semen, vaginal and anal fluids are the sources of presence of HIV. The transmission of HIV is not possible by urine, sweat or saliva. The set of symptoms caused by the HIV virus is called acquired immune deficiency syndrome (AIDS). When some people develop spe- cific symptoms and sicknesses, due to weakness of their immune system for fighting against infection are declare to have AIDS. This is the final phase of HIV and will lead to death without treatment. Unfortunately, there is no proper cure for HIV in present. The people effected with HIV can live healthy and long lives by taking treatment aright.
The human body’s innate immunity is a collaboration of several cells and tissues unitedly for supporting of the human body against attacks by extraneous invaders. There are two types of white blood cells that help the regulation of the immune function. One is devel- oped in bone marrow and produce antibodies called B-cells. The other is developed in a small organ in human body known as thymus gland called T-cells, which have respon- sibilities for the variety of some immune reaction. HIV is propagate from chimpanzees to human in early 1900’s. In the midwest, earliest case of AIDS appears in 1968’s. In 1987’s, the first citizen of Pakistan diagnosed with AIDS in Lahor. In Sub-Saharan Africa about twelve million children were effected with AIDS up to end of 2003’s. Numerous analogues for the body’s immune system have already been developed in recent years, and substantial investigation has been undertaken in the domain of HIV infection of CD4+ T-cells to comprehend HIV dynamical behavior, transmission, disease concatena- tion, as well as the immune system’s relationship with HIV. The destruction of CD4+ T-cells, which are required for the control of the human immune system, is one of the greatest havocs caused by HIV. As a result, the decrease in the number of these cells is employed as a main indication to track HIV epidemic concatenation and AIDS stages. Such cells generate at a steady pace from bone marrow and thymus precursors. Un- fortunately, there is currently no treatment for this contagious condition.
Now a days, the mathematical modeling have been used for understanding the transmitting of in- fectious diseases. The practise and theory of disease prevention and management are increasingly influenced by mathematical models for the transmission of infectious illnesses [1-8]. For uninfected T-cells and free virions, Ogunlaran, et al. [9] used a mathematical model with two control variables: the logistic growth function and the incidence term sequentially. The investigators looked at how effective medication interventions are at stopping new cells from becoming infected and prevent- ing the production of new free virus. They demonstrated the efficacy of the framework by reducing the accumulation of infected cells and free virus particles even while ex- panding the accumulation of healthy T-cells inside the internal organs with a minimal intake of combined drug therapies in order to alert the negative consequences associat-ed with excessive use of drug treatment. The powerful antiviral drugs are the hope of healthy life for the person effected by HIV virus. Coffin, et al. [10] examined long-term modification in virus load in an effected person dosed by the compounding of potent an- tiviral drugs lamivudine and zidovudine. Nowak, et al. [11] studied the function of body defence system for restricting virus and vary the drug immunity of virus load. Culshaw [12] incorporate a time delay into their mathematical model for reporting the time interval among viral infection of CD4+ T-cells and viruses fragment production from the patient’s psyche on a molecular level.
For finding of suitable conditions about the criterions in the framework for the innate and adaptive immunity steady states’ durability the Song [2] used the simple model with saturation response. Perelson [13] examined how dynamical modelling and parameter estimation methodologies have revealed significant aspects of HIV pathophysiology. The number of CD4+ T-cells in a typical person is estimated to be approximately 1000mm−3 [13]. The name of T-helper cells given to the CD4+ T-cells is because the major function of these T-cells is to transmit information towards other monocytes in order to regulate the body’s defensive mech- anism. As HIV infection progresses, the number of these cells decline. The CD4+ T- cells counts is 800 to 1200 mm−3 of those people which shows HIV negative [4]. When CD4+ T-cells calculate 200mm−3 or more below in a patient infected by HIV, then that person is sort to having AIDS [13]. Kumar, et al. [14] examined a dynamical mathematical model of HIV for understanding the infection of T-helper cells in human body. Boer, et al. [15] discussed a model which consist four components for the interacting of CD4+ T-cells and HIV virus. They developed estimations for changing at early time in which HIV virus particles binds to T-cells rapidly. Kirschner, et al. [16] introduced chemother- apy technique for an early treatment by using dynamic treatment. Bonhoeffer, et al. [11] discussed the incipient understanding of the dynamics of virus population. They al- so discussed the function of the body defence system in limiting virus abundance and changing of viral drug immunity.
Nowak, et al. [17] uses a simple mathematical tech- nique to explore the connection amongst antimicrobial immune responses, viral variety, and infectious strain. The potential of transmission of any disease in the human body is measured by a number known as the basic reproduction rate represented by R0. This reproduction number actually make a ratio of infection of healthy cells due to infected one. The mathematical models gives us very significant details about the HIV virus re- search. The linearity of the reproduction rate in all mathematical models demonstrates the efficiency of the participation between T-helper cells and HIV pathogens. Zhou, et al. [1] discussed the CD4+ T-cells infected by HIV virus by using crowley-martin function response. They discussed some properties of basic reproduction number. Zhou, et al. [7] discussed the differential equation model including cure rates. By using the char- acteristics of fundamental reproduction number R0, they showed that if R0 < 1 is used, the HIV virus infection is cleared and the sickness is eradicated, the infection of HIV virus remain in human body if R0 > 1. They found that the usual disease steady state is globally asymptotically stable if R0 >1.
There are a number of complex problems arising in the real world. These problems can be modeled in the language of mathematics. These problems can be defined by nonlinear ordinary differential equations (ODE’s). The importance of model increases as it gives best results having many variables. The variation of infection rate by HIV shows that the body defence system of the patient is the main target of HIV. The patient with strong immune system can survive more effectively against HIV. In other way, the patient with weak immune system can not survive against HIV for long period. This section discusses Zhou’s, et al. [7] suggested model, which comprises of non-linear differential equations. In the model, the total population is divided into three compartments. These are uninfected T-cells, infected T-cells and HIV virus particals. Let T(t), V(t) and I(t) be the population of healthy T-cells, free viruses and infected T-cells at time t respectively. The non-linear system of equations of the proposed model [7] are :
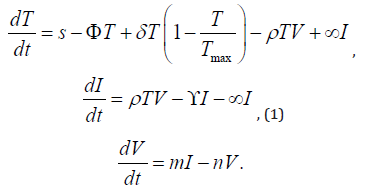
The continuous source term for the delivery of fresh T-cells is
represented by the parameter ’s’. It is an indicator of how quickly the
thymus as well as bone marrow gen- erates healthy T-cells [8]. The ϕ
stands for the concentration of functional T-cells that die after being
created by the body system. The letter ρTV represents the rate of dormant
HIV infection in functional CD4+ T-cells. The infectious reaction
rate is denoted by ρ. The δ stands for the maximum rate of intended
cell proliferation, Tmax stands for the T concentration of people upon
which cell escalation stops, γ stands for the death rate of infectious
damage cells, m stands for the rate of infection cell reproduction, n
stands for the rate of viral clearance, and α stands for the rate of curative
treatment. (Table 1) lists the general system characteristics and
indicators that were used in the creation of the framework. About the
availability of fresh functional T-cells, Zhou, et al. [7] evaluated the HIV
prototype with a constant variable stream function. HIV has the potential
to contami- nate T-cells as soon as they enter the human body,
which causes a decline in the number of young, functional T-cells [15].
For the purpose of providing new unaffected T-cells from the thymus,
Boer, et al. [15] adopted an HIV model with changing source terms.
Kirschner [3] and Webb, et al. [18] assume about the source phrase
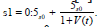 s +V t The source term employed by Perelson, et al. [15] is
 where θ is constant. If V = 0, s2 will stay the same and
would be cut in half if the viral load V(t) increased to the point θ .
Perelson, et al. [4] anticipated
where θ is constant. If V = 0, s2 will stay the same and
would be cut in half if the viral load V(t) increased to the point θ .
Perelson, et al. [4] anticipated 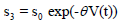 as the source of the
word. The HIV model with source termsimilar to that employed in
the Perelson, et al. [15] model with θ =1 is also taken into consideration
by (Kirschner, et al. [16]), Hermandes [19], Butler, et al. [5].
The primary goals of the current study are to investigate Zhou’s, et
al. [7] model using all of the parameterization for the production of
new cells indicated above. The dynamical behaviors of uninfected
T-cells, free HIV virus particles, and infected T-cells will be explored
in relation to the impact of fluctuation in the value of various clinical
parameters. Arrangements can be obtained by employing the consistent
Galerkin-Petrov technique. Runge Kutta technique of order four
(RK-4) will also be used to obtain numrical solutions of the proposed
model. A computer programme created in MATLAB will be used to
calculate all the findings. To better comprehend the implications of
multiple source terms, graphical outcomes will be shown.
as the source of the
word. The HIV model with source termsimilar to that employed in
the Perelson, et al. [15] model with θ =1 is also taken into consideration
by (Kirschner, et al. [16]), Hermandes [19], Butler, et al. [5].
The primary goals of the current study are to investigate Zhou’s, et
al. [7] model using all of the parameterization for the production of
new cells indicated above. The dynamical behaviors of uninfected
T-cells, free HIV virus particles, and infected T-cells will be explored
in relation to the impact of fluctuation in the value of various clinical
parameters. Arrangements can be obtained by employing the consistent
Galerkin-Petrov technique. Runge Kutta technique of order four
(RK-4) will also be used to obtain numrical solutions of the proposed
model. A computer programme created in MATLAB will be used to
calculate all the findings. To better comprehend the implications of
multiple source terms, graphical outcomes will be shown.
The Steady States [6,8]
In the real problem system in mathematical model, if variables which are using in the model do not show any variation with respect to time duration, then this system is in steady state. In a mathematical model, the untreated and diseased steady states are the two basic types of steady conditions.
Uninfected Steady State
If the human body shows no virus present in it and not any infected CD4+ T-cells present in it, this state is known as uninfected steady state. The virus presence in uninfected steady state in any human is zero. In the studying model for uninfected steady state, T = T0, I = 0 and V = 0. We calculate the uninfected steady state T0 for the studying model given above as:
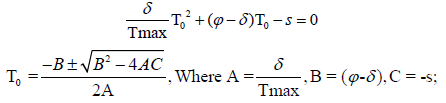
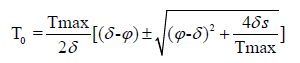
By using quadratic formula we calculate the uninfected steady state T0 i.e.,
Infected Steady State
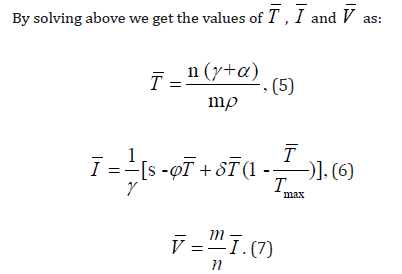
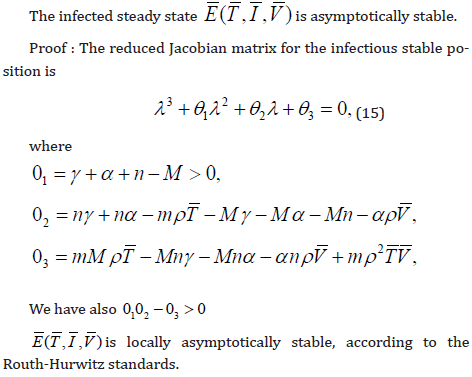
If the human body shows virus and infected CD4+ T-cells present in it, this state is known as infected steady state [20]. By putting T=¯T, I=¯I and V=¯V in the under discussion model we find out the values of

For positive infected stable state  we examine local stability
by utilizing Routh-
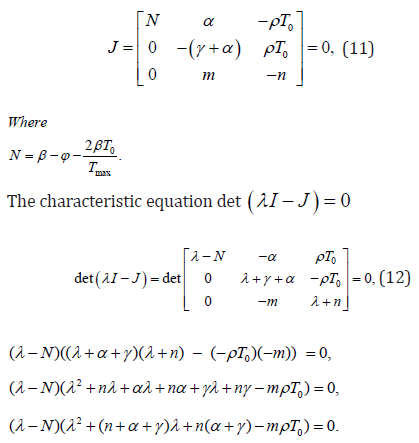
Hurwitz standards [12]. First we find the jacobin matrix. For this
the jacobin matrix J is
we examine local stability
by utilizing Routh-
Hurwitz standards [12]. First we find the jacobin matrix. For this
the jacobin matrix J is
the characteristic equation of linearized system is :
The equation 10 under discussion have negative real parts for all of its eigne values iff [12], K1 > 0 , K2 > 0 , K1K2 − K3 > 0.
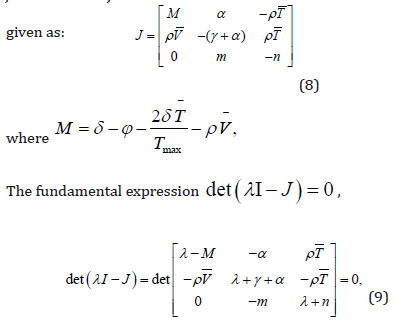
For positive infected steady state E0 (T0,0,0) ,we examine local stability by using Routh- Hurwitz standards [12]. First we find the jacobin matrix. For this the jacobin matrix J is given as:
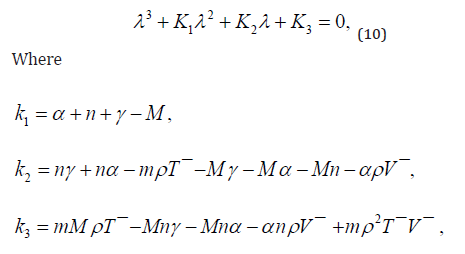
For linearized system of equations, the characteristics equation is:
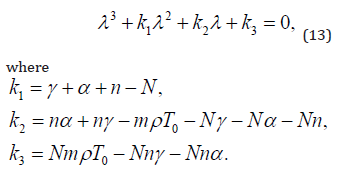
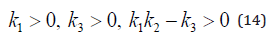
The equation 13 under discussion have negative real parts for all of its eigne values iff [12],
The reproduction ratio is quite smaller in model [7] with cure
rate. Due to this, it is easy to control the disease and also decrease
the infection speed of new HIV virus. The reproduction ratio is quite
larger in model [7] without cure rate. Due to this, it is not easy to
control the disease and also increase the infection speed of HIV virus.
We demonstrate that the fundamental reproduction number R0
can generates a comprehensive prescription of the model [7] global
interactions. According to the framework’s fundamental reproduction
number 0 R ,the equilibrium of the proposed infectious model
is asymptotically stable if R0 <1, and On the other side, the pandemic
model’s equilibrium has a special endemic equilibrium if 0 R >1,and is
likewise globally asymptotically stable. The model under discussion
[7] have  where
where
 ,
without cure rate and be with
cure rate, this modified as
,
without cure rate and be with
cure rate, this modified as  where
where
 The comparison
of the model with and without cure rate demonstrates that when
compared to models lacking cure rates, the virus’s rate of infection is
extremely sluggish. Therefore, the prototype with the highest treatment
regimen will be preferred.
The comparison
of the model with and without cure rate demonstrates that when
compared to models lacking cure rates, the virus’s rate of infection is
extremely sluggish. Therefore, the prototype with the highest treatment
regimen will be preferred.
Theorem 1. Suppose that
Theorem 2. System 1 is a competitive system. Proof: For the system of equation [7], taking the matrix L as:
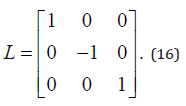
To defining partial order by the orthant, this system is competitive in D.
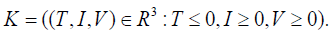
We obtained with the fact of simple calculation,
Due to convexity of D, this system is competitive in D. In view of this Poincare-Bendixson property is satisfied by the system.
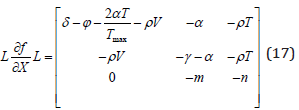
The HIV model’s system of ordinary differential equations could
be characterised as:
Take into account a time period = [0,T ]with an ultimate time T
that is positive.We find
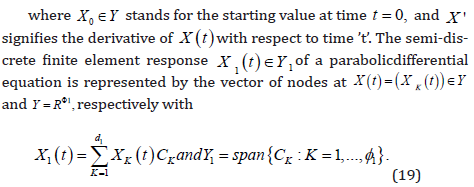
The assumption is that the function F : L ×Y →Y is sufficiently
smooth which can be nonlinear.
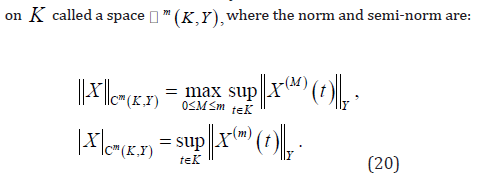
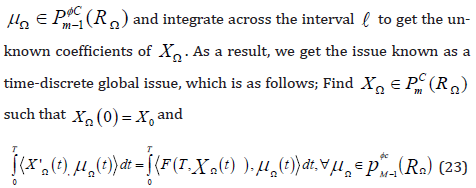
To express the temporal discretization of the issue [18], we now
initiate the following syllabaries. We select a subinterval K ⊂ L to describe
the steadiness of the function t → X (t ).We take into consideration
a set of m times continuously differentiable Y -valued functions
Now, we obtain the collection of subintervals by dividing time interval
 into N subintervals
  , which is known as the
time-mesh R . Ω We use the time discretization parameter represented
by the maximal time step size Ω , where
, which is known as the
time-mesh R . Ω We use the time discretization parameter represented
by the maximal time step size Ω , where
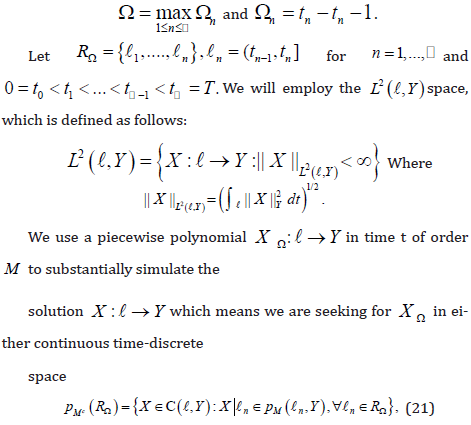
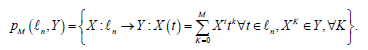
or in discontinuous time-discrete space

where is a space of polynomials in time t with vector values of order M, i.e.,
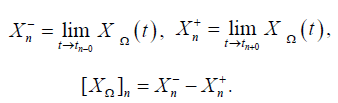
For discrete function X : →Y, that are discontinuous at the end points of time intervals, we define the left-sided and right-sided values X n− n and X n+ as well as the jump [X Ω]n respectively:
Moreover, we define the function values  with n ≥1 on
the interval
with n ≥1 on
the interval 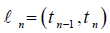 will be
 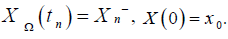 . Here, we employ the space
  as a time-discrete solution space
and the space
as a time-discrete solution space
and the space  as a discrete test space. The discrete solution XΩ has .M many undetermined degrees of freedom due
to the beginning circumstances in Equation (18), and the test space
size is also .M .We multiply Equation (18) by the test function
as a discrete test space. The discrete solution XΩ has .M many undetermined degrees of freedom due
to the beginning circumstances in Equation (18), and the test space
size is also .M .We multiply Equation (18) by the test function
with  denoting the usual inner product in
  .The precise
continuous Galerkin- Petrov technique of order M, also known
as the exact cGP(K)− method, will be used to refer to this discretization.
The test space
.The precise
continuous Galerkin- Petrov technique of order M, also known
as the exact cGP(K)− method, will be used to refer to this discretization.
The test space  differs from the ansatz space
  ,therefore earning the moniker Galerkin-Petrov. Exact
refers to precisely evaluating the integral on the right side of issue
(23). Since space is discontinuous, the problem (23) can be
solved by a time marching process where successively local problems
on the time intervals are solved. For this purpose, we select a test function
,therefore earning the moniker Galerkin-Petrov. Exact
refers to precisely evaluating the integral on the right side of issue
(23). Since space is discontinuous, the problem (23) can be
solved by a time marching process where successively local problems
on the time intervals are solved. For this purpose, we select a test function
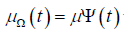 with an arbitrary time independentμ ∈Y and
  , a scalar function which becomes zero on
 and a polynomial
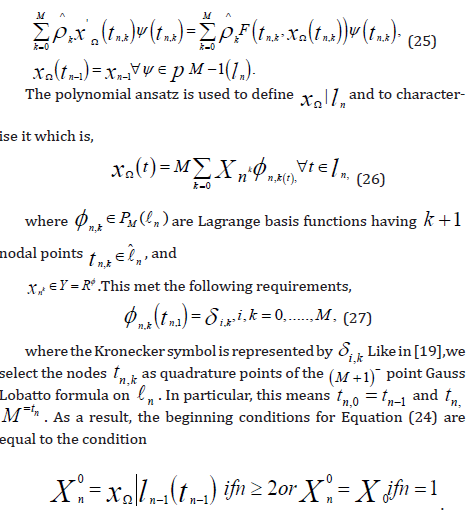
of orderless than or equal to M −1on . ln Then, from problem(23), we get ln− problem of exact cGP(K)− method, i.e., Find
and a polynomial
of orderless than or equal to M −1on . ln Then, from problem(23), we get ln− problem of exact cGP(K)− method, i.e., Find
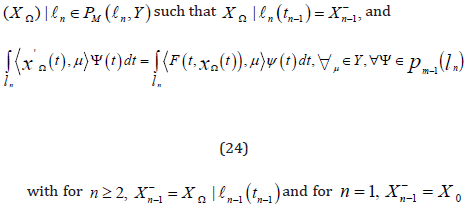
We numerically estimate the integrals on the right side of Equation
(24) for non-linear functions. If the integrated function is a polynomial
with degree less than or equal to 2M −1,the (M +1)− point Gauss
Lobatto formula is accurate. In order to obtain the precise value, we
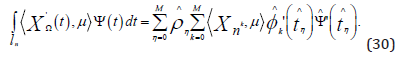
apply this formula to the left side of Equation (24). Now, we take reference
interval  .Denote the associated weights and nodes
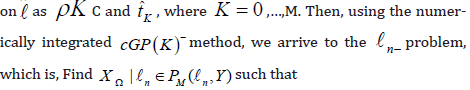
At this point, we use an affine reference transformation to define

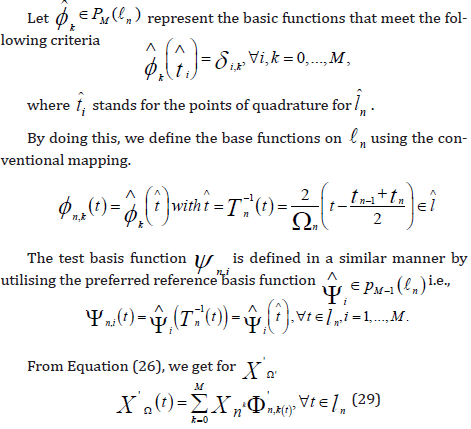
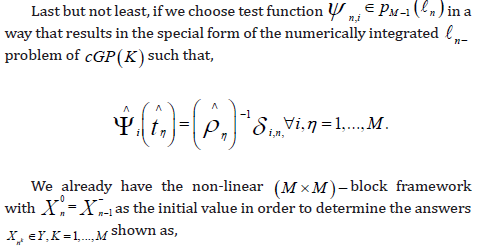
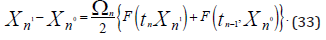
This results in the following formula for each test basis function ψ and∀μ ∈Y ,

cGP(1) −Method
The Trapezoidal rule is produced by applying the two-point
Gauss-Lobatto formula with the weights  and the quadrature points
  Then, we acquire
 .
The solution to this issue yields the block-equation shown below,
where coefficient
.
The solution to this issue yields the block-equation shown below,
where coefficient 
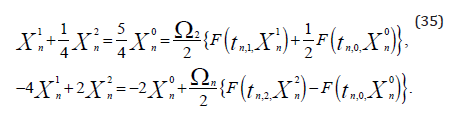
cGP(2)-Method
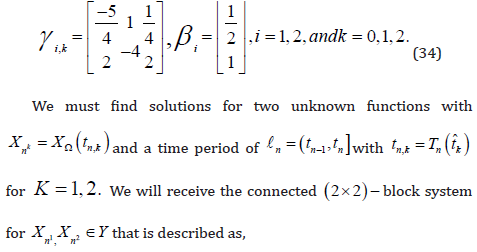
Now,we utilise the Three-point Gauss-Lobatto algorithm to get
the Simpson’s rule using the weights  and the
quadrature points
and the
quadrature points 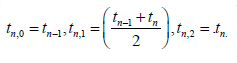 The
coefficients were then computed as,
The
coefficients were then computed as,
In this research paper, we obtained the results of the model [7] by using the cGP(2)− method and demonstrate the results graphically and numerically. The detailed values of different parameters used in the model are discussed in the (Table 1). We graphically depict the variations in the population of healthy T-cells, infectious T-cells, and free HIV pathogens with constant and varied variable source terms. The graphic findings of T(t), I(t) and V(t) demonstrate decaying oscillatory behaviour with somewhat different population dynamics employing variable and invariant source terms. (Figure 1) shows the effects of variable source term on healthy CD4+ T-cells. It is obvious that populace flow of healthy CD4+ T-cells changes with the change of invariant source terms. From the (Figure 1), It is clear that populace flow of T-cells of source term s3 appears significantly different from source terms s0, s1 and s2 throughout the time period. Similar behaviour is seen for the population dynamics of infected T-cells and free HIV virus particles in (Figures 2 & 3) respectively, whenever these source terms are impacted.
Table 1: An overview of the model’s parameters, variables, and their values.

Figure 1

Figure 2

Figure 3

Figure 4

Figure 5

Figure 6

For the verification of results, we also find solution by using RK-4 method graphically and numerically [23]. It is seen that results obtained from both methods, cGP(2)− method and RK-4 method, are in great interest with each other (Tables 2 & 3). From comparison it is observe that, for the model compared to existing approaches, including HPM [24], LADM [25,26], MVIM [21], VIM [22], the suggested method yields findings which are highly consistent. We illustrate the results of both methods graphically through (Figures 4-6). The graphical results are over lapping and this leads to the accuracy of cGP(2)− method [27]. Results depicted in (Figures 4-6) shows that cGP(2) method and classical RK-4 method are in great agreement [28-30]. These findings suggest that the cGP(2)− method should properly forecast how these variables would behave in the region under consideration [31,32].
Table 2: Results of cGP(2) for T(t), I(t) and V(t).

Table 3: Results of RK4 method for T(t), I(t) and V(t).

In this manuscript, the cGP(2)− technique is being used to give the numerical results of a comprehensive framework for HIV infection of healthy T-cells. Researchers wanted to know how the availability of fresh, competent T-cells from the thymus would affect the HIV infection prototype, both in terms of constant and varied changeable source terms [33,34]. The analysis showed that the interaction of healthy T-cells, infected T-cells, and free HIV virus particles communicate in a dulled fluctuating way for all types of source terms during the time frame, although their population rates only undergo minor variations. Regarding source term s3, there is a dramatic shift in T(t), I(t) and V(t) absorption over time duration, but for other source terms, the dynamical behaviour is almost the same at first and then modifications only become visible subsequently. Throughout the phase diagram, all of the source terms initially have complexities that are comparable to one another, but their population dynamics diverge from one another over time duration. On the other side, we used the RK4-method to solve the problem and have quantified comparisons of the T(t), I(t) and V(t) solutions generated by utilising cGP(2)− method, RK4-method, and other traditional approaches. Last but not least, we represented the numerical curves produced by the cGP(2)− method and RK4-method. We find it noteworthy that, when compared to other approaches utilised for the HIV infection framework, the effectiveness of the cGP(2)− method and the RK4-method is almost the same.


