info@biomedres.us
+1 (502) 904-2126
One Westbrook Corporate Center, Suite 300, Westchester, IL 60154, USA
Site Map
Received: February 25, 2023; Published: March 09, 2023
*Corresponding author: Ihor Zanevskyy, Lviv State University of Physical Culture, Kostyushka str. 11, Lviv 79007, Ukraine Copyright@
DOI: 10.26717/BJSTR.2023.49.007760
Background: Ruffier test and corresponding Ruffier index of resistance of a heart to an effort are rather popular in sports, physical education, rehabilitation etc. From the very beginning of the academic year 2009-2010, Ruffier test was introduced in Ukraine as a formal method of classification into the categories of a health status of 6-16 years old pupils. According to these categories, a program of physical education lessons was corrected. As a result of this, a great part of pupils (somewhere more than a half) appeared according to the program in the weakest (named ‘special’) group with a nominal (near zero) level of physical activity. Even some young sportsmen were “condemned” to a special group according to results of Ruffier test. Teachers of physical education, pupils, and parents need an explanation of the problem and a way of its solution. The aim of this research was to create a method of health assessment of 6-16 years old patients using Ruffier test.
Materials and Methods: Mathematical modeling and computer simulation were used in the research. Inter- and extrapolations of assessment scales based on Ruffier index were employed. Calculations were done using MS Excel and MathCAD computer programs.
Results: It was shown that two well-known models of correction of Ruffier test to the age of young patients are conflicting one to another and are not reliable in physical fitness. Two methods of adaptation of Ruffier test assessment for the health status of young patients were proposed. In one of the methods, a value of Ruffier index was corrected and in another method a scale of assessment was. In general, the proposed model of correction of the test assessment coursed a statistically significant (р < 0.001) difference with a corresponding result determined according to the original model. The results of this correction showed a considerable increase of a basic group of physical education (in 49-53%) and decrease of a preparation course group (in 11-15%) and a special group (in 37-39%).
Conclusion: A normal value of the heart rate in rest should be used as a parameter of correction of Ruffier index. A corrected value of Ruffier index in the practice of physical education could be calculated using a proposed age correction coefficient.
Keywords: Heart Rate; Ruffier Test; Physical Education; Pupils; Modeling
Ruffier test and a corresponding Ruffier index (or Ruffier-Dickson index) of resistance of a heart to an effort are rather popular in sports [1], physical education [2], rehabilitation [3] etc. Thanks to this test, Dr. Ruffier was recognised as a founder of sports medicine in the middle of 20th century. There is a common opinion that the test is simple, with no major cardiac risk, requiring the physician a little equipment, easily reproducible (see, for example, the Institut Régional du Bien-être de la Médecine et du Sport santé en Nord Pas-de-Calais [www.irbms.com/test-de-ruffier-dickson]). They declare the test as feasible at the age of 10/12 years. From the very beginning of the academic year 2009-2010, according to Principle [4] Ruffier test was introduced in Ukraine as a formal method of classification into the categories of a health status of 6-16 years old pupils. According to these categories, a program of physical education lessons was corrected. As a result of this, a great part of pupils (somewhere more than a half) appeared according to the program in the weakest (named ‘special’) group with a nominal (near zero) level of physical activity. Even some young sportsmen were “condemned” to a special group according to results of Ruffier test. Teachers of physical education, pupils, and parents need an explanation of the problem and a way of its solution.
Principle [4] directs Ruffier test in its classical form when a value of the corresponding index is calculated as followed:
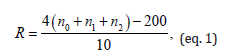
Where n0 is a number of heart beats during 15 s at rest, n1 is a number of beats during 15 s just after the end of the effort (30 squats during 45 s), and n2 is a number of beats during 15 s in 45 s after the end of the effort. Dr. Ruffier estimated the total of three heart rates at rest for adult near 200. Principle [4] defines index values of a special group equalled 10 and greater. For example, a 6 years old pupil with a normal heart rate about 102 beats per minute gets a value of the index greater than 10.6 and appears in a special group. The cause of the weak children’s results according to Ruffier test was in using of a classical test procedure and an assessment scale constructed for adults. Healthy children have a greater heart rate than adults. From birth to 16 years, a normal heart rate decreases about 1.5 times [5].
Three methods have been proposed with the aim to account an age in Ruffier test. According to a first of them, the effort for children should be decreased from 30 to 20 squats [6]. There are two difficulties of applying of this method to solve the problem. At the first, this method does not define an essential model of correlation between the effort and the age. At the second, Principle [4] prescribed just 30 squats as an effort. A differential correction of the index value was proposed with a second method by Dykhan [7]. According to this method a calculative value of the index (eq.1) should be increased in 1 or 2 points or decreased in 1 to 5 points corresponding to the age. But this method is not sufficiently acceptable because the increase of index values with using a classic scale of assessment (assigned for adults) makes pupils’ scores for a certain age (10-16 years old) more bad, i.e. far from reality.
According to a third method [8], Ruffier index boarders between the health levels in the original table of assessment for adults were increased in 1.5-6.0 points proportionally to the age of 7-15 (and more) years. The idea of the method was quite reasonable and showed a way to solve a problem of taking into account an age of young patients. Values of Ruffier index (eq.1) should be assessed to a higher level as more as a patient is younger. Corresponding values of boarders for 6 and 16-17 years old children could be calculated using a linear interpolation. But there are two weak features in the method. For the first, Ruffier index was calculated basing on a heart rate, but the correction of boarders’ values according to this method was grounded on an age. The question is: whether a heart rate is inversely proportional to an age in the range of 7-15 years old patients? For the second, why the range of the index points was chosen equal of 6 points? The aim of the research was to create a method of assessment of a health level of 6-16 years old patients using Ruffier test.
No patients were involved in the research. Pupils’ results of Ruffier test were retrieved as internet data in official web-sides [4,6,7,9]. Mathematical modeling and computer simulation were used in the research. Inter- and extrapolations of assessment scales based on Ruffier index were employed. Calculations were done using MS Excel and MathCAD computer programs. In the models of pupils’ health assessment a normal distribution was employed and Excel functions NORMSDIST and NORMINV were used. Pearson chi-square test was applied and Excel function CHIDIST was used in the analysis of the statistical hypotheses about an existence of a common general totality regarding two samples determined according to the models of pupils’ distribution in levels of health and in groups of physical education lessons. Correlations of a heart rate and Ruffier index vs. age were modeled applying algebraic polynomials. Their coefficients were calculated as a solution of linear system of equations using ‘lsolve’ function of MathCAD.
There were designed two methods of adaptation of Ruffier test for the health status assessment of patients of 6-16 years old. Values of Ruffier index were corrected with one of the methods and a table of assessment was corrected with another one. A normal value of a heart rate at rest was accepted as a parameter of correction in these both models. The idea of the first method was borrowed from the model of Ruffier index proposed by Dykhan [7] and the second – by (Guseva [8]).
A Model of Correction of Ruffier Index
At rest, a normal heart rate of children is greater and their reaction to efforts is fever than in adults’ reaction [6]. Therefore, as a first estimation, someone can accept a proportional correlation between a heart rate at rest and after effort in any age. Therefore a corrected formula of Ruffier index was derived as followed:
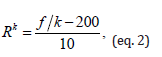
Where
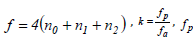
where HR is a heart rate at rest, A is an age measured in years.
Correspondingly to the model (eq.2), a linear nomogram in the range of a heart rate of the patients of 6-16 years old is presented in (Figure 1). It is easily to notice, that for an average value of a sum of heart beats ( is marked with a vertical interrupted line with abscissa equaled 300) patients of 6-8 years old should be assessed to a ‘high level’ of health (Rk = 0.6 − 2.6), 10 years old – to a ‘good’ level (Rk = 5.0) , 12-14 years old – to an ‘average’ level (Rk = 7.1− 9.0) , and patients of 16 and greater years old – to a ‘passable’ level of health (Rk = 10.0) . Someone can read corrected values of the index in the points of crossing horizontal interrupted lines and ordinate. According to the Principle [4], a value of Ruffier index was determined equaled 10, which could be accepted for the age group of 16 years old and older. Using the classical formula (eq.1) directed with the Principle, someone can get only one level of the health assessment for all the ages, i.e. a ‘lower than average’ that means a ‘special’ group of physical education lessons.
Figure 1 Nomogram of Ruffier index.

Comparative analysis of the model of correction (eq.2) with a model by Dykhan [7] showed a substantial difference of results. For example, when Ruffier index equals 10 points (a critical value for adult) a sum of values of a heart rate (in rest, just after the end of the effort, and in 45 s after the end of effort) by the formula (eq.1) is calculated equaled 300. Relative difference between Ruffier index values according to these two models was estimated with the followed formula:
where RD is a value of Ruffier index corrected according to Dykhan model [7]. Corresponding data values for the young patients of 6-16 years old showed a substantial differences between these models in the range of 35

A Model of Correction of a Scale of Assessment
Using equations (eq.1) and (eq.2), a correlation between values of Ruffier index boarders between health levels in the classical form and corrected form was derived as an equation below:
where Rp is a values of Ruffier index in a corrected form (for the young patient), Ra is a value of Ruffier index in a classical form (for adults).
A nomogram that shows a correlation between values of Ruffier index boarders between the health levels is presented in (Figure 2). Using the nomogram, someone can determine boarder values between the levels of health from lowest to highest. For example, when a patient is 10 years old, draw a vertical with abscissa 10 (interrupted line). In the points of crossing with nomogram lines (continuous), follow horizontal lines (interrupted) to crossing with ordinate and read the boarders’ values. A nomogram clearly shows a decrease of boarders’ values vs. an increase of patient’s age. Exact values of the boarders depending to the age with a step of one year according to the equation (eq.5) are presented in (Table 1). For example, if a patient is 10 years old, a normal heart rate in rest is 84 min-1, therefore . Equation (eq. 5) returns values as follow: Rp = 21.4,15.4,11.8, and 8.2. Corresponding boarder values between the levels of health according to Principle [4] are: Ra = 14.5,9.5,6.5, a R = and 3.5 (see a bottom row in (Table 1)).
Figure 2 Nomogram of corrected values of boarders between levels of health.

Table 1: Health level assessment: 1 – low, 2 – passable, 3 – average, 4 – good, 5 – high.

Distribution of Pupils in Levels of Health
Basing on a methods of evaluation of human motion,[10] someone can accept a normal distribution of Ruffier index values. The range M ± 2SD of its value covers the internal of the levels of health assessment from ‘lower than average’ to ‘higher than average” that puts together 95% of all the patients. According to Principle [4], these boarders equal 3.5 and 14.5, that leads to the values of statistical parameters: M = 0.9, SD = 2.75 . Therefore, a normal distribution of patients in the levels of health should be like this: a high level – 2.3%, a higher than average – 15.9%, an average – 39.0%, a lower than average – 40.5%, and a low – 2.3% (Table 2). A ‘basic group’ of health is formed with the first and second levels together (18.2%), a ‘preparation course group’ – with average health level pupils (39.0%), and a ‘special group’ – with a fourth and fifth together (42.8%). A similar distribution of pupils in groups of the physical education lessons was noticed from the very beginning of academic year 2009-2010 in Zaporizha, a million industrial city in South Ukraine [9].
Near 12% of pupils were allowed to a basic group. If to take into account pupils which were not allowed to a ‘basic group’ according to other than Ruffier test results (especially, other medical prescriptions – about 6-7%), the distribution will meet a normal curve rather well. Using correction of Ruffier index values according to the equation (eq. 4) with an average value of heart rate ( f = 300) someone can determine for the pupils’ age from 6 to 16 years a range of index values in 0.5-10.0 and the mean value equalled Rk = 5.25 point, which is smaller in 4.75 points than the adult’s one (Ra =10) . Accepting a hypothesis of a normal distribution and using corrected statistical parameters (M = 9.0 − 4.75 = 4.25, SD = 2.75) , someone can get a distribution corrected to the age of pupils according to the levels of health: a high level – 29.3%, a higher than average – 41.5%, an average – 24.2%, a lower than average – 5.1%, and a low level – 0.03% (see (Table 2)). Therefore, in a ‘basic group’ of health appeared 70.7% and in a ‘special group’ – 5.1% of pupils.
Table 2: Distribution of pupils in the levels of health, %.

A “tragic picture” of the pupils health reflected by the instruction from Principle [4] became to a “normal picture” when the proposed model of correction regarding to an age (eq.5) was applied. A substantial difference between these two models had a considerable statistical confirmation. For example, a typical school has about 600 pupils in 11 pairs of classes. A zero statistical hypothesis about a common general totality regarding two samples appropriated to the models should be rejected with a high level of significance χ2 = 406, ν = 19, p < 0.001 .A similar result was given regarding to a distribution of pupils into the groups of physical education lessons: χ2 = 385, ν = 11, p < 0.001 . With a purpose to study a character of changing of the distribution of pupils in the levels of health and groups of physical education coursed by accompanied Ruffier index values correction, an average pupils’ age of 11 years old was taken into consideration.
Ruffier index boarders of the levels of health for this age are 6.9, 10.3, 13.7, and 19.4 (see (Table 1)) and corresponding normal distribution of pupils is: a high level – 21.8%, a higher than average – 46.2%, an average – 27.7%, a lower than average – 4.3%, and a low level – 0.01% (see (Table 2)). There are 68.0% of patients in a ‘basic group’ of health and 4.3% – in a ‘special group’. For the example of the school has been considered (n =600), a statistical hypothesis about a similarity of distributions in levels of health according to Principle [4] and to the model of the correction (see (Table 1)) should be rejected with a high level of significance: χ2 = 384, ν = 19, p < 0.001. A similar result was given regarding to a distribution of pupils into the groups of physical education lessons: χ2 = 373, ν = 11, p < 0.001 . On contrary, models of correction (eq.2) and (Table 1) showed sufficiently similar distribution and for the levels of health ( χ2 = 10, ν = 19, p > 0.9), and for the groups of physical education lessons ( χ2 = 2.14, ν = 11, p > 0.99) .
A corrected distribution of the health level does not contradict results of medical studies that are quite sensible. Therefore, there are no reasons to reject Ruffier test as a method of assessment of pupils’ health level regarding to physical education lessons, but the test should be modified accounting to a normal heart rate proper to the age of a young patient like it has been done over. A corrected value of Ruffier index in the practice of physical education could be proposed calculate using the followed formula:
where C is an age correction coefficient. A value of the coefficient is smaller while a value of age is smaller (Table 3). For the age of 16 years old, the value of the coefficient meets a number 4 and formula (eq.6) becomes to the classical formula (eq.1).
Table 3: Age correction coefficient in Ruffie rindex formula (eq. 6).

In general, the proposed model of correction of Ruffier test assessment of pupils’ health courses statistically significant difference with corresponding results determined according to Principle [4]. The results of corrections showed a considerable increase (in 49-53%) of a ‘basic group’ of physical education and decrease of a ‘preparation course group’ (in 11-15%) and a ‘special group’ (in 37-39%).
Comparison of Two Models of Correction [7,8]
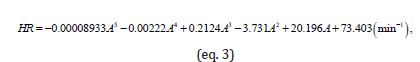
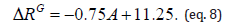
Because two different ways of correction were employed in these models (reducing the index values in the first model and multiplication of an evaluation scale in the second), it is necessary to convert one to another. The idea of the conversion was based on opposite results of correction multiplication or reducing of Ruffier index values and corresponding manipulation with a scale of assessment. The second model was converting to the first. An approximation function of the age correction of Ruffier index by Dykhan [7] was derived using an algebraic polynomial of third order (because four intervals were used in the model) as followed:
Because a constant reduction relatively an age, a linear function of correction of Ruffier index in a converted model by Gusela [8] was derived as follow:
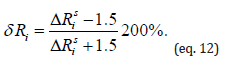
As a quantity measure of the difference of these models a relative parameter presented by the equation below was used:
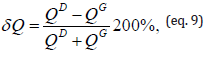
where
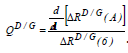
Reliability of the Model of Assessment by (Guseva [8]).
A bottom value of Ruffier index corresponding to an average health level of 15 years old (and older) patients equals 10 points. According to the model by Guseva [8], it is increased to 11.5 for the patients of 13-14 years old, to 13.0 for the patients of 11-12, to 14.5 for the patients of 9-10, and to 16.0 points for the patients of 7-8 years old. I.e., this values increase inverse proportionally to the age with a constant step of 1.5 point per two years. It is reasonable to estimate an accuracy of the model regarding to a heart rate because it is a parameter of Ruffier index. When the index equals 10 points, a sum of values of the heart rate (in rest, just after the end of the effort, and in 45 s after the end of the effort) from the equation (eq. 1) was calculated as 300. Corresponding value of the index, corrected to a normal heart rate of young patients, should be calculated with the followed equation:
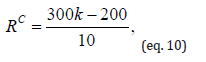
Aiming to compare Ruffier index values (eq. 10) with corresponding values calculated according to the model by Guseva [8], the first one was scaled into the range of 10-16 points and named as Rs :
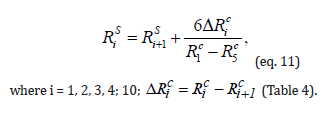
Table 4: Parameters of the model of correction by (Guseva [8]).

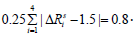
An average error of a step equalled 1.5 was estimated by the expression


Corresponding data values in the range and with the mean value showed a substantial no correspondence of the linear relationship between Ruffier index vs. age with a step of 1.5 point per 2 years according to the model of correction by Guseva [8]. Therefore, this model is not sufficiently reliable for the assessment of Ruffier test results.
An original version of Ruffier test and well known models of its correction are not acceptable for the assessment of the health level of young patients. A normal value of the heart rate in rest should be accepted as a parameter of the correction. A proposed correction model of test showed a statistically significant ( p < 0.001) difference with corresponding results determined according to the original model. Corrected values of Ruffier index in the practice of physical education could be calculated using a formula (eq. 6) with an age correction coefficient (see (Table 3)).


