Impact Factor : 0.548
- NLM ID: 101723284
- OCoLC: 999826537
- LCCN: 2017202541
Lobreglio Giambattista1, Rosato Chiara1, Tanieli Giordano2, Isgro’ Camilla3 and Chicone Michele1*
Received: December 23, 2022; Published: February 21, 2023
*Corresponding author: Chicone Michele, Clinical Pathology and Microbiology Unit, Vito Fazzi General Hospital, Piazza Filippo Muratore 1, 73100 Lecce, Italy
DOI: 10.26717/BJSTR.2023.48.007706
Diabetes mellitus is today comparable to a silent pandemic, which physically affects more than 300 million people, with a significant economic impact on health systems. According to the American Diabetes Association (ADA) guidelines (2021), diabetes may be diagnosed basing on plasma glucose criteria (Fasting Plasma Glucose [FPG] and 2h-plasma glucose during Oral Glucose Tolerance Test [OGTT]) or glycated haemoglobin (HbA1c) criteria [1]. HbA1c represents an average of blood sugar levels over the last 8-12 weeks so it can be considered as a long-term glycemic indicator. The method used to assess this value is accurate, easy and reproducible but sometimes it has not a good sensitivity. Furthermore, several biological/environmental factors (e.g., red blood cell lifespan, ethnicity, hemoglobinopathies, iron deficiency) and interferents (e.g., vitamin C) [2] could be affected results. Glycated albumin (GA) measurement reflects the mean blood glucose levels over the past 2-3 weeks. Therefore, it could be considered as a medium-term glycemic indicator, allowing to verify patient’s glycemic compensation in the initial phases of diabetes and in all those situations that require short-term monitoring of changes in glycaemia (e.g., after starting or changing a therapy) [3]. In this study, we verified the analytical performances of sensitivity and specificity of the GA test on healthy and diabetic subjects, divided according to the clinical history and the results obtained from the HbA1c test. We compared the results of GA with those of HbA1c in different groups of patients: diabetic subjects, subjects with impaired fasting glycaemia and healthy subjects. A correlation study between the levels of GA and HbA1c in each sample was performed using the Pearson’s correlation coefficient. Finally, using a receiver operating characteristic curve (ROC curve), we established the ideal cut-off value associated with the best sensitivity and specificity for the tested population. Comparative studies show a strong correlation between glycated albumin and glycated hemoglobin both in diabetic and at risk subjects while in healthy subjects also with impaired fasting glucose there is a weak correlation when comparing glycated albumin to both HbA1c and glycaemia.
Keywords: Diabetes Mellitus; Diagnosis; Diagnostic Accuracy; Glycated Albumin; Glycated Hemoglobin; Fructosamine
Currently, the diagnosis of diabetes mellitus is based on the following criteria:
1. Symptoms of diabetes (polyuria, polydipsia and unexplained weight loss) plus a casual plasma glucose concentration of 11.1 mmol/L (200 mg/dL).
2. Fasting blood glucose level of 7.0 mmol/L (126 mg/dL) as no caloric intake for at least eight hours.
3. Two-hour post-load glucose of 11.1 mmol/L (200 mg/dL) during an OGTT. The test should be performed as described by WHO, using a glucose load containing the equivalent of 75 grams of anhydrous glucose dissolved in water.
In the absence of unequivocal hyperglycaemia, these criteria should be confirmed by repeat tests on a different day. The third test (OGTT) is not recommended for routine clinical use. Relatively simple tests, such as fasting glucose or HbA1c, are increasingly recommended as an initial step for the selection of at-risk patients, but the latter benefits from being independent of subject compliance [4]. HbA1c is a specific glycated hemoglobin subfraction formed by the attachment of glucose to the N-terminus of the beta chain of hemoglobin (Hb).
HbA1c represents an average of the blood glucose level in the last three months, most affected by the last 30 days. HbA1c is robust both analytically and functionally, since neither fasting nor a glucose load are required. HbA1c has a high positive predictive value for diabetes at a cut-off above 6.5% (or 48 mmol/mol, as recommended by the International Federation of Clinical Chemistry and Laboratory Medicine [IFCC]). Certainly a level of HbA1c of 6.0% (IFCC 42 mmol/ mol) or higher is usually considered abnormal and it requires further investigation. It has the advantage of being accurate, simple and, now, reproducible with the standardization and harmonization of tests worldwide. However, the precise limit for the diagnosis of diabetes remains controversial: a level of 6.5% (IFCC 48 mmol / mol) is specific for the diagnosis of diabetes in most studies but, in other works, at this cut-off does not correspond a good sensitivity so many cases remain not diagnosed [5]. The accuracy of the test is further complicated by many factors, which modify HbA1c levels due to biological variability, genetic factors (such as red blood cell lifespan, ethnicity and hemoglobinopathies), environmental factors (e.g. iron deficiency) and interference (eg vitamin C). In these cases the simultaneous use of the GA test could be helpful.
GA is formed from a post-translational non-enzymatic reaction between albumin and glucose and its measurement reflects the average blood glucose level over the past 2-3 weeks. It is therefore a medium-term glycemic indicator because it reflects the average turnover of albumin (about 20 days). Compared to HbA1c, GA can indicate both an improvement and a worsening of a patient’s glycemic compensation in the initial phase therefore a it is useful in all those conditions that require short-term monitoring of changes in blood glucose, for example after starting or changing a therapy. GA, unlike HbA1c, can be measured in serum or plasma even in patients with anemia or hemoglobinopathies or with renal insufficiency, as an alternative to HbA1c which cannot be used in these particular conditions [6]. GA test is more specific than the already known dosage of fructosamine. In the past, the fructosamine test was not used for the evaluation of diabetes because it did not represent only the GA but the set of glycosylated proteins present in the plasma, each with a different half-life and a variable plasma composition. Modern GA tests have numerous advantages compared to the fructosamine dosage: greater accuracy, remarkable speed of execution on routine automatic analyzer, specifically measurement of the total albumin and the related glycated fraction by immunoenzymatic assays, with the possibility to compare the percentage of glycated albumin obtained with the results of the gold standard method HPLC applying a specific correlation factor [7]. The objectives of our study are to verify the analytical performance (sensitivity and specificity) of the GA test based on reference values recommended; to compare the results of GA levels with the HbA1c levels and glycaemia; to establish the ideal cut-off value associated with the best sensitivity and specificity for the examined population.
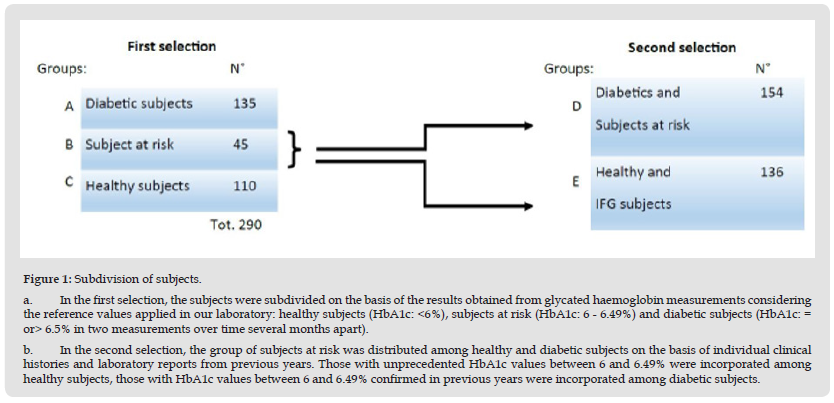
Figure 1 Subdivision of subjects. a. In the first selection, the subjects were subdivided on the basis of the results obtained from glycated haemoglobin measurements considering the reference values applied in our laboratory: healthy subjects (HbA1c: <6%), subjects at risk (HbA1c: 6 - 6.49%) and diabetic subjects (HbA1c: = or> 6.5% in two measurements over time several months apart). b. In the second selection, the group of subjects at risk was distributed among healthy and diabetic subjects on the basis of individual clinical histories and laboratory reports from previous years. Those with unprecedented HbA1c values between 6 and 6.49% were incorporated among healthy subjects, those with HbA1c values between 6 and 6.49% confirmed in previous years were incorporated among diabetic subjects.
Patients and Study Design
In this study, we enrolled 290 patients from the Salento area of the Puglia Region in Italy. We stratified patients into three groups: healthy (110), diabetic (135) and at risk of diabetes (45), considering the results of the HbA1c test, performed using a specific kit provided by Arkray and the automated analyzer Adams A1C HA-8180V-Arkray. Patients were divided considering the reference values applied in our laboratory for HbA1c: healthy subjects (<6%), subjects at risk (6 - 6.49%) and diabetic subjects (= or> 6.5% in two measurements over time a few months apart) (Figure 1a). Subsequently, the group of subjects at risk was distributed among healthy and diabetic subjects on the basis of individual clinical histories and laboratory reports from previous years. Those with unprecedented HbA1c values between 6 and 6.49% were incorporated among healthy subjects, those with HbA1c values between 6 and 6.49% confirmed in previous years were incorporated among diabetic subjects (Figure 1b). Two large groups were then formed, healthy subjects including those with impaired fasting glycaemia (136) and diabetic subjects including those at risk (154).
GA Test
We used a GA test kit provided by Instrumentation Laboratory s.p.a. – Werfen. This kit was installed on clinical chemistry module c702 of Cobas 8000 series produced by Roche Diagnostics, according to the kit manufacturer’s instructions. The principle of the test is based on a enzymatic method, containing reagents for both for glycated albumin and for total albumin measurements. The value of glycated albumin (%) is calculated using the concentration measurements of glycated albumin and albumin in the sample. For the measurement of glycated albumin, the sample reacts with a Ketoamine Oxidase (KAOD) to eliminate the endogenous glycated amino acids by conversion into glucosone, amino acids and hydrogen peroxide. The resulting solution reacts with a specific protease for albumin which converts glycated albumin into glycated amino acids. These react with KAOD to form glucosone, amino acids and hydrogen peroxide. Finally, peroxidase (POD) catalyzes the reaction between (N,N-Bis[4- Solfobutyl]-3-Methylaniline Disodium Salt), 4-Aminoantipyrine and Hydrogen peroxide forming a composed of blue-violet. The colour change is quantified through measurement of the absorbance. For the measurement of albumin a pre-treatment solution reacts with the SH groups of albumin oxidizing it. Subsequently, the solution reacts with Bromocresol purple (BCP), forming a conjugated compound of albumin and BCP of blue colour. The colour change comes quantified by measuring the absorbance. The cut-off of the percentage of glycated albumin compared to total albumin derives from the reference values recommended by the supplier company. Results are negative if they are equal or less than 14.4 % and positive if they are equal or greater than 14.5% [8].
Statistics
The results of the GA dosages were compared both with those of HbA1c and glycaemia in the groups of healthy, diabetic and atrisk subjects. A correlation study between the levels GA, HbA1c and glycaemia in each groups of patients was performed using a linear regression analysis model together with the Pearson’s correlation coefficient. This index is a measure of a linear correlation between two sets of data and it is defined as the covariance divided by the product of the standard deviations of two variables. It always assumes values between -1 and 1; the relationship between the two set of data is weak when the value of the coefficient is close to zero, while it is strong when it exceeds 0.70. Intermediate values between 0.30 and 0.70 indicate moderate correlation [9].
Figure 2 Comparison of the results of GA levels with the HbA1c and glycaemia. Comparative studies show a strong correlation between glycated albumin and glycate hemoglobin both in the group A (diabetic subjects) and group D (that includes diabetic and at risk subjects).
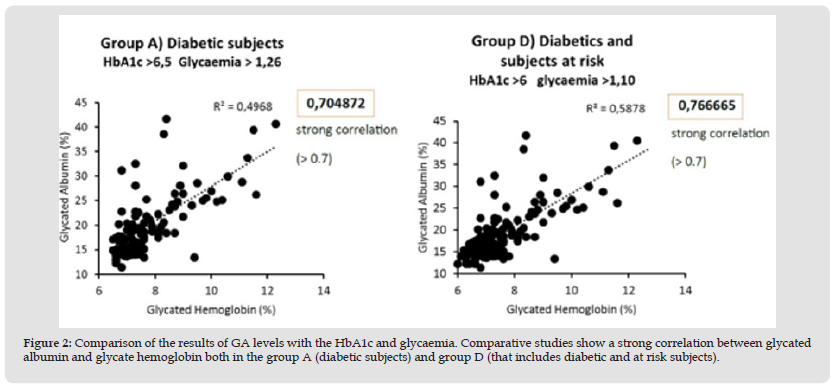
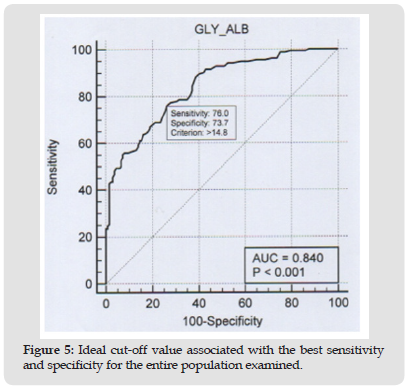
Comparative studies show a strong correlation (r = 0.76) between glycated albumin and glycated hemoglobin both in diabetic subjects and in the group that includes diabetic and at-risk subjects (Figure 2). In these same groups there is a moderate correlation when we compare glycated albumin (r = 0.46) and HbA1c (r = 0.60) with glycaemia (Figure 3). In healthy subjects there is a moderate correlation (r = 0.21) when comparing glycated albumin to both HbA1c and blood glucose (Figure 4). The first results of analytical sensitivity and specificity for glycated albumin were calculated including all serum samples with cut-offs greater than or less than 14.5%. The two groups, without taking into account other laboratory parameters of the individual patients, showed a sensitivity of 80.7% and a specificity of 79.5%.Subsequently, the sensitivity and specificity parameters were measured by excluding from the two groups the subjects who presented renal and / or hepatic function defects considering the results of eGFR, proteinuria and transaminases: 10 cases with renal dysfunction and 1 case with hepatic dysfunction were excluded from Group D; 20 cases with renal dysfunction and 6 cases with hepatic dysfunction were excluded from Group E. This resulted in a sensitivity of 88.4% and a specificity of 85.6%.Furthermore, our study shows that sample quality(icteric, lipemic, or hemolyzed serum) does not interfere with the glycated albumin test as long as these parameters are mild [10]. Furthermore, the results of the test performed on the freshly drawn sample serum do not differ significantly from the results of the test performed after thawing the serum from -80°C [11].The analysis to redefine the ideal threshold value based on the population studied, performed using the ROC curve, showed a cut-off for Albumin Glycate of 14.8%. At this cutoff, the sensitivity was 76% and the specificity was 73.7% with 0.840 AUC (Area Under the Curve) P <0.001 (Figure 5). The analysis to redefine the ideal threshold value based on the population studied, performed using the ROC curve (MedCalc software) showed a cut-off for Albumin Glycate of 14.8%. At this cutoff, the sensitivity was 76% and the specificity was 73.7% with 0.840 AUC (Area Under the Curve) P <0.001.
Figure 3 Comparison of results of GA and HbA1c levels with glycaemia: In the group A (Diabetics) there is a moderate correlation when we compare glycated albumin andHbA1c with glycaemia.
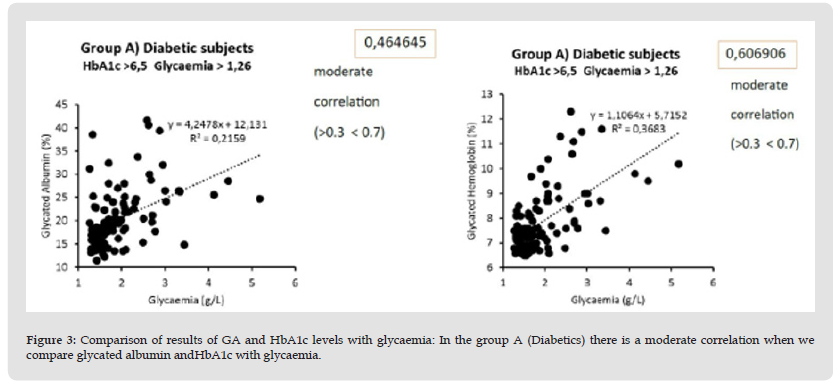
Figure 4 In healthy and IFG subjects there is a weak correlation when comparing glycated albumin to both HbA1c and blood glucose.
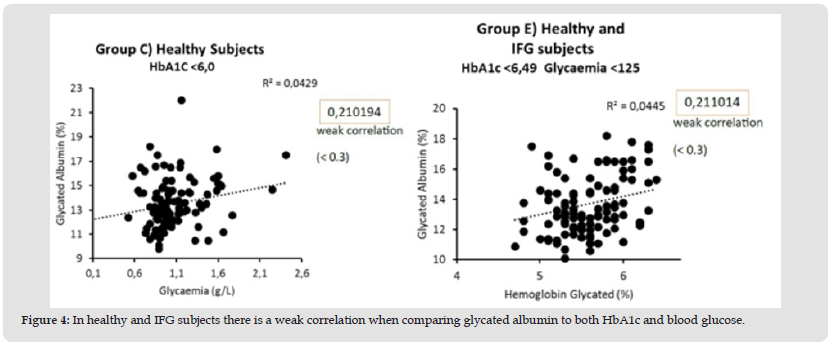
Figure 5 Ideal cut-off value associated with the best sensitivity and specificity for the entire population examined.
Based on the results obtained in this study, we consider the glycated albumin test a valid aid for clinicians to monitor the shortterm glycaemic control in critical patients and/or in those that are starting/changing a hypoglycaemic therapy. GA test is useful to support the diagnosis of diabetes in patients with anemia or hemoglobinopathies, or with renal insufficiency, as an alternative to glycated hemoglobin. Our advice for all the laboratories is to redefine and validate their own reference values taking into account the target population and the method used.
There was no financial support for this study.
The authors declare no conflicts of interest.


