Impact Factor : 0.548
- NLM ID: 101723284
- OCoLC: 999826537
- LCCN: 2017202541
Ahmad Khalaf Alkhawaldeh*
Received: January 27, 2022; Published: February 09, 2023
*Corresponding author: Ahmad Khalaf Alkhawaldeh, Department of Allied medical sciences, Zarqa University College, Al-Balqa Applied University, Jordan
DOI: 10.26717/BJSTR.2023.48.007669
Platinum nanoparticle electrode modified by iodine monolayer (PtNPs/I) has been designed to simultaneously determination of Pb2+ using Square Wave Voltammetry (SWV), the analyzed the anodic peak current and anodic maximum potential is done. The Scanning Electron Microscopy (SEM) and Energy-Dispersive X-ray spectroscopy (EDX) demonstrate some fascinating characteristics of the uniform particle distribution, growth and self-assembly of the iodine-modified platinum nanoparticle. They also examined the effect of the concentration of lead and the effect of the scan rate on anodic top parameters. The results show that the anodic current peak increases and that the anodic peak potentials increase in comparison to the clean electrode to a negative value. They have noticed that lead and scan rate increases, anodic peak current increases. As the lead concentration and scan rate increase, the anodic peak potential changes to more positive values. The easily reproducible RSD 5% (n=5) removal peak current for heavy metal ion was shown under ideal conditions. For a pre-concentration time of 120 s, the linear ranges are between 1 to 100μg. L-1. For lead ions, the concentration limit was measured as 0.408 μg. L-1 using the improved analytical process. The transmitter was a lead ion with a 0.215 μA/μM- cm2 range, with a measurement maximum of 0.01 μM.
Keywords: Modified Electrodes; Biochemistry Sensor; Platinum Electrode; Nanostructure
Abbreviations: SEM: Scanning Electron Microscopy; EDX: Energy-Dispersive X-ray spectroscopy; SWV: Square Wave Voltammetry; CV: Cyclic Voltammetry
Square Wave Voltammetry (SWV) is one of the most effective analytical tools to map heavy metal particles. Voltammetry is an extremely sensitive method for the determination of heavy metals in different matrices [1-2]. As a result of its high reproducibility and sensitivity, mercury-setting electrodes are typically used to assess lead and cadmium [3-4]. The mercury free work electrode for the SWV, including gold, silver, platinum, bismuth and modified electrodes, was created due to the high environmental toxicity of mercury [5-7]. Platinum is one of the most inert elements but is extremely active in some electro-chemical conditions. In electrochemical analysis, it has many advantages such as reliability, low background current, high conductivity, reproducibility, and simple processing [8]. The earlier studies showed that the surface area and conductivity of platinum nanoparticles could increase with good catalytic properties to electron transfer and the high catalytic effectiveness of platinum nanoparticles has demonstrated a great appeal [9]. Another metal is needed to provide oxygenated species (source) which cause inactivity of Platinum. Some techniques have been proposed to clarify this thought: bifunctional mechanism, electronic properties alteration of the base metal and the third body effect [10]. The Pt alloy with a second metal (M = Sn, Ru, Au, Bi, Mo, Pb, Pd, Bi and Os) is an efficient way to enhance the electrocatalytic and electroanalytical properties (stability and activity) and decrease the use of costly Pt in electrocatalysis [11-13].
The exemplary alloys showed better catalytic efficiency than the monometallic platinum catalysts. Recently, Bi-metallic materials (Pt- Metal), such as core/shell structures, plates, aggregates, sheets, and spheres were of great interest, especially as electro- analysis were theirs [14-16]. For electrochemical analysis and selective determination of lead, cyclic, linear and square-wave voltammetry in pharmaceutical formulations has been investigated [17]. Interesting work was found in the new era in the design and development of nanoparticles sensors [18]. In particular, the highly interesting structure of the surface, good electrical and mechanical characteristics, solid stability and a low aggregation have been found to be the perfect supporting materials for the electrocatalytic [19]. The aim of this work is to study detection of Pb2+ at trace levels by electrochemical voltammetry method using platinum nanoelectrode modified by Iodine (PtNPs/I) in aqueous solution employing electrochemical.
CPA-HC5 auto-label electrochemistry analyze (Hanoi, Vietnam) using a three-electrode configuration platinum wire as counterelectrode, Pt nanoparticle in tantalum surface as working electric and Ag/AgCl as referrals. Electrochemical experiments were carried out using potentialostatic (273A, Princeton Applied Research). Analytical efficiency or the best commercially available purity of reagents is used. All the analytical grade chemicals were made by Merck (Germany). H2PtCl6.6H2O, H2SO4 and Lead stock solution (1000 ppm) were purchased from Merck. Both treatments were formulated using distilled water. The platinum nanoparticles were electrodeposited to a bare tantalum electrode in H2SO4 0.5 M solution, with a constant potential of 1.0 mM H2PtCl6 of -0.2 V and 120s deposition time of [20]. The electrode Pt/Ta was then carefully washed before use with purified water. The platinum surface was modified by dipping the superficial electrode into a solution containing iodine cations in open-circuit conditions. The cation concentration in such cases corresponds to the solubility of 0.5 M sulfuric acid of the salt unit. Electrochemical tests of the proposed sensor were conducted with square wave voltammetry at room temperatures (25±1 °C).
The SWV tests were performed in 0.5 M sulphuric acid in 0.050 s; 0.03 s phase time; 0.25 V s-1 sweep rate. In the range of scans -0.2 to 1.2 V the Pb2+, ions were eliminated, and the peak currents measured. Using normal addition procedure (3 additions), electrochemical quantitative identification of metal ions was performed. After through normal introduction per analytical approach and approach and an average of three runs has been measured. The PtNPs/I electrode surface was electrochemically cleaned after every measurement. The water delivery system (Province of Binh Dinh, Jordan) gathered all the local water samples. This was sampled by HNO3 (pH=2) and purified by a glass fiber filter of 0.45 μm. The samples were then digested for 90 minutes by UV digesters to decompose organic compounds to simple ones, after adding 30 per cent H2O2 to each sample. Before the SWV analysis.
Characterization of Pt Nanoparticle Electrode Modified by Iodine
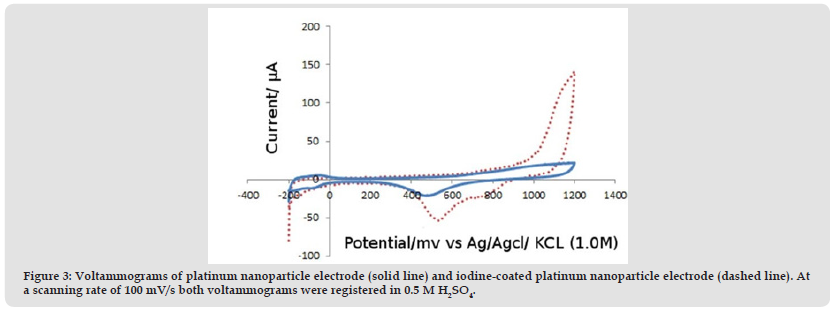
The synthesized Pt nanoparticle electrode modified by iodine was characterized for functional groups using (SEM, scanning electron microscopy), (CV, Cyclic Voltammetry) and (EDX, Energy-Dispersive X-ray spectroscopy). (Figure 1) shows the typical SEM image obtained for the electrodeposited Pt nanoparticle electrode modified by iodine. Herein the SEM image has been obtained for 500 nm surface areas. The SEM image shows that the Pt nanoparticles are uniformly dispersed on the electrode surface. The identity of the Pt nanoparticle electrode modified by iodine is further confirmed by the EDX spectrum of the deposited particles (Figure 2). The electrochemical behavior of Pt nanoparticle electrode modified by iodine was studied using cyclic voltammetry at a scan rate of 100 mV/s. (Figure 3) shows the iodine coated platinum nanoparticles electrode representative voltammograms recorded in 0.5 M H2SO4 (dashed line) superposed to the process voltammograms of the bare platinum electrode nanoparticles (solid line). The absence of redox (oxidation/reduction) activity and in particular oxygen and hydrogen adsorption indicate a near total surface suppression between the hydrogen production limits (around -0.2 V) and surface iodine suppression levels (around 0.95 V). The iodine is partially deorbited when the potential of the electrode with iodine-coated scans is above 0.95 V. The restoration, between its hydrogen and the oxygen production limits, of cleanness in the surface that involves the daily washing of the work electrode, and the compartment requires a number of possible cycles. A 1.18 V based peak displays a platinum nanoparticle electrode with iodine electrooxidation. Nevertheless, the iodine is stable if the potential electrode does not exceed 0.95 V. Therefore, the practical analytical potential range usually varies from -0.1 to 0.95 V. (Table 1).
Figure 3 Voltammograms of platinum nanoparticle electrode (solid line) and iodine-coated platinum nanoparticle electrode (dashed line). At a scanning rate of 100 mV/s both voltammograms were registered in 0.5 M H2SO4.

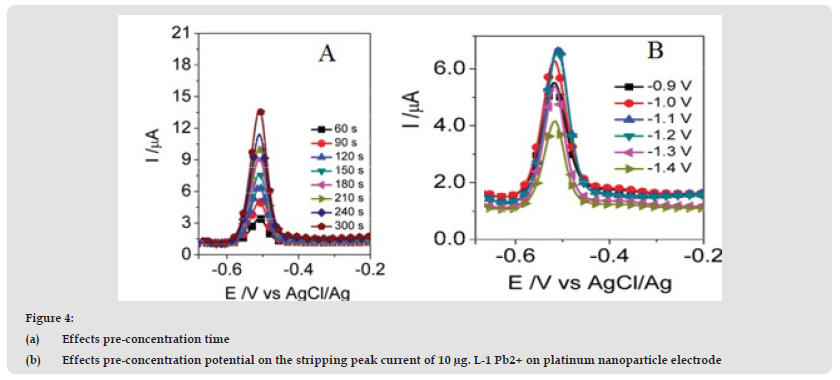
The effect of stripping signals over a pre-concentration time was studied over a span of 60 to 300 s at 10μg. L-1. More Pb2+ is replaced and adsorbed on the PtNPs/I surface as the pre-concentration time increases, increasing the strip signaling rate. (Figure 4) revealed a linear rise in the Pb2+ stripping peak currents in the pre-concentration duration observed. (Figure 4B) showed the effect of pre-concentration potential on the elimination of peak current at a pre- concentration period of 120 seconds for the electrolyte with a 10 μg L-1 Pb2+ enabling capacity range from -0.9 to -1.4 V. The Pb2+ peak current was improved with a potential shift from -0.9 to -1.2 V as well as a near constant rise between -1.1 and -1.2 V as a previously established possibility. Amplitudes of 10 to 100 mV at the 6-mV phase potential vector for the purpose of pulse amplitude. After the pulse amplitude increased it was found that the peak current decreased by linear equations (Figure 5) in Ip, Pb = 1.283 + 0,065 ΔE, R2 = 0,979. This is sufficient in the case of Ip = K.ΔE However, as the pulse amplitude is raised, Ep is moved towards the negative side and the duration is extended, thereby enhancing the effect of other materials. Consequently, the amplitude for the next experiment was chosen to be 60 mV.
Figure 4 (a) Effects pre-concentration time (b) Effects pre-concentration potential on the stripping peak current of 10 μg. L-1 Pb2+ on platinum nanoparticle electrode.

Linear Scale
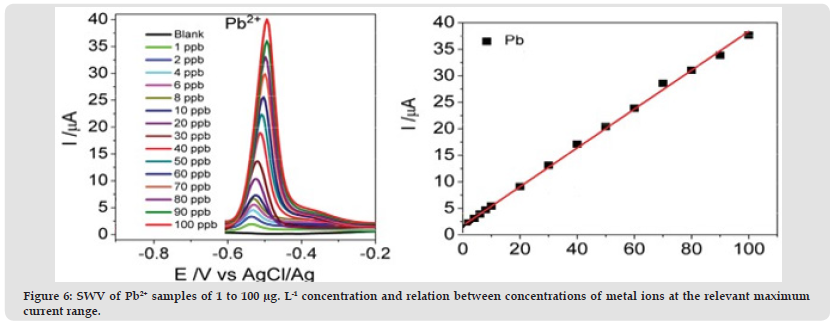
The linear association between the Pb and Ip values for led with a Pb2+ correlation coefficient of 0.998 was strong in the range from 1 to 100 μg. L-1. (Figure 6) shows SWV and linear metal regression lines / equations.
Figure 6 SWV of Pb2+ samples of 1 to 100 μg. L-1 concentration and relation between concentrations of metal ions at the relevant maximum current range.

Detection limit (LOD)
The detection limit was calculated at 0.408 μg. L-1 of Pb2+ in 10 blank solution replications, respectively, under optimum conditions. For Pb2+ striping peak currents, SWV with PtNPs/I achieved high reproducibility. The reproducibility RSD value was estimated to be 4.65% for Pb2+ indicating a robust manufacturing process (n = 5). The electrocatelitalytic activity and current density–time responses for lead oxidation at its fixed potential from 0.4 up to 0.8 V in (Figure 7) of iodine-modified PtNPs. The Pt nanoparticle electrode modified iodine shows the highest current density (53 mA cm-2), while in 0.3 seconds the Pt nanoparticle electrode shows a present density of 17 mA cm-2. This data shows increased operation and iodine stability. The modification of metal, which can enhance catalytic effectiveness and the bifunctional mechanism or structure of the ligand, can also explain these findings.
According to the results, they can conclude that the nanoparticle platinum electrode containing the iodine monolayer, modified electrode, presents electrocatalytic activity and good selectivity for iodine. This electrode can therefore be improved and used as a sensor for the identification of iodine in natural systems. Pt nanoparticle electrode, modified by iodine, showed better electrocatalytic activity against iodine oxidation and was able to reactive iodine over a broad range of well stable concentrations with good sensitivity (0.215 μA/μM-cm2). In certain local waters, the platinum nanostructured electrode, modified by iodine adatoms, was used to evaluate lead with good results in line with the square wave voltammetry methods. The sensor suggested demonstrated a high electro- chemical sensitivity to small amounts to ions Pb2+ with a weak Pb2+ 0.408 μg. L-1 detection.


