Impact Factor : 0.548
- NLM ID: 101723284
- OCoLC: 999826537
- LCCN: 2017202541
Wemerson De Castro Oliveira1*, Cristiane Alves De Oliveira2 and Kenji Fuke1
Received: January 23, 2023; Published: February 09, 2023
*Corresponding author: Wemerson de Castro Oliveira, Department of Teaching, Research and Extension Federal Institute of Education, Science and Technology Sul-Rio-Grandense Lajeado, RS, Brazil
DOI: 10.26717/BJSTR.2023.48.007666
The objective of this study was to verify the nutritional status of adolescent students using the Body Mass Index by Age (BMI/Age), and to relate recommended daily caloric intake to daily caloric intake. A documental analysis of reports of practical activities of an interdisciplinary pedagogical proposal between the disciplines of Biology and Physical Education, called “Consumption of food and healthy life”, was carried out. The variables collected were: date of birth, age, gender, body mass (kg), height (m), recommended daily caloric intake (kcal) and calories consumed (kcal) through food records. Anthropometric analyzes were performed using the “Who AnthroPlus” software. Nutritional classification was performed according to the scale proposed by WHO (2007). Of the total number of adolescents, 74.5% were classified as eutrophic and 24.4% were overweight or obese, and of these, 9.9% had more critical values of excess weight. Of the sample, only 1% showed a thin profile. There was no correlation between BMI/Age values with age and sex. The average recommended daily caloric intake was 2,293 kcal/day, while the average consumed was 1,855 kcal/day, with 69.9% consuming fewer calories than indicated and only 2.0% consuming excess calories. It was concluded that a considerable number of students were overweight for their corresponding height and age, reproducing a pattern already reported by other works; however, the recorded caloric consumption profile was not consistent with this result, indicating a possible significant consumption of “empty calories”, mainly in the form of added sugars and fats.
Keywords: Adolescents Students; Nutritional Classification; Nutritional Profile; Recommended Daily Caloric Intake
Monitoring growth through anthropometric measurements of children and adolescents is extremely important for monitoring nutritional status. The most used anthropometric measurements have been: body mass, height, limb length, circumferences and skinfolds. Such measures are evaluated according to sex and age, through tables, curves and graphs organized in the form of percentiles and z scores. Currently, the World Health Organization (WHO) BMI/age body mass index percentile curves are widely used as a classification system for nutritional status. In this proposed model, cutoff points were determined for six classifications: extreme thinness, thinness, normal weight, overweight, obesity and severe obesity [1]. Among these classifications, overweight and obesity, related to the imbalance between food intake and energy expenditure and consequent accumulation of body fat [2], are considered a worrying public health problem in developed and developing countries [3]. This concern arises because the excessive accumulation of fat is related to the development of several chronic degenerative diseases such as diabetes, heart disease, cancer, among others.
In the prepubertal and pubertal phases, physiological transformations occur, in addition to important psychosocial changes, and this contributes to the vulnerability of characteristics of individuals in these age groups; thus, they can be considered a nutritional risk group, due to the frequent inadequacy of their diets, resulting from the increase in energy and nutrient needs to meet the demand of growth [4]. For the composition of the diet in childhood, food preferences are fundamentally determined by the criterion “like or dislike” [5], however the offer and availability of food become of paramount importance. Still according to Viana et al [5], the attitudes of adolescents towards food imply much more complex factors that interact with each other in an integrated way, since the reasons that lead them to consume this or that product is related to the intrinsic qualities of the same (as being or not being healthy, being or not being natural, being tasty, having an attractive appearance, etc.). Considering that adolescence is a period of life with strong physical and psychological changes influenced by genetic and ethnic factors, as well as by different social and environmental conditions [4], the objective of this work was to verify the nutritional status of adolescent students, evaluated by the Body Mass Index for age (BMI/Age), and relate the recommended daily caloric intake to the daily caloric intake.
It is exploratory research of the documentary type, which has the function of forming and clarifying a content, elucidating a question according to the researcher’s purpose [6]. The data collection was carried out from the analysis of the reports of practical activities of an interdisciplinary pedagogical proposal, called «Consumption of food and healthy life», developed by the disciplines of Biology and Physical Education in high school integrated with the technician in Administration and Automation Industrial of a public school located in the south of Brazil between the years 2021 and 2022. The sampling covered 192 documents, 68 with female data and 124 male, and the variables collected were: date of birth, age, sex, body mass (kg), height (m), recommended daily caloric intake (kcal) and calories consumed (kcal) through food records.
Data on recommended daily caloric intake and calorie consumption (n=186) present in the practical activity report were obtained:
(a) Recommended daily caloric intake - student lifestyle using the “TDEE Calculator” software (available at: https:// tdeecalculator.net/) considering the following variables: gender, age, weight, height, activity - sedentary (office job); light exercise (1-2 days/week); moderate exercise (3-5 days/week); heavy exercise (6-7 days/week); and athlete (2x per day).
(b) Calorie consumption: food records made on three days of the week, these being on non-consecutive days throughout the week, and one of them must be related to consumption on Sunday [7]. Food consumed was recorded in the “FatSecret” smartphone software or on the “FatSecret Brasil” website (available at: https://www.fatsecret.com.br/Default.aspx?pa=m) and the total caloric intake per day recorded in the report. In this study, the average caloric intake of the three days (two days of the week and one day on the weekend) was used.
To obtain anthropometric data (n=192), the “Who AnthroPlus” software was used (available at: https://www.who.int/tools/growthreference- data-for-5to19-years/application-tools). The calculated parameters were: body mass index (BMI), BMI-for-age and z-score. From the z-score values, the student’s profile was drawn according to the nutritional classification scale for adolescents aged 10 to 19 years by BMI/Age [1]. The GraphPad Prism program (version 8.2, Inc., La Jolla, CA, USA) was used to perform the statistical non-parametric tests by Kruskal-Wallis and Mann-Whitney Test. Spearman’s nonparametric correlation test was used, with a significance level of 95%.
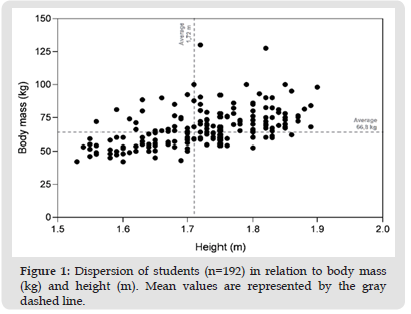
Figure 1 Dispersion of students (n=192) in relation to body mass (kg) and height (m). Mean values are represented by the gray dashed line.

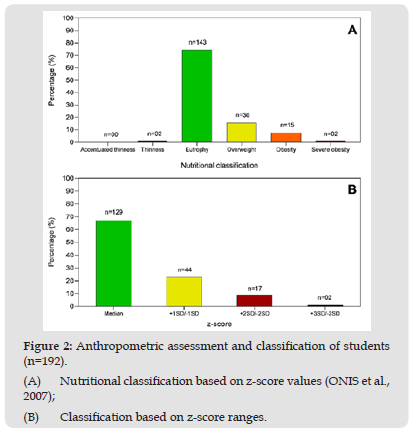
(Figure 1) represents the dispersion among students, considering body mass (kg) and height (m). There is a higher concentration of students weighing between 50 and 75 kg, with an average value of 66.8 kg, with height varying between 1.53 and 1.90 m (mean = 1.72 m). By the distribution of the points, it is possible to perceive a profile trend more towards overweight than thinness, with some cases with values equal to and/or greater than 100 kg. Obesity has grown rapidly worldwide [8,9] and has become a public health problem [10], being associated not only with genetic and environmental factors, but also with inappropriate lifestyle [8]. A considerable portion of students, 74.5%, presented “eutrophy”, showing that students in general had an adequate nutritional classification. Only 1% of the sample showed a thin profile, however, 24.4% of the adolescents were overweight or obese, with higher BMI/Age values. The data from this study are very close to the values found by the Family Budget Survey (POF 2008- 2009) [11] where the prevalence of overweight among adolescents (10–19 years old) was 20 to 27% in the Southeast, South and Central regions. West, and only 1% to 2% of prevalence of weight deficit in the class of adolescents with higher income [11]. Furthermore, data from the National Survey on Demography and Health - PNDS demonstrate that 21.6% of adolescents (15 and 19 years old) were overweight, with 4.4% of them being obese and 2.2% underweight weight [12]. Therefore, this work may indicate that over the last 10 years, at least, there has been no improvement in the pattern of overweight among Brazilian adolescents.
Median BMI/Age values between groups (Figure 2) showed statistical difference (p<0.05). The “thinness” group did not differ from the “eutrophy” group; however, both were statistically different from the other groups (overweight and obesity) that presented similar values between them (p>0.05). A study carried out by Wang et al [13], in countries with different stages of socioeconomic development, revealed an increase in the prevalence of overweight among adolescents in the magnitude of 62% in the United States and 240% in Brazil. Severe obesity was not considered in this analysis because its BMI/Age value was not determined.
Figure 2 Anthropometric assessment and classification of students (n=192). (A) Nutritional classification based on z-score values (ONIS et al., 2007); (B) Classification based on z-score ranges.

There was no statistically direct correlation between BMI/Age and the variables age, gender and course studied (Administration and Industrial Automation), showing a correlation coefficient close to zero, r= -0.03, 0.09 and 0.00, respectively. In addition, a survey analysis of the calculation of recommended daily caloric intake and caloric intake through a three-day food log was performed. The recommended daily caloric intake was 2,293 kcal and the average energy consumed was 1,855 kcal in the three days analyzed, that is, caloric intake would have been lower than recommended to meet the body’s metabolic needs. Of those studied, 69.9% (n=130) consumed fewer calories than indicated and 2.0% (n=37) consumed excess calories.
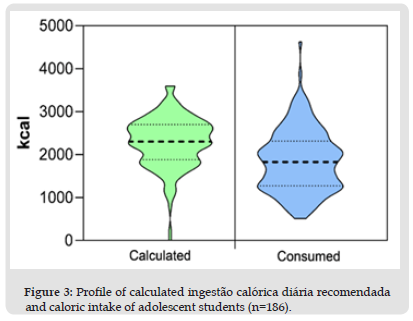
However, a greater number of students were classified as overweight, obese and severely obese, possibly indicating that these adolescents would be consuming “empty calories” through lownutrition foods, with high caloric density, but low in fiber, vitamins and minerals. This can be confirmed by Serra and Santos [14] who state that in this age group, the increase in caloric intake can be due to the excess of foods rich in fats and sugars, as in the case of the practice of fast snacks, leading to overweight., obesity and deficiency diseases. Another justification could be sedentary lifestyle and/or lack of physical activity (PA). In recent years, through epidemiological and clinical studies, the benefits of regular practice of AP in public health have been documented [15] and more than 60% of adults do not meet the minimum suggested levels of AP [9]. The calculated and consumed profile is shown in figure 3 and showed a statistical difference between the mean values. In (Figure 3), the inversion of the profile between the calculated calories, which tapers to the lowest caloric value, and those consumed, which tapers in the opposite direction, to the highest value, is evident. The recommended daily caloric amount, indicated in the “TDEE Calculator” software, is more concentrated between the range of 2000 to 3000 kcal, not exceeding 3500 kcal.
Figure 3 Profile of calculated ingestão calórica diária recomendada and caloric intake of adolescent students (n=186).

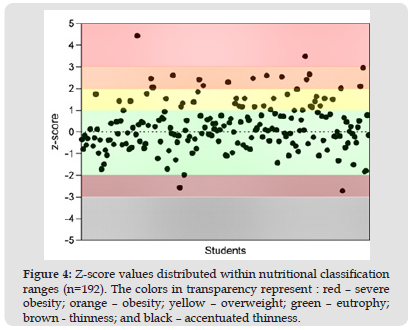
Figure 4 Z-score values distributed within nutritional classification ranges (n=192). The colors in transparency represent : red – severe obesity; orange – obesity; yellow – overweight; green – eutrophy; brown - thinness; and black – accentuated thinness.

In the consumption profile, the highest concentration of adolescents consumed between 1000 and 2000 kcal, reaching a consumption greater than 4500 kcal. Adolescents can be considered a nutritional risk group, due to the inadequacy of their diet due to the increase in energy and nutrient needs to meet the demand of growth [4]. Considering gender, there was no difference in variation between calculated and consumed calories. However, the mean caloric intake between men (mean=2,067 kcal) and women (mean=1,255 kcal) showed statistical difference (Figure 4). Furthermore, comparing students who were classified as overweight and obese, there was no statistical difference between men (mean=93.9) and women (mean=94.9) in relation to the average BHI-for-age, with women with higher BHI-for-age value. This behavior was also identified by Neutzling et al [16], in a city in southern Brazil, who found a prevalence of obesity of 10.6% among girls and 4.8% among boys.
Most adolescent students had adequate BMI/Age, being classified as eutrophic. However, a considerable number of students were overweight for their corresponding height and age, reproducing a pattern already reported in other works. Overweight was more evident compared to underweight. There was no correlation of this nutritional dysfunction with age or gender, however, BMI/Age was higher in females. The average daily caloric intake was not consistent with the recommended daily caloric intake, with calories consumed being lower than those suggested for metabolism, leading to the belief that there may be a significant consumption of “empty calories” through low-nutritious foods, with high caloric density, rich in added sugars and fats, but low in fiber, vitamins and minerals. Comparing the data from this study with important national surveys, it can be inferred that over the last 10 years, at least, there has been no improvement in the pattern of overweight among Brazilian adolescents.


