Impact Factor : 0.548
- NLM ID: 101723284
- OCoLC: 999826537
- LCCN: 2017202541
Shreya Seth1*, Alasdair JA Santini1,3, Matt Gornall2, Andrew Phillipson1, John S Davidson1, Joanne V Banks1, Jill A Pope1 and Joanne Yorke1
Received: November 24, 2022; Published: January 17, 2023
*Corresponding author: Shreya Seth, Lower Limb Arthroplasty Unit, Department of Orthopaedics, Broadgreen Hospital, Liverpool University Hospitals NHS Foundation Trust, Liverpool, L14 3LB, UK
DOI: 10.26717/BJSTR.2023.48.007603
Background: Obesity is major world-wide health issue; simultaneously, there is an increase in knee arthroplasty. Some heath authorities withhold surgery to morbidly obese groups, citing poorer outcomes and higher levels of complications. Current literature analyses outcomes and complications, but there is a paucity of data in outcomes of obese patients, dependent on implant type.
Methods: We identified 401 patients, 253 cruciate-retaining and 148 bicruciate- stabilising implants, from our hospital registry. Patients were analysed according to body mass index (BMI) as well as WOMAC and Oxford scores.
Results: In total, 50.3% of patients were classified in the obese category (BMI range 30-40 kg/m2); over 80% were over-weight or obese (BMI range 25-40 kg/ m2) and 2.2% of patients were morbidly obese (BMI over 40 kg/m2). In comparison, 15.5% of patients had a normal weight. Both implants demonstrated post-operative score improvements, which was seen across all sub-groups. The morbidly obese group showed the greatest improvement. There was no statistical difference between the adjusted means and means difference in WOMAC and Oxford scores respectively for either implant (p>0.05). No significant difference was noted for either implant using WOMAC and Oxford scores post-operatively. A total of seven patients had post-operative complications, with 57% of these patients being categorised as obese.
Conclusion: There is no difference in outcome, measured by either WOMAC or Oxford scores, in either cruciate-retaining or bicruciate-stabilising knee replacement, across the BMI scale. Complications were higher in the obese group, although not statistical significance.
Keywords: Knee Arthroplasty; Body Mass Index; Obesity
Abbreviations: NJR: The National Joint Registry; PROMs: Patient Recorded Outcome Measures; WOMAC: Western Ontario and McMaster University; OKS: Oxford Knee Score; MG: Medical Statistician
The National Joint Registry (NJR) reported over 1,193,000 primary knee replacements had been performed between 2003 and 2018 [1]. Total knee replacements (TKR’s) are an economic, effective treatment for alleviating arthritic knee pain; its success is demonstrated in Patient Recorded Outcome Measures (PROMs) improvements [2]. The NJR reports 97.4% of primary knee replacements listed ‘osteoarthritis’ as surgery indication, with correlations between increased body mass index and knee osteoarthritis [1-3]. Body mass index (BMI) is a ratio of weight to height squared classified as: underweight BMI of less than 20 kg/m2; normal weight 20 to 24.9 kg/m2; overweight 25 to 29.9 kg/m2; obese 30 to 39.9 kg/m2; and morbidly obese with a BMI over 40 kg/m2 [4]. Whilst widely used, BMI does not account for gender, ethnicity, fat/muscle/bone mass ratio or fat distribution. Obesity is a major world-wide health issue. The United Kingdom’s (UK’s) 2018 statistics demonstrated 56% of adults were at increased chronic disease risk due to waist circumference and BMI [5] Additionally, 26% of men were obese, with 2% morbidly obese; 29% and 4% of women being obese and morbidly obese respectively. These proportions have increased with age.5 Due to increased complications, obese patients have been excluded from knee or hip arthroplasties [6,7]. Equally, some authors have found significant functional gain in obese patients, therefore should not be excluded solely on their weight [8,9]. Newspapers report care commissioning groups are restricting surgery to obese patients until a set amount of weight is lost [10,11] . This results in an ethical conundrum that requires discussion between patient, surgeon and health authority [12]. There is vast data which assesses knee arthroplasty outcomes in obese patients, however there is a level of paucity in outcomes across BMI groups and implant design. The Genesis II TKR (Smith and Nephew, Watford, UK) was introduced in 1996 [13].
Design principles include external femur rotation, patella tracking and deeper trochlear groove; it is available in cobalt-chromium or oxidised zirconium/niobium alloy femoral components, with standard metal and all polyethylene tibial bases.13 There are a large number of publications confirming its good short, medium and long-term survival [13,14]. In 2012, the Journey II TKR (Smith and Nephew, Watford, UK) was based on kinematic movement, thus improving outcomes [15,16]. This was achieved by replicating anterior and posterior cruciate function through cam and peg construct; a concave medial but convex lateral tibial insert replicates movement; and varus joint line to replicate knee anatomy [16]. It is available with oxidised zirconium/niobium alloy femoral component; this has better wear and lower friction coefficient [17-22]. Oxidised zirconium implants have been shown to have good survival in the short, medium and long-term [17,19,21,23,24] We undertook a study to assess functional outcomes of two knee arthroplasties and BMI.
Patients undergoing TKR’s had demographic and clinical data prospectively entered. Pre-operatively, clinical physiotherapists saw all patients. Range of movement (ROM) and outcome scores were noted, such as Western Ontario and McMaster University (WOMAC) and Oxford Knee Score (OKS). The WOMAC has four pain questions, two stiffness questions and 17 function questions, totaling 96 points. A lower score indicates better outcome. The OKS has 12 questions giving a total score of 48. A lower score indicates a worse outcome. A goniometer records range of movement (ROM) at extension, fixed flexion deformity and maximum flexion. Post-operatively, data is captured in the same way, added to the registry and repeated at 12 months, three, five, seven and ten years. Minimal clinical improvement score was assessed for both scores; WOMAC was set as a 15 point decrease and OKS as a 5 point increase [25-28]. All operations were undertaken in laminar flow theatres by four consultant surgeons (AJAS, JSD, JVB and AP) or by a senior surgical trainee under the direct supervision of those surgeons, with identical post-operative routine rehabilitation. Surgery was undertaken using single-dose cefuroxime antibiotic prophylaxis, under tourniquet control and using either CMW II cement (DePuy, Leeds, UK) or Palacos cement (Heraeus Medical, UK). All patients had a standard post-operative regime: thromboprophylaxis with Fragmin for ten days, TED stockings and early mobilisation. Patients were seen pre-operatively by a senior physiotherapist (JP & JY), with outcome scores and ROM recorded. The data was added prospectively to the registry. Patients who were at least one-year post-operative and had either of the two implants were included. All Journey II implants had zirconium femoral components and were bicruciate-stabilising. All Genesis II implants had cobalt-chromium femoral components and were cruciate-retaining. A total of 401 knee replacements were identified, consisting of 148 Journey II and 253 Genesis II implants. Data was assessed by a using a mixed model (SAS proc mixed) to test for treatment differences and BMI class differences in the change in both WOMAC and Oxford scores. Counts and percentages were presented for those who did and did not reach minimal clinical improvement; binomial test was used to test for a difference between BMI class and overall.
For all scoring systems, the changes from pre-op to post-op were calculated and descriptive statistics of the changes were summarised. All mixed model adjusted for patient’s baseline scores to account for potential imbalances. Kruskal-Wallis testing was used to assess differences between the two treatments for these changes. A two-sample Wilcoxon was used for pairwise comparisons, when there was a significant Kruskal-Wallis test. For analysis of complications, Fischer’s exact test was used. All statistical tests were performed at 5% level, with all significant tests highlighted in bold. We hypothesised was that there was no difference between the outcome scores and range of movement between the two implants, across all the BMI sub-groups.
Ethical approval for the registry containing patient data was obtained locally through the Liverpool Research Trials Centre (refs 1893 and 2060). Early data was held on a database in Scotland, requiring ethical approval through the Multi-Centre Research Ethics Committee for Scotland (ref MREC/04/10/004); they classified this data as audit data, thus not requiring a formal review by an ethics committee.
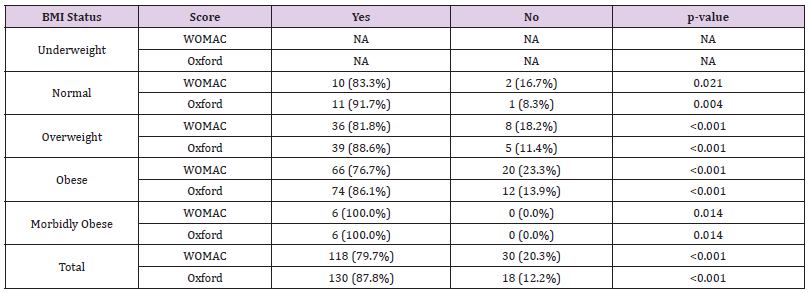
A total of 401 knee replacements were analysed (Table 1) shows BMI status, with over 50.3% of patients classified as obese (BMI between 30 and 40 kg/m2); over 80% were over-weight or obese (BMI between 25 and 40 kg/m2) and 2.2% of patients were morbidly obese (BMI over 40 kg/m2). In comparison, 15.5% of patients had a normal weight. In the Genesis II group, 19.8% were or normal weight; 32.8% overweight and 45.8% obese which gave them a wider spread over the categories compared to the Journey II cohort who had 8.1% normal weight; 29.7% overweight; and 58.1% obese. In the morbidly obese group, five patients (2%) were in the Genesis II cohort and six patients (4.1%) in the Journey II cohort. In total, 59.6% of patients were female, with 57.3% in the Genesis II cohort and 63.5% in the Journey II cohort (Table 2). shows WOMAC and OKS changes for both implants. Both implants show post-operative score improvement, across all BMI sub-groups. The morbidly obese group show the greatest numerical improvement. However, as seen in adjusted means and adjusted mean difference in WOMAC and Oxford scores (Tables 3 & 4) respectively, the gains shown for the Genesis II and Journey II implants were not statistically significant different in any BMI class (p> 0.05), following baseline score adjustment (Tables 5 & 6). compare WOMAC and OKS differences for each implant, across BMI sub-groups, from pre-operation to post-operation. There were no statistically significant differences in any BMI class, for either implant, in either score (p> 0.05). In the Genesis II cohort, there was a significant improvement in post-operative knee flexion overall, as well as the overweight and obese patient groups. However, the underweight, normal weight and morbidly obese categories did not (Table 7). Overall, there were significant improvements in post-operative degree of flexion for the Journey II cohort, as well as all sub-groups, excluding morbidly obese (Table 8). In the Genesis II cohort, pre-operative average range of movement was 96.9˚(standard deviation of 19.20) and post-operatively, this improved to an average of 112.9˚(standard deviation of 15.6). Overall, this cohort achieved an average improvement of 15.9˚.
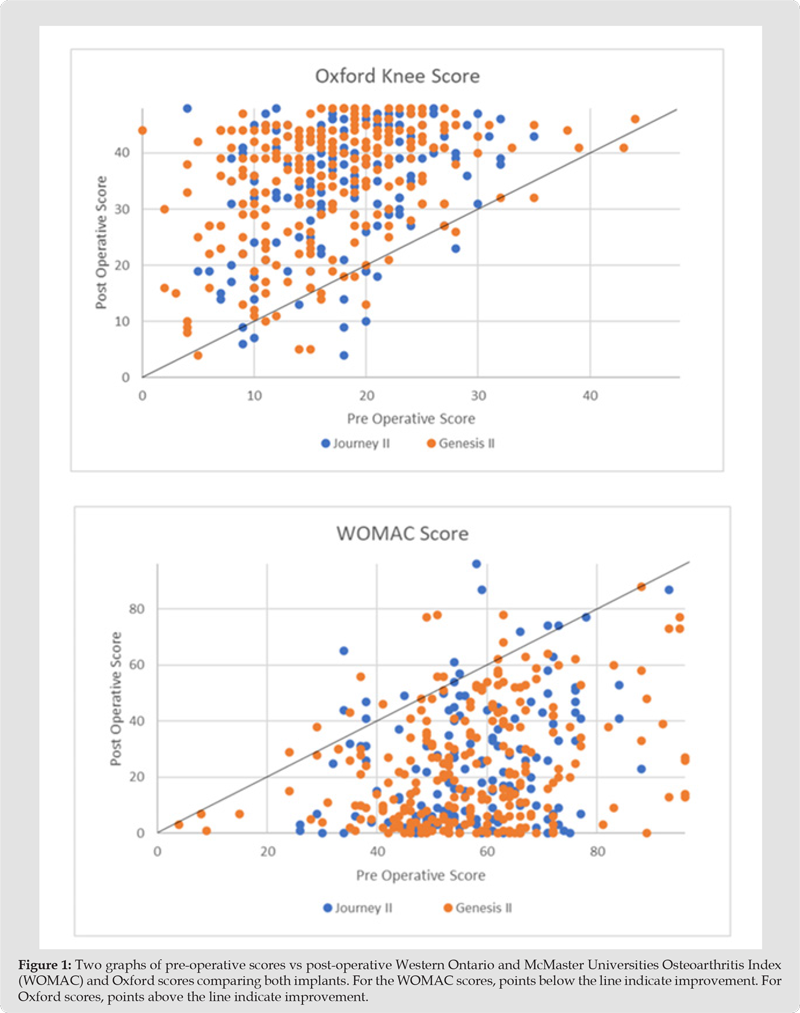
In the Journey II cohort, the pre-operative average range of movement of was 95.4˚(standard deviation of 20.2) and post-operatively, this improved to an average of 104.9˚ (standard deviation of 13.1). Overall, this cohort achieved an average improvement of 9.5˚. The minimal significant improvement was achieved for all groups in the Genesis II cohort, for both PROMs, except the underweight group. For the Journey II cohort, the minimal significant improvement was achieved in all groups for both PROMs (Tables 9 & 10). (Figure 1) shows a comparison of pre-operative to post-operative scores. This shows the majority of patients improve after surgery in both implants. In the WOMAC graphs, points below the line indicate an improvement in scores and in the OKS groups, points above the line indicate improvement in scores. The improvement in both scores for each implants was significant (p< 0.05). Although the pre-operative WOMAC score in the Genesis II cohort was higher and hence worse with a higher BMI, this was not significantly different. Post-operatively, this trend remained with a higher BMI returning a worse WOMAC score, but this was not statistically significant. In the Journey II cohort, the higher BMI patients had a better, but not significant, pre-operative score and a worse, but not significant, post-operative score. In the Journey II cohort, the pre-operative scores were worse for the higher BMI patients, but not significant. Similarly, the post-operative scores were worse for the higher BMI groups, but not significant. Overall, the post-operative improvement was slightly better for the higher BMI in the Journey II cohort and slightly better for the lower BMI in the Genesis II cohort, but neither were significant.
Table 2: Change in Western Ontario and McMaster Universities Osteoarthritis Index (WOMAC) & Oxford Knee Scores.
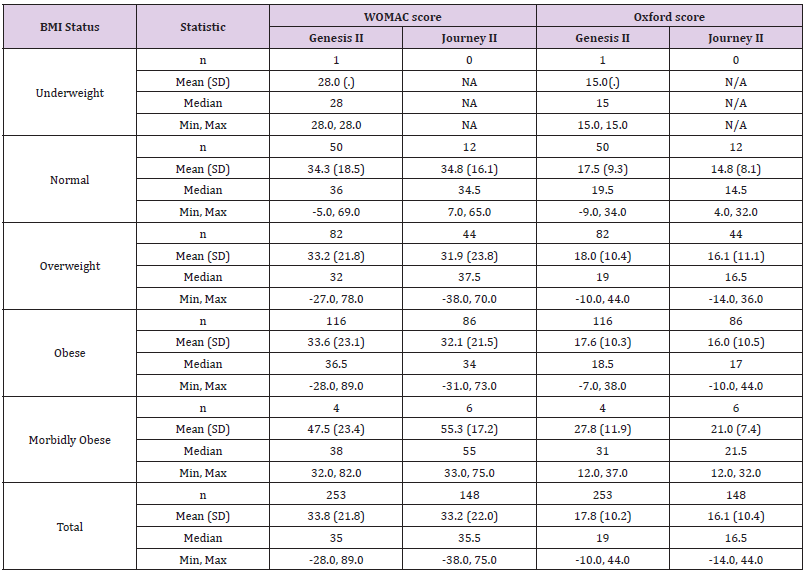
Table 3: Change in adjusted means and adjusted mean difference in Western Ontario and McMaster Universities Osteoarthritis Index (WOMAC) scores (adjusted for baseline scores).

Table 4: Change in adjusted means and adjusted mean difference in Oxford Knee Scores (adjusted for baseline scores).

Table 5: Body mass index (BMI) comparison of adjusted means and adjusted mean difference in Western Ontario and McMaster Universities Osteoarthritis Index (WOMAC) scores (adjusted for baseline scores - 95% confidence intervals in brackets).
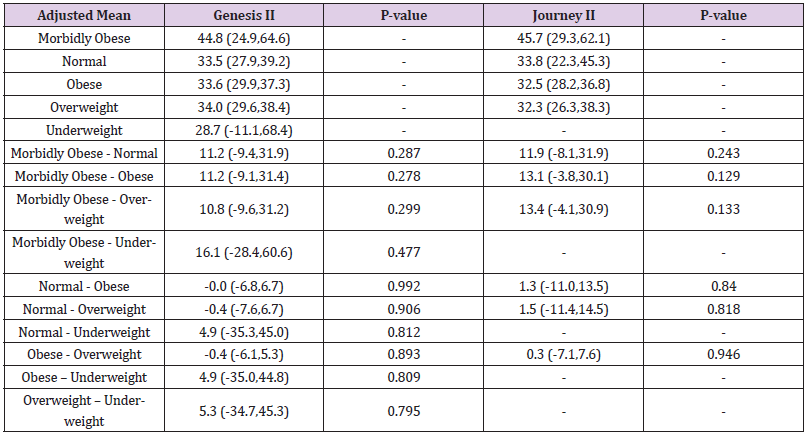
Table 6: Body mass index (BMI) comparison of adjusted means and adjusted mean difference in Oxford Knee Scores (adjusted for baseline scores - 95% Confidence intervals in brackets).
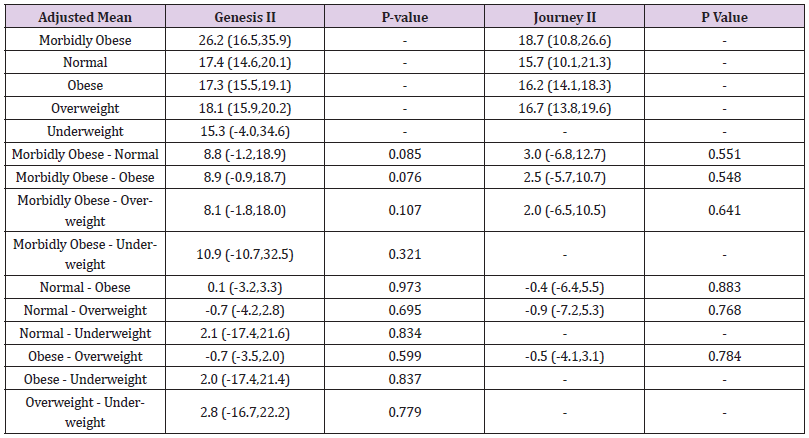
Table 7: Summary of preoperative and postoperative Genesis II knee flexion results, grouped by body mass index (BMI).
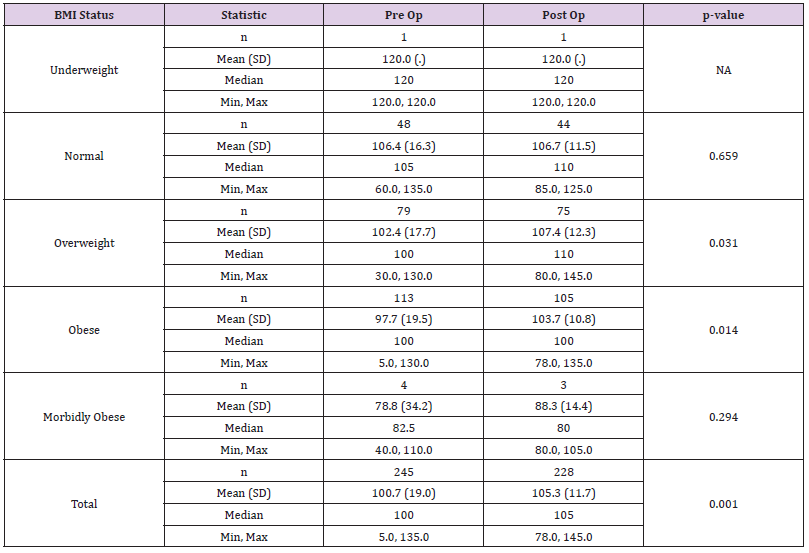
Table 8: Summary of preoperative and postoperative Journey II knee flexion results, grouped by body mass index (BMI).
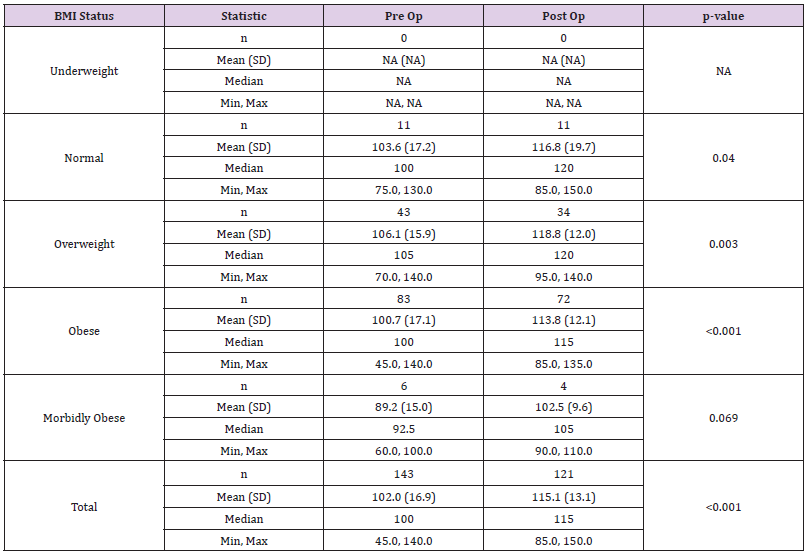
Table 9: Genesis II - minimal clinical improvement in Western Ontario and McMaster Universities Osteoarthritis Index (WOMAC) and Oxford score.
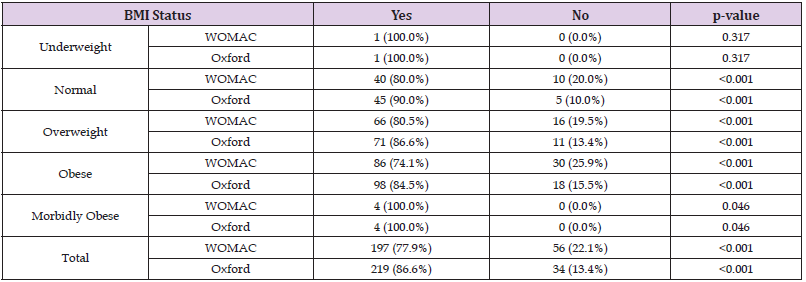
Table 10: Journey II - minimal clinical improvement in Western Ontario and McMaster Universities Osteoarthritis Index (WOMAC) and Oxford score.
Seven patients (1.7%) had a recorded post-operative complications recorded, all of whom had a Genesis II implant. Five of these patients were female and of the seven, one patient was categorised as underweight, one patient was overweight and five patients were obese. Two patients reported episodic knee pain, one at their one-year follow up and one at their two-year follow up. Three patients had culture positive wound infections, of which one was underweight and two were obese. One of the obese patients had a DVT in addition to a wound infection. One patient, who was in the ‘overweight’ category, required a manipulation under anaesthesia for post-operative stiffness. There were no patients within the Journey II category with recorded post-operative complications. Using a Fisher’s exact test, with low proportions of total complications per BMI status, there was no statistically significant difference in proportions of complications by BMI status (p=0.300).
Figure 1 Two graphs of pre-operative scores vs post-operative Western Ontario and McMaster Universities Osteoarthritis Index (WOMAC) and Oxford scores comparing both implants. For the WOMAC scores, points below the line indicate improvement. For Oxford scores, points above the line indicate improvement.
In 2017, The Times newspaper reported the NHS had introduced ‘unprecedented’ bans on surgery including an end to the routine funding of hip and knee operations for patients with osteoarthritis; they highlighted one authority in England imposing two year waits on obese patients [10]. In the same year, The Independent newspaper reported that two NHS commissioning groups were to deny non-urgent surgery to patients with a BMI over 40 kg/m2, unless they could reduce it over a nine-month period to an amount of 15% of their weight.11 They reported that patients with a BMI of over 30 kg/m2, but under 40 kg/m2, would be required to reduce 10% of their weight or reduced their BMI to under 30 kg/m2. The media, coupled with restrictions imposed by health authorities, place surgeons under pressure to decide on whether to offer surgery to higher BMI patients. The dilemma centers around whether there are functional gains, despite the complication and revision rate; if not, is it ethically acceptable to refuse surgery [12]. There is little doubt of the causal link between obesity and osteoarthritis. Gillespie discussed multiple reasonings behind the link, quoting numerous studies highlighting obesity as a risk factor, which causes disease progression [2]. Miric reported on 512 knee arthroplasties, showing there was a positive correlation between BMI and cardiac history, diabetes, hospital stay greater than a week and risks of post-operative complications [29]. The greatest differences were with patients with a BMI over 35 kg/m2 [30]. Whilst 16% of the population are of the obese category, they reported that 27% of their group were obese and our data shows 50.3% of patients were.
Abdulla reported in a series of almost 16,500 total knee arthroplasty [30]. When compared to normal weight patients, the over 30 kg/m2 BMI group underwent arthroplasty 2.7 years earlier; this rose to 4.6 years when the BMI was >35 kg/m2 and to 7.6 years when the BMI was over 40 kg/m2.30 Baker reported on BMI’s effect on functional improvement score in 1,367 patients.31 Outcomes were measured using WOMAC and SF-36. Patient satisfaction was noted pre-operatively and recorded up to three years post-operatively. They concluded all BMI sub-groups benefited from TKR’s, with the highest group including BMI greater than 35 kg/m2. The combined obese and morbidly obese had lower pre-operative WOMAC and SF-36 scores, compared to patients with lower BMI, but demonstrated equivalent improvements. However, they were less satisfied with the procedure; 70% reported they would have the procedure again, compared to 82% in patients with a BMI less than 25 kg/m2. It was concluded patients with higher BMI’s should be offered a knee arthroplasty, on the understanding that their function and satisfaction may not be similar to patients’ with a lower BMI [31]. Wenjun reported similar findings in almost 300 patients undergoing TKR’s [32]. They showed that 15% were obese and 9% morbidly obese. This combined group was statistically more likely to have worse mental health scores, have a lower household income and have more medical co-morbidities. However, whilst these patients had worse pre-operative SF-36 and post-operative scores, functional gain did not differ across BMI range. Additionally, patients with greater levels of obesity had more pre-operative pain, but greater post-operative pain relief. They concluded that obesity per se is not a arthroplasty contraindication [32].
Our study echoes previous studies result’s; not only did the majority of patients improve in their scores, there was also no significant difference between BMI subgroup outcomes. We found that the morbidly obese sub-group improved marginally more than other sub-groups, albeit not statistically significant. This may be due to the smaller sample size, with only 10 patients across both prosthesis, accounting for 2.5% of the patients. Foran reported on the link between increased body weight, knee osteoarthritis and subsequent arthroplasty outcomes.7 They compared 78 total knee arthroplasties in obese patients, with a matched group of non-obese patients. Eighty-eight percent of the obese group achieved a Knee Society Score of greater than or equal to 80 points, but this was significantly lower than the 99% rate in the non-obese group. The morbidly obese sub-group also had a significantly higher revision rate than the non-obese group. Collins reported on 445 consecutive knee replacements, comparing outcomes between non-obese, obese and morbidly-obese patients [9]. It was found that as patient weight increased, clinical outcome was adversely affected [9]. However, significant improvements were seen in all BMI sub-groups till nine years, with no significant difference in peri-operative complications or implant survival. They concluded there was no justification in limiting knee arthroplasty access in obese patients. Regarding complications, infection was reported to be two times higher in patients with a BMI over 35 kg/m2 and four times higher in patients with a BMI of over 40 kg/m2 [33].
In addition, infection was significantly higher in patients with a weight over 100kg, irrespective of BMI.33 Gallo has reported re-operations in 5.8% of 1,885 patients, with a higher prevalence in higher BMI, regardless of sex [34]. Our cohort showed 1.7% of patients developed post-operative complications, five of which were obese. Therefore, we found over a 2-fold increase in complication risk in patients classified as obese. No patients within the normal or morbidly obese categories had complications recorded, with none occurring in the Journey II cohort, making it difficult to draw any further conclusions. Our study echos previous papers and adds information about implant design. It is well documented that TKR’s are a successful treatment option in the majority of patients, and this study demonstrated improvements in two common scoring systems. However, there was no difference in scores through the BMI range, with no sub-group scoring a better outcome than any other. This was true for actual gain in score and for adjusted means. In addition, neither mechanism type (cruciate-retaining or bicruciate-stabilising) showed any difference in any BMI subgroup, in either score. An increased level of complications is sometimes used as a justification to withhold arthroplasty in obese patients. Our results demonstrated more complications in the obese group, albeit not statistically significant.
Springer discussed the implications of withholding total joint arthroplasty in a prospective study of 289 morbidly obese, end-stage osteoarthritis patients (mean age of 56 years) [35]. At the initial visit, patients had an average BMI of 46.9 kg/m2 and were given information about the risks of arthroplasty in the morbidly obese and bariatric referral information.They were followed up at six, 12, 18, and 24 months. Eighty-two patients refused to follow-up or answer phone surveys, and 149 of the remaining 207 (72.0%) did not have surgery. The initial median BMI of those 149 was 47.5 kg/m2 and at last follow-up was 46.7 kg/m2. Only 67 patients went to the bariatric clinic, with 14 having bariatric surgery. Fifty-eight patients underwent arthroplasty surgery, with average initial BMI measuring 45.3 kg/m2 and average surgery BMI being 42.3 kg/m2. Only 23 patients of those who had a TKR achieved BMI < 40 kg/m2 at surgery. They concluded that restricting arthroplasty for morbidly obese patients does not incentivise weight loss prior to surgery. Meller reported that in over 2.7 million arthroplasty patients recorded in the Medicare Data System, almost 26,000 had had bariatric surgery [36]. However, trends suggested that complications from prosthetic failure was higher in those patients after bariatric surgery; complications were higher in almost every category of bariatric surgery; and higher readmission rates in patients with more aggressive bypass surgery. In the morbidly obese post-bariatric surgery group, there was no improvement in complications compared to the same group who had to undergone bariatric surgery. Their conclusions were that the immediate risk for patients is based on the highest BMI achieved in their lifetime, rather than at the time of surgery, and that bariatric procedures are not sufficient to normalise the risk of knee surgery.
Pillutla discussed the ethics behind rationing of surgery to patients with obesity and those who smoke [12]. They argued that rationing of surgery needs to be assessed in two ways: can rationing be justified regarding outcomes and can rationing be justified on the premise of patient responsibility. In either case, it must be &‘fair.’ They argue that where obesity has significant implications for elective surgery outcomes, rationing can be justified on prognostic grounds. Equally, it is permissible to aim to maximise the benefit provided by limited resources, especially for interventions that are not urgently required. Hence, in knee arthroplasty, which can rarely be categorised as urgent, where there are a number of papers which quote higher complications rates in obese and morbidly obese patients, and that the NHS has limited resources, then one can justify rating on the premise of outcomes [33,34]. However, patients who are severely and morbidly obese are more likely to have compounding factors. This includes female, have worse mental health scores, lower household income, back pain and more medical co-morbidities. Therefore, it can be argued that it is not ‘fair’ to place personal responsibility upon them as they are less likely to be able to react to it [32].
Our study has limitations. The data was collected from a prospectively collated registry, it was retrospectively analysed and was a non-randomised study. There are slight variations in the spread of patients across the BMI groups, which may affect the results. However, statistics showed no evidence of any sub-group approaching significance, meaning it is unlikely that results were affected. Outcome scores were based on the patient’s subjective interpretation of the WOMAC and OKS questions. Questionnaires can be confusing where they have double-barrel sections.37 When patients are asked questions about their symptoms, they are asked to differentiate the problematic knee from the unaffected knee. Patient’s symptoms may have improved after the knee arthroplasty, but due to the other knee becoming painful and arthritic, their PROM score may not be representative. The underweight and morbidly obese accounted for 0.2% and 2.2% of the cohort respectively, which may skew the results.
There is no difference in outcome as measured by either WOMAC or OKS, in either a cruciate-retaining or bicruciate-stabilising knee replacement, across the BMI scale. Complications were higher in the obese group, but did not reach statistical significance.
The authors declare that they had no conflicts of interest at the commencement of data into the registry but subsequently Smith & Nephew have sponsored a Knee Fellow at Liverpool University Hospitals Foundation Trust. AJAS has received speaker honorarium from Smith & Nephew.


