info@biomedres.us
+1 (502) 904-2126
One Westbrook Corporate Center, Suite 300, Westchester, IL 60154, USA
Site Map
Received:November 11, 2022; Published:December 14, 2022
*Corresponding author: Maxwell A Oppong, Department of Telecommunication Engineering, Kwame Nkrumah University of Science and Technology, Kumasi, Ghana
DOI: 10.26717/BJSTR.2022.47.007529
This paper designs different emitter identification and classification techniques using feature fusion. The underlying concept of the proposed method is that features extracted by Circularly Integrated Bispectrum (CIB), Axially Integrated Bispectrum (AIB), Radially Integrated Bispectrum (RIB) are fused together using Canonical Correlation Analysis (CCA) to form a very discriminatory feature vector that gives very high average recognition rate. K-Nearest Neighbor (KNN), Naive Bayes (NB) and Support Vector Machine (SVM) classifiers are used to train and test feature vectors of each of the above techniques. A performance analysis of each of these techniques with each classifier is accessed. Square Integral Bispectrum (SIB) fused with Principal Component Analysis that is a single Integral Bispectrum method is trained and tested with each of the classifi ers. Finally, the results of experiments conducted on the emitter samples and features for these technologies at different Signal-to-Noise Ratios (SNR) of 0-12dB and testing data sets between 0.1 - 0.9 shows that CCA-based feature fusion methods have a good average recognition rate than the single feature method.
Index Terms: AIB: Axially Integrated Bispectrum; CCA: Canonical Correlation Analysis; CIB: Circularly Integrated Bispectrum; RIB: Radially Integrated Bispectrum; IMEI: International Mobile Station Equipment Identity; EMD: Empirical Mode Decomposition; RFF: Radio Frequency Fingerprint; ITD: Intrinsic Time-Scale Decomposition; SNR: Signal-to-Noise ratio; PCA: Principal Component Analysis; KNN: K-Nearest Neighbor; NB: Naive Bayes; OFDM: Orthogonal Frequency Division Multiplexing
IN the past, the identity of a cell phone has been determined, using International Mobile Station Equipment Identity (IMEI) or International Mobile Subscriber Identity (IMSI) numbers. IMEI and IMSI provide information on an individual cell phone and Subscriber Identity Module (SIM) card, respectively. However, these methods are not perfect. As it is stress-free to change SIM cards in a cellular phone, using IMSI for the identification of cellular phones is unreliable. IMEI contains, among others, a serial number of the device, which is ideal for identification of the device. However, with the correct tools and skills, the IMEI can be counterfeit or cloned, preventing any chance of identification [1,2] Emitter Identification is considered a pattern recognition problem where patterns in emitted signals are recognized to determine the identity of an emitter. Emitter Identification and classification is a challenging problem concentrated on the extraction of target features from the available raw data, as the recognition performance is powerfully determined by the characterization power of the features. An author used a method of Empirical Mode Decomposition (EMD) in Radio Frequency Fin- gerprint (RFF) that was used to analyze transient signals. [3]. Another author came out with a novel method based on Intrinsic Time-Scale Decomposition (ITD) that was used in identifying and classification of communication and radar signals and gave a very high recognition and accuracy rate [4]. Another research also proposed the use of bispectrum of the signal as a feature set for underwater target classification and neural network classfier with back [5] propagation algorithm has been trained with the set feature sets.
On the other hand, a higher order statistic is used in the identification of radar emitters which is used to select feature from various sources of emissions by the method in [6]. However, a new method [7] was proposed, to solve the identification and classification of transmitters of the same model using the same SVM combined with kernel function which seeks to give better recognition rate in low Signal-to-Noise ratio (SNR). In addition, a new method in [8] has been proposed for the identification of individual radio transmitters with the same model. Another method in [9] is proposed when the Radially Integrated Bispectra (RIB), Axially Integrated Bispectra (AIB), and Circularly Integrated Bispectra (CIB) has been used and redundancy became a problem and rendered the classification process not very accurate and efficient. A new method in [10] has been proposed to classify radio transmitters with the same model and to design an efficient classifier in the shape of SVM based on Gaussian kernel function. Principal Component Analysis (PCA) has been used in the dimensionality reduction process to lower-dimensional feature vector.
The problem is with the feature extraction method using only Axially Integrated Bispectrum (AIB), Radially Integrated Bispec trum (RIB) and Circularly Integrated Bispectrum (CIB). The above-mentioned methods have various disadvantages as the AIB losing a great part of the phase information, RIB losing the scale variance and CIB keeping only part of the phase information respectively. Finally, the novel approach will cater for the above issues and will design solutions to mitigate the listed problems. Feature fusion technique known as Canonical Correlation Analysis (CCA) is used to combine the feature vectors extracted by AIB, RIB, CIB fused with PCA to form fused CIB-RIB method, fused CIB- AIB method and fused RIB-AIB method and compare with SIB method fused with PCA. A comparative analysis is looked into based on the recognition rates with respect to each of the methods used in the feature extraction process and the classifier used in training and testing the data samples. Performance analysis is assessed in the design procedure of a classification system with different classifier systems. Classifiers that will be considered are the K-Nearest Neighbor (KNN), Naive Bayes (NB) and Support Vector Machine (SVM). The contribution to this paper is as follows:
1) This paper has developed a number of techniques that will be
used to extract features, combine these features extracted by
different methods and classify emitters.
2) Again, based on the numerous problems of using the single
integral bispectrum techniques to extract the features of the
emitters, the innovation is to use the feature fusion technique
to combine any of the two techniques above to mitigate the
problems and increase the average recognition rate of the
emitters involved.
To solve the above listed problems and increase the recognition rates of the various emitters, the signal processing scheme introduced in this paper is achieved by the following steps. In the first step, RIB, AIB and CIB techniques are used to extract the features from the various emitters. Secondly, the RIB, AIB and CIB vectors provided by different raw samples are fused together in pairs using feature fusion technique known as Canonical Correlation Analysis (CCA) to obtain the different fused feature vectors. The next step is to use Principal Component Analysis (PCA) method to reduce the dimensions of the fused feature vectors to obtain a low dimensional feature vector with less complexity. Lastly, the modulation parameters of individual emitters significant to classification are combined with the low- dimensional fused vectors to form a single characteristic vector. A comparative performance analysis is done with features extracted by only SIB/PCA method. Training and testing portions of the sample data will be looked at in terms of the divisions in training set, test set data and at different Signal-to-Noise Ratio (SNR) of 0-12dB range for the various classifiers used in the classification process.
The rest of the paper is organized as follows: In sections 2 and 3, feature fusion techniques using Canonical Correlation Analysis (CCA) to form the fused CIB- RIB, fused CIB-AIB and fused RIB-AIB techniques are discussed. Section 4 discusses the design of the classifiers used in this paper. The performance of different classifiers with the various fusion techniques are investigated in section 5 to show that the feature fusion technology combined gives a higher recognition rate compared to the individual techniques. Section 6 concludes the paper.
Feature Fusion
Feature fusion is a new method of feature extraction where different features are combine together to form a very powerful feature vector that gives a very high recognition rate. Some of the advantages are that it im- proves the average classification accuracy, reduce ambiguity between the various features, reduces redundancy and uncertain information, feature enhancement and improved reliability. By optimizing and combining these different features, it not only keeps the effective discrimenant information of multi-feature but also eliminates the redundant information to certain degree.
Canonical Correlation Analysis (CCA)
A new feature extraction method, based on feature fusion, according to the idea of canonical correlation anal- ysis (CCA), is propose in this paper. The overall process comprises extracting two groups of feature vectors with the same pattern; establishing the correlation criterion function between the two groups of feature vectors and extract their canonical correlation features in order to form effective discriminant vectors for recognition. CCA is one of the valuable multi-data processing methods [11]. In recent years, CCA has been used in various elds such as signal processing, computer Vision, and sound recognition [12,13] and has induced great attention. In this paper, a new method of feature fusion is proposed by adopting the idea of CCA.
Theory and Algorithm of Combine Feature Extraction
Suppose R1, R2, · ·, Rc are known emitter classes. LetΩ = {φ|φ ∈ ℜn}is a training sample space. Given that X = {x|x ∈ ℜp}. Where X and Y are two feature vectors of the same sample extracted by different means respectively. In this section, two of each of the various types of features extracted by the integral Bispectrum methods, namely Circularly Integrated Bispectrum (CIB), Axially Integrated Bispectrum (AIB) and Radially Integrated Bispectrum (RIB) are combined by Canonical correlation Analysis (CCA) to form a single feature vector, which is more discriminative than any of the input feature vectors. Assume that X ∈ℜn× p and Y ∈ℜn× p are two matrices, each containing N training feature vectors from two integral Bispectrum methods. Let Σxx ∈ℜ p× p and Σyy ∈ℜ q q× represent the within -class covariance matrix.
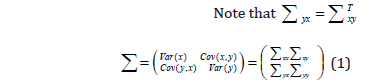
Note that the correlation between the various feature vectors follow a consistent pattern. CCA
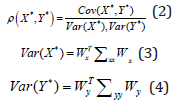
Optimization is performed using Lagrange multipliers by maximizing the covariance between X• and Y• subject to the constraints,
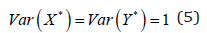
The transformation matrices,Wx and Wy are calculated by solving the eigenvalue equations
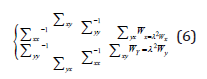
Where Wx and Wy are the eigenvectors and λ2 is diago nal matrix of the eigenvalues or the square of the canonical correlations. The number of non-zero eigenvaluesor the square of the canonical correlations. The number of nonzero eigenvalues in each equation d = rank (Σxy) ≤ min(n, p, q) that is selected in descending order λ1 ≥ λ2 ≥, · · ·, ≥ λd.The transformation matrices and Wy , consist of the selected eigenvectors corresponding to the nonzeroe igenvalues. X∗, Y ∗ ∈ℜd×n is known as the canonical variates. For the transformed data, the sample covariance matrix defined in Eq. (6) will be of the form
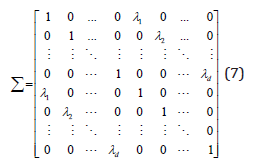
The matrix above shows that the canonical variates have nonzero correlation only on their corresponding indices. The identity matrix in the upper left and lower right corners show that the canonical variates are uncorrelated within each data set. Feature fusion is performed either by concatenation or by summation of the transformed feature vectors [13].
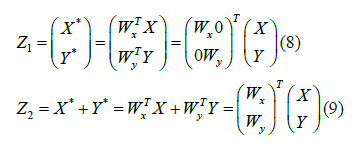
Where Z1 and Z2 are called the Canonical Correlation Discriminant Features (CCDFs). In this paper, the con-catenation method in (7) is used to fuse the Integral Bispectrum features. The fused feature vectors (Z) are used to form the feature vectors for each of the transmitting emitters [14].
Fusing Integral Bispectra Methods
This section deals with the various integral methods fused together to increase the characterization power of feature vectors generated by different methods fused together. The dimension of the fusion method is 2-D and compare with the 1-D feature vector methods. The fusion techniques seek to solve various problems with the single integral bispectra methods. Circularly Integrated Bispectrum (CIB) keeping only part of the phase information on the bi-frequency plane, Axially Integrated Bispectrum (AIB) losing greater part of the losing the scale variance characteristics of the Bispectrum. Fusing the above mentioned schemes give an optimal feature vector sets. The next section deals with the various methods fused together.
Fusing CIB with AIB
In this technique, the features of the mobile phones are extracted with the Circularly Integrated Bispectrum (CIB) and Axially Integrated Bispectrum techniques and fused together to form a single feature vector of strong characterization power. CIB and AIB are fused together by the Canonical Correlation Analysis (CCA) method. Fusing the two feature extraction method will increase the feature vector and increase the overall performance in terms of recognition accuracy. The block diagram in (Figure 1) illustrates the fusing method.
Method and Place of the Research: This study, which was designed in a descriptive and cross-sectional manner, aimed to determine the changes in the lifestyles of university students studying in the Central Anatolia Region of Turkey after the pandemic.
Sample of the Research: 714 students who continue their university education in the fall semester of 2022-2023, who do not have a chronic disease or psychological disorder, who can understand and speak Turkish, and who agreed to participate in the research verbally and in writing after explaining the purpose of the study, were included in the study.
Ethical Aspect of the Study: Approval was obtained from the Ethics Committee of Yozgat Bozok University for the study. Statistical Analysis: Analysis of the data was done using IBM 25.0. Standard deviation, percentage and frequency were used in the evaluation of the data.
Figure 1.

Fusing CIB with RIB
The technique fuses the features of the mobile phones extracted by the Circularly Integrated Bispectrum (CIB) method and that of the Radially Integrated Bispectrum (RIB) method to form a single feature vector with very strong characterization power. Fusing the CIB and RIB features together will solve the issue of losing the scale variance by the RIB and part of the phase information by the CIB method, increase the characterization power of the feature vectors, and enhance the recognition rate. The block diagram in (Figure 2) illustrates the technique.
Figure 2.

Fusing RIB with AIB
This is another approach of fusing features extracted from the mobile phones by the RIB method to that of the features extracted by AIB method to form a single feature with a strong characterization power. Fusing RIB with AIB will solve the issue of losing scale variance and greater portion of phase information and increase the characterization power of the features to increase the recognition rate. The block diagram in (Figure 3) shows the process involved.
Figure 3.

The design of the various classifiers that are used for the classification of the emitters on the communication network is of importance to the classification and identification of various emitters. In this paper, the various emitter technologies outlined will train and test the feature vectors with K-Nearest Neighbor (KNN), Naive Bayes (NB) and Support Vector Machine (SVM) Classifiers.
K-Nearest Neighbor (KNN) Classifier
In this paper, KNN is one of the three different classifiers that is used for the classification of the emitters. The fused CIB and RIB, fused CIB and AIB, fused AIB and RIB and SIB/PCA generated features are trained and compare them according to their recognition rates. Specifically, the implementation is based on multi-class classification with Radial Basis Function (RBF) and cross- validation
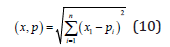
for parameter classification. A discrim-ination function utilized by SVM is defined by tested by the KNN classifier and a performance analysis is accessed on each one of the technologies proposed. Let X be an n-dimensional feature vector generated from both of each of the integral Bispectrum methods, CIB, AIB, and RIB respectively as well as SIB/PCA. The combined methods represent the features of an emitter given as (x1, x2, xn). Each emitter sample has a categorical variable whose value depends on X. Given a training data set; W = {(x1, y1), (x2, y2), · · · , (xn, yn)} for [i = 1, 2, 3, · · ·N] where xi represents the input data and yi represents the class labels. Xi ∈ ℜd and yi ∈ {1, 2, 3, · · ·, 7} multi-class labeling. Suppose there is a test data P, the problem is to determine the class for this new sample. Let X and P be the n-dimensional vectors as representation of the feature vectors of emitters where X = (x1, x2, · · ·, xn) and P = {p1, p2, · ·, pn}. Similarity measure between X and P is measured using the Euclidean distance, (x, p) where in this paper, K = 10 because the number of samples considered is very large and gave a very good recognition rate compared to other values. P is measured using the Euclidean distance, (x, p) where in this paper, K = 10 because the number of samples considered is very large and gave a very good recognition rate compared to other values.
Naive Bayes Classifier
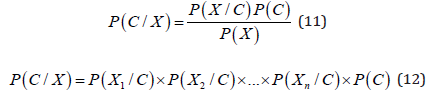
The Naive Bayes classifier is based on the Bayes theorem with independent assumptions between data sets. Despite its simplicity, the naive Bayes classifier often does very well and is widely used because it outperforms more sophisticated classifier algorithms. Bayes theorem provides a way of estimating the posterior probability P (C/X) from P (C), P (X) and P (X/C) where C= number of classes, X = data or features of the emitters. Naive Bayes Classifier assumes that the effect of the value of a feature (X) on a given class (C) is independent of the values of the other features. This assumption is called class conditional independence;
Support Vector Machine (SVM) Classifier
Support Vector Machines (SVMs) have become a widely considered and applied classification technique, especially used in emitter identification and classification. In this paper, we implemented SVM classifiers for different emitter identification and classification technologies and compare them according to their recognition rates. Specifically, the implementation is based on multi-class classi fication with Radial Basis Function (RBF) and cross- validation for parameter classification. A discrim- ination function utilized by SVM is defined by
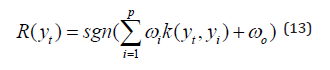
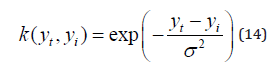
Where p the number of supports is vectors and ω0, ω1, ω2, · · ·, ωp are their weights. The kernel func- tion K (yt, yi) describes the similarity between two vectors yt and yi. The Radial Basis Function (RBF) is implemented.
All the training feature vectors are used by the discrimination functionR(yt), and in the interim, the support vectors and their weights are selected. SVM is presented for identification between two classes of emitters. For identification between two classes of emitters. For classification to multi-emitters, two solutions can be implemented. One is one-against-one (OAO) identification, and a separate classifier is needed between any two classes of emitters. Thus, K (K - 1) /2 SVM classifiers is need to construct the K classes of emitters. This method constructs classifiers where each one is trained on data from two classes. A strategy of Maximizer- Win is utilized for classification to the input sample vectors.
This section outlines the channel modeling and the procedure for data acquisition through the experimental setup. Figure 4 depicts the block diagram of how the data was acquired.The AD9361 software radio platform receives the emitter signal and transforms the signal to baseband. From AD9361, the baseband signal arrives at the PC via the Peripheral Component Interconnect-Express (PCIE), a serial expansion bus standard for connecting a computer to one or more peripheral devices. From the PCIE, the signal is displayed, stored and processed. Experimental Objects: seven (7) smart mobile phones with the same brand and assigned numbers from Emitter 1 to Emitter 7 for the sake of convenience. Receive frequency band- 890MHz-915MHz, 5G antenna sampling 5G uplink signals. Data: At the same interval, every 5G data is sampled for ve (5) times at different time and get 10GHz data for each of the seven phones. The signal length is 5000 and the data is unified to [-1, 1]. The modulation technique employed by the emitters is the Orthogonal Frequency Division Multiplexing (OFDM) in 5G (Figure 5).
Figure 4.

Figure 5.

The Channel Model
In this section, we examined the GBSM standards and the WINNER+ model in [31] and [32], which follows a GBSM approach and presented a relating channel realization between the BS when modeled as CA and the UAV. We considered these WINNER+ and 3GPP standards because it has a substantial component of energy that is radiated in the elevation according to re- search. Therefore, in the azimuth, the propagation path does not enhance performance [33]. For the 3D MIMO- OFDM analysis, we represent the BS as CA. However, the UAV is represented by summing contributions of N multiple paths with channel parameters such as delay, power, and both azimuthal and elevation spread. In [25], authors defined the effective channel between the sth transmitting UAV and the uth receiving BS as:
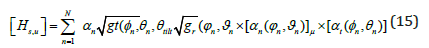
where s = 1, ..., NUAV , u = 1, ..., NBS, αn is the complex amplitude of the nth path, (ϕn, θn) are the azimuth and the elevation angles- of-departure (AODs) respectively. (φn, ϑn) are the azimuth and elevation of angles of arrival (AOAs) of the nth path respectively. Following the procedures of ITU and 3GPP standards, the gain of each antenna array at the BS is expressed as gt (ϕn, θn, θtilt)≈ gt, H (ϕngt, v (θn, θtilt)). The antenna array responses are represented by αt(ϕ, θ) and αr(ϕ, θ). Different transmission modes indicated in [27] and [34] are required with the use of CA antenna ports. With this antenna arrangement, each antenna port appears to be a single port since all of its components convey the same signal. The response of the uth UAV antenna in relation to the 3-D channel model is expressed as [34].

Also, the array response of the sth BS antenna of CA using Eq. (3) can be expressed as

The resulting 3-D channel realization between the sth transmit antenna of the CA and the single receiving antenna can be expressed as
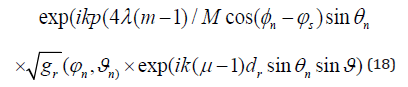
Where k is the wave number, dr is the separation between the receiving antennas, ρ = 4λ/l which represents the radius of the cylinder. m = 1, ..., M is the total number of UCA elements within the CA in the z-direction.
Experimental and Simulation Procedures
The raw sample signals utilized by the experiments are collected from seven GSM mobile phones with the same brand Nokia 1682C with the same model that are denoted Ei, i = 1, 2, 3 7. Every GSM emitter provides a set of 600 samples per class recorded at a range of signal-to-noise ratio (SNR) from 0-12dB from a data length of 5000. The fast Fourier transform number used is 128 where different training data set and testing data sets are used to train the KNN classifier, Naive Bayes (NB) classifier and the Support Vector Machine (SVM) classifier. The number of principal component was chosen as 15 since that gave a higher recognition rate for the classification. The classification order is conducted by sequence of experiments. The former procedure of the experiment is to add AWGN of range 0-12dB to the train data and an optimum is selected from the range that gives a better average recognition rate for each of the novel techniques with different classifiers. The subsequent procedure is to get a very high average recognition rate for a variable SNR of range 0-12dB at constant train data for a variable test data option. After several experimental procedures, 101.The performance of the novel techniques were tested when the to−noise ratio use is at 12dB, train data portions kept constant and t.
Reference Examples
Basic Format for Books: J. K. Author, Title of chapter in the
book, in Title of His Published Book, xth ed. City of Publisher, (only
U.S. State), Country: Abbrev. of Publisher, year, ch. x, sec. x, pp. xxx
xxx.
See [1], [2].
Basic Format for Periodicals: J. K. Author, Name of paper, Abbrev. Title of Periodical, vol. x, no. x,pp. xxx xxx, Abbrev. Month, year, DOI. 10.1109.XXX.123456. See [3] [5].
Basic Format for Reports: J. K. Author, Title of report, Abbrev. Name of Co., City of Co., Abbrev. State, Country, Rep. xxx, year. See [6], [7].
Basic Format for HandBooks: Name of Manual/Handbook, x ed., Abbrev. Name of Co., City of Co., Abbrev. State, Country, year, pp. xxx xxx. See [8], [9].
Basic Format for Books (When Available Online): J. K. Author, Title of chapter in the book, in Title of Published Book, xth ed. City of Publisher, State, Country: Abbrev. of Publisher, year, ch. x, sec. x, pp. xxx xxx. [Online]. Available: http://www.web.com See [10] [13].
Basic Format for Journals (When Available Online): J. K. Author, Name of paper, Abbrev. Title of Periodical, vol. x, no. x, pp. xxx xxx, Abbrev. Month, year. Accessed on: Month, Day, year, DOI: 10.1109.XXX.123456, [Online]. See [14] [?].
Basic Format for Papers Presented at Conferences (When Available Online): J.K. Author. (Year, month). Title. presented at ab- brev. conference title. [Type of Medium]. Available: site/path/ le See [?].
Basic Format for Reports and HandBooks (When Available Online): J. K. Author. Title of report, Company. City, State, Country. Rep. no., (optional: vol./issue), Date. [Online] Available: site/path/ le See [?], [?].
Basic Format for Computer Programs and Electronic Documents (When Available Online): Legislative body. Number of Congress, Session. (Year, month, day). Number of bill or resolution, Title. [Type of medium]. Available: site/path/ le NOTE: ISO recommends that capitalization follow the accepted practice for the language or script in which the information is given. See [?].
Basic Format for Patents (When Available Online): Name of the invention, by inventor’s name. (Year, month day). Patent Number [Type of medium]. Available: site/path/ le See [?].
Basic Format for Conference Proceedings (Published): J. K. Author, Title of paper, in Abbreviated Name of Conf., City of Conf., Abbrev. State (if given), Country, year, pp. xxxxxx. See [?].
• Example for papers presented at conferences (un- published): See [?]. Basic Format for Patents: J. K. Author, Title of patent, U.S. Patent x xxx xxx, Abbrev. Month, day, year. See [?].
Basic Format for Theses (M.S.) and Dissertations (Ph.D.):
1) J. K. Author, Title of thesis, M.S. thesis, Abbrev. Dept., Abbrev.
Univ., City of Univ., Abbrev. State, year.
2) J. K. Author, Title of dissertation, Ph.D. dissertation, Abbrev.
Dept., Abbrev. Univ., City of Univ., Abbrev. State, year.
See [?], [?].
Basic Format for the Most Common Types of Unpublished
References:
1) J. K. Author, Private Communication, Abbrev. Month, year.
2) J. K. Author, Title of paper, unpublished.
3) J. K. Author, Title of paper, to be published. See [?] [?].
Basic Formats for Standards:
1) Title of Standard, Standard number, date.
2) Title of Standard, Standard number, Corpo- rate author,
location, date.
See [?], [?].
• Article number in reference examples: See [?], [?].
• Example when using et al.: See [?].


