Impact Factor : 0.548
- NLM ID: 101723284
- OCoLC: 999826537
- LCCN: 2017202541
Jun Yokomachi1, Takeshi Tsutsumi2*, Nami Takano3, Tohru Kamijima1, Kuniaki Iwasawa4, Hiroyuki Kaneda1, Kentaro Minami1, Takafumi Nakajima1, Shigeru Toyoda1 and Toshiaki Nakajima1
Received: November 22, 2022; Published: December 02, 2022
*Corresponding author: Takeshi Tsutsumi, Division of Cardiology, Eda Memorial Hospital, Yokohama 225-0012, Japan
DOI: 10.26717/BJSTR.2022.47.007499
Introduction: We aimed to measure the frequency power profile (FPP) of the electrocardiographic QRS complex (QRS) in patients with lethal ventricular arrhythmias (L-VAs) and explore the prediction of sudden cardiac death.
Methods: Frequency power within the QRS and ventricular late potential (VLP) were simultaneously measured in L-VA patients (n = 57) and control cases (n = 60) using a continuous wavelet transform. FPP during the QRS was calculated from 40 to 250 Hz. Additionally, we assessed how to improve the risk stratification of sudden cardiac death if both VLP and abnormal FPP are applied to predict L-VAs.
Results: FPP was classified into two types in L-VA patients [Type 1(a and b), and Type 2]. Type 1 patients (n = 38) were defined as the peak frequency power increased in the high-frequency zone (80-250 Hz), and Type 2 patients (n = 13) as it increased in the mid-frequency zone (40-80 Hz), compared with the control group. Type 1 was subdivided into two groups with (Type 1b) and without (Type1a) the increase of ITFP in the mid-frequency zone. Type 1a had a lower left ventricular ejection fraction and a prolonged QRS duration, compared with Type 1b and Type 2 patients. Ischemic cardiomyopathy was the most common underlying heart disease in Type 1a patients, while a large percentage of Type 2 patients had idiopathic ventricular arrhythmias (54 %). If we use both VLP at the end of the QRS and the abnormal frequency power within the QRS for the prediction of L-VAs, the sensitivity in predicting sudden cardiac death would improve from 0.57 (VLP only) to 0.92.
Conclusions: The different patterns of FPP in L-VA patients (Type 1 and 2) may be linked to the distinction in the electrophysiological base triggering a ventricular arrhythmia. Additionally, the prediction of sudden cardiac death was improved using both VLP and abnormal intra-QRS frequency power. t
Keywords: Ventricular Arrhythmia; Frequency Domain Analysis; QRS Complex; Wavelet Transform; Sudden Cardiac Death; Idioventricular Arrhythmia
Abbreviations: AMI: Acute Myocardial Infarction; CWT: Continuous Wavelet Transform; DCM: Dilated Cardiomyopathy; FPP: Frequency Power Profile; HCM: Hypertrophic Cardiomyopathy; ICM: Ischemic Myocardiopathy; ITFP: Integrated Time-Frequency Power; L-VAs: Lethal Ventricular Arrhythmias; LVEF: Left Ventricular Ejection Fraction; QRSd: QRS duration; SAECG: Signal -Averaged Electrocardiogram; VLP: Ventricular Late Potential; WT-ECG: Wavelet Transformed Electrocardiogram
In the 1960s, Scher and Young demonstrated that the frequency content of the QRS lies mostly within 80 Hz [1]. Langner and Gezelowitz showed that high-frequency components (≥ 150 Hz) were observed during the QRS in patients with coronary heart disease [2]. Since then, many authors have referred primarily to the clinical significance of high-frequency QRS content [3-6]. After the year 2000, wavelet transform, which can improve the temporal resolution of high-frequency content compared to fast Fourier transform, was applied to the analysis of non-stationary biological signals, such as the QRS [7]. However, the full spectrum of the QRS frequency content has not been adequately explored because researchers have focused on the invisible high-frequency components within the QRS [8]. In the present study, the distribution of intra-QRS frequency power across a wide range (40-250 Hz) was measured using continuous wavelet transform (CWT) in patients with lethal ventricular arrhythmias (L-VAs). In the 1980s, Simson and Denes showed that an abnormally delayed potential appeared at the end of the QRS, the so-called ventricular late potential (VLP), which has some value in risk stratification for sudden cardiac death [9,10]. The weakness of the VLP was that it was not capable of detecting abnormal conduction if it occurred early within the QRS. The other purpose of this study was to investigate whether the combined use of VLP and abnormal intra-QRS frequency power could improve the prediction of L-VAs.
For the current study, we selected 57 patients with L-VAs from 520 consecutive patients with syncopal seizures who visited Dokkyo Medical University Hospital and whose VLP measurement was performed during ECG recordings. We selected 60 control subjects from the 520 ECG records. The features of the control group were:
1) No cardiovascular diseases or cardiac arrhythmias from clinical examinations,
2) Negative VLP, and
3) Age range: 15–60 years.
Eighteen of the 57 L-VA patients were resuscitated after the emergency application of electrical cardioversion. Radiofrequency catheter ablations were performed to cure recurrent syncopal seizures due to ventricular arrhythmias in 8/57 patients, and implantable cardioverter defibrillators were implanted in 5/57 patients from whom ECGs were recorded before these procedures. The other 26 patients had a history of syncopal attack and documented spontaneous sustained ventricular tachyarrhythmias (≥ 120 beats/min for ≥ 30 seconds). Patients with the following conduction abnormalities were excluded from this study: pre-existing bundle branch blocks, Wolff-Parkinson-White syndrome, paced beats under an implanted pacemaker, and successive abnormal atrial excitation during the QRS, such as persistent atrial flutter and fibrillation. The ethics committees of Dokkyo Medical University Hospital approved the study protocol, and all patients provided written informed consent to participate in the study.
In 57 patients with L-VAs and 60 control cases, bipolar orthogonal X, Y, and Z leads were measured for 20 seconds through a band-pass filter with higher and lower edges of 300 Hz and 0.15 Hz using an FDX-6521 Cardio-Multi (Fukuda Denshi, Co. Ltd., Tokyo, Japan). We measured bipolar X, Y, and Z recordings and VLP with a frequency cut-off between 40–250 Hz. Approximately 200 beats were filtered and averaged. The following three variables of signalaveraged electrocardiography (SAECG) were considered to assess the presence of VLP:
1) a QRS duration of ≥ 114 msec,
2) a duration of the low-amplitude signal < 40 μV for ≥ 38 ms in the terminal portion of the averaged QRS complex, and
3) A root mean square of the terminal 40 ms; 20 μV or less.
VLP was present when at least two of these findings showed abnormal values. Analog data from this recording device were digitized by an A/D converter (16- bit resolution) at a sampling rate of 1 kHz (Model EC-2360; Elmec Co. Ltd., Tokyo, Japan), and saved as CSV files for analysis. CWT was applied to the time-frequency analysis of QRS, and time-frequency powers were calculated using PC software (BIOMAS, version 3.0 for Wavelet, Elmec Co. Ltd. Japan) as previously reported [6]. The Morlet wavelet was used to measure the wavelet-transformed signals comprising 80 scale bands. First, we eliminated X, Y, and Z recordings with baseline drift and visual noise between the electrocardiographic U-P segments. A single QRS without noise was selected and analyzed to avoid incorporating the trigger jitter resulting from the signal averaging process. Subsequently, we picked a 120ms duration from the onset of the QRS, which integrated the wavelet-transformed signal powers. These integrated time-frequency powers (ITFPs) were automatically inserted into the list of calculations. We selected the Y led to make a single-beat analysis because the QRS in Y leads contain more extensive high-frequency powers than that in the X and Z leads.
When one-way analysis of variance indicated differences between the groups, the significance of individual differences was evaluated using post hoc Tukey’s honestly significant difference. We used receiver operating characteristic (ROC) analyses to assess predictive capability and identify an optimal cutoff level. Data are expressed as mean ± standard deviations (SD). All statistical analyses were performed using statistical programs slotted in EZR. All p-values were 2-sided, and p-values <0.05 were considered significant.
(Table 1) summarizes patient characteristics. As illustrated in (Table 1), the complications associated with L-VAs were as follows: absence of underlying heart diseases (idiopathic ventricular arrhythmias, IVAs; n = 17 ), ischemic cardiomyopathy (ICM; n = 13), hypertrophied or dilated cardiomyopathy (HCM or DCM; n = 10), acute myocardial infarction (AMI; n = 3), acute myocarditis ( AMC; n = 2), Brugada syndrome (n = 4), left ventricular hypertrophy (LVH; n = 3), long QT syndrome (L-QT; n = 1), amyloidosis (n = 1), and Basedow’s disease (n = 1). Other complications included a surface heart wound in one patient and the onset of L-VAs during football in another patient.
Table 1: Clinical characteristics of the patients with lethal-ventricular arrhythmias and control cases.
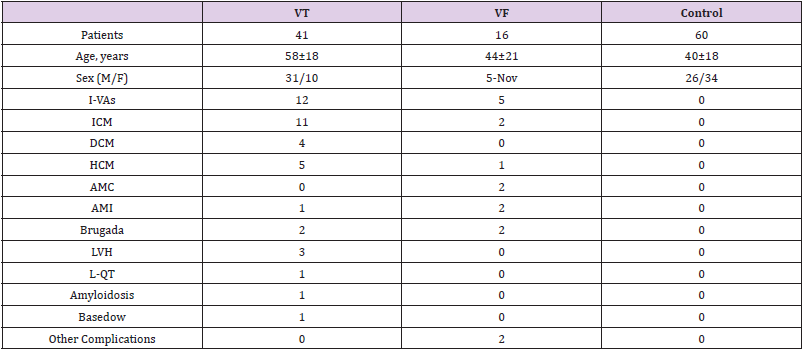
Note: Data are expressed as means ± standard deviations.
Abbreviations: M: Male; F: Female; I-VAs: Idiopathic Ventricular Arrhythmias; ICM: Ischemic Cardiomyopathy; DCM: Dilated Cardiomyopathy; HCM: Hypertrophic Cardiomyopathy; AMC: Acute Myocarditis; AMI: Acute Myocardial Infarction; Brugada: Brugada Syndrome; LVH: Left Ventricular Hypertrophy; L-QT: Long QT Syndrome; Basedow: Basedow’s Disease; VT: Ventricular Tachycardia; VF: Ventricular Fibrillation; Control: Control Cases
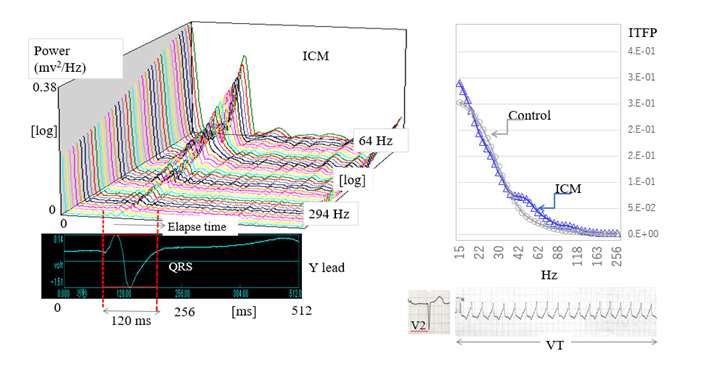
The left panel of (Figure 1) shows the representative wavelettransformed signals calculated from the QRS in a patient with ICM. We named these signals wavelet-transformed electrocardiographic signals (WT-ECG signals). The patient was a 77-year-old man diagnosed with an old anterior MI complicated by L-VAs and chronic heart failure, and whose VLP was negative. As illustrated in this panel, a three-dimensional representation of the WT-ECG signals measured from a single QRS is depicted with a logarithmic scale. In this study, we used eighty-scale bands to calculate the time-frequency powers ranging from 15 to 300 Hz. Twenty-one WT-ECG signals were depicted ranging from 64 to 294 Hz as shown in the left panel of (Figure 1). To quantitatively compare the timefrequency power of WT-ECG signals, we calculated the integral time-frequency power (ITFP) of every eighty WT-ECG signals from the onset of the QRS to the 120 msec after the QRS. The integral time section between the two red dotted lines is represented in the same panel. In the right panel, the ITFPs from a control case (gray line) and an ICM patient (blue line) are plotted on the frequency axis from 15 to 256 Hz. Compared with the control, ITFPs of an ICM patient increased between 40–80 Hz. In the right lower panels, we represent the 12 lead ECGs (V2, V5) and an episode of ventricular tachycardia recorded in this patient.
Note: Abbreviations: ICM: Ischemic Cardiomyopathy; ITFP: Integrated Time-Frequency Power; VT: Ventricular Tachycardia
Figure 1: Wavelet–transformed electrocardiographic signals and the distribution of integrated time-frequency power X-axis, time course; Y-axis, frequency power; Z-axis, the frequency corresponding to the lower electrocardiogram (lead Y).
Eighty numerical values of ITFP ranging from 15 to 256 Hz were inserted into an Excel spreadsheet. We measured the average ITFP from control cases (n = 60) for each of the 80 frequencies and then calculated the ratio of ITFP in the individual L-VA patient to the average ITFP of the control. The graphs in (Figure 2) show these ITFP ratios plotted along the frequency axis, which we refer to as the frequency power profile within the QRS (FPP). The horizontal axis indicates the frequency and longitudinal ITFP ratio (L-VA/ control) in these graphs. In the left graph, the ITFP ratios in the L-VA patients are above 1.0 from 110-250 Hz, and in the right chart, above 1.0 from 30-50 Hz, where ITFP increased. We classified the FPP into two different types. As shown in the left graph, the Type 1a FPP pattern (n = 26) is defined as the peak ITFP ratio increasing over 1.0 in the frequency range of 80–250Hz and decreasing below 1.0 between 40–80 Hz. An example of the ITFP ratio from a Type 1a patient is represented by the blue curved line on the upper left graph, which was a 78-year-old man who was diagnosed with ICM and implanted in an implantable cardioverter-defibrillator. In addition, this patient tested positive for VLP. The orange curved line in the upper left graph represents the ITFP ratios in Type 1b (n = 12), in which the peak ITFP ratio increased over 1.0 in the frequency range of 80–250 Hz, and also increased in the frequency range of 40 –80 Hz, indicated by the gray arrows.
Note: Abbreviations: ITFP Ratio: Integrated Time-Frequency Power Ratio; D: QRS duration
Figure 2: Frequency power profile in Type 1a, b, and 2 patients.
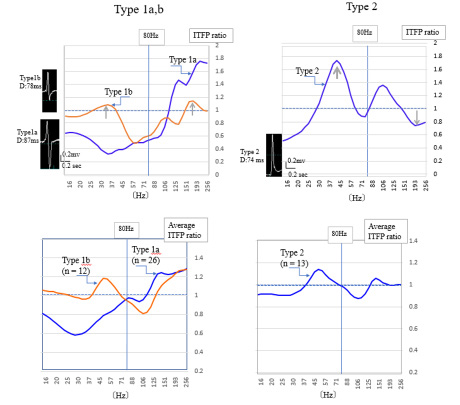
This Type 1b patient was a 39-year-old man diagnosed with Brugada syndrome, and positive for VLP. The actual QRS shapes are shown on the left side of the graph. The QRS duration of a Type 1a patient was longer (87 ms) than that of a Type 1b patient (78ms). The type 2 FPP pattern (n = 13) is defined as the peak ITFP ratio above 1.0 in the frequency range of 40–80 Hz, and below 1.0 from 150–250 Hz as indicated by gray arrows. The upper right graph represents a typical example of a Type 2 patient. This patient was a 29-year-old man diagnosed with idiopathic ventricular fibrillation and negative for VLP. The lower two graphs in this figure represent the average ITFP ratio in Type 1a, b (left graph), and Type 2 (right graph). The same changes in FPP were seen as illustrated in the upper graphs. The pie graphs in (Figure 3) show the underlying heart diseases in patients with L-VAs. There were a variety of types of heart disease among Type 1a patients. Of the 26 Types 1a patients, 9 (35%) were diagnosed with ICM, 5 (19 %) with cardiomyopathy, and 4 (15%) with idiopathic ventricular arrhythmias. Another complication was a patient suffering a wound caused by an edged tool on the heart’s surface. The complications in the Type 1b patients were cardiomyopathy (3 cases, 25%), idiopathic ventricular arrhythmias (3 cases, 25%), Brugada syndrome, and Basedow’s disease. In comparison, Type 2 patients (n = 13) were complicated with idiopathic ventricular arrhythmias (7 cases, 54 %) and Brugada syndrome (2 cases).
Table 2: Clinical characteristics of Type1a,1b, and 2 patients.

Note: Data are expressed as means ± standard deviations. ns, not significant
Abbreviations: M: Male; F: Female; LVEF: Left Ventricular Ejection Fraction; BNP: Brain Natriuretic Peptide; QRSd: QRS Duration
Note: Abbreviations: ICM: Ischemic Cardiomyopathy; IVAs: Idiopathic Ventricular Arrhythmias; DCM: Dilated Cardiomyopathy; HCM: Hypertrophic Cardiomyopathy; AMI: Acute Myocardial Infarction; AMC: Acute Myocarditis; LVH: Left Ventricular Hypertrophy; Brugada: Brugada Syndrome; L-QT: Long QT Syndrome; Basedow: Basedow’s Disease
Figure 3: The underlying heart diseases in each type of frequency power profile.
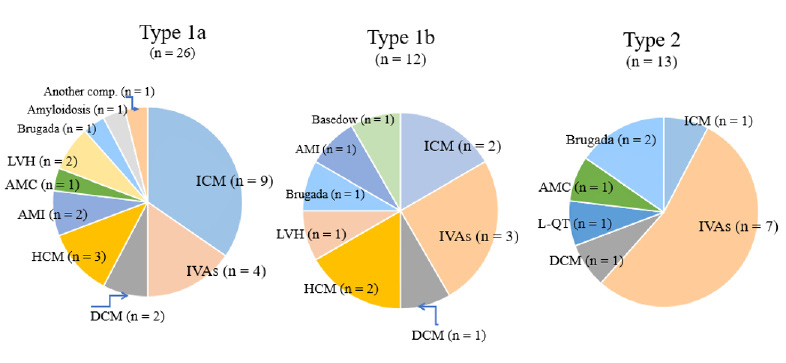
We excluded six patients whose ITFP ratios decreased below 1.0 throughout the frequency range of 40–250 Hz. Two of these six patients had ICM, one patient had AMI, one had HOCM, one had idiopathic ventricular arrhythmias, and one had ventricular fibrillation during football. To elucidate the clinical significance of these cases, we should plan further studies using another approach. In the present study, the highest percentage of complications was found at ICM (35%) in Type 1a patients and idiopathic ventricular arrhythmias (54%) in Type 2 patients, although the number of samples is so low to derive statistical conclusions.
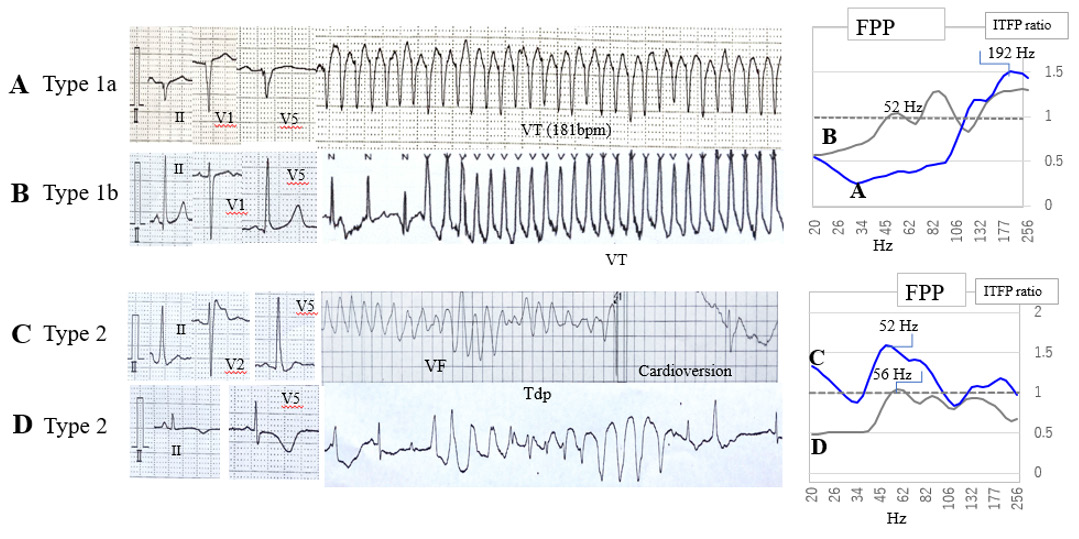
(Figure 4) shows the ECG strips recorded from four different patients and FPP. The ECG strips in panel A were recorded from a 68-year-old man with ICM. It shows the standard 12 leads ECG (II, V1, V5) and an episode of VT with a ventricular rate of 181 beats per minute. The FPP, in this case, depicted by a blue line, is shown in the upper right panel. It is above 1.0 in the high-frequency zone (150-250 Hz) and below 1.0 in the mid-frequency zone (40- 80 Hz), indicating a typical feature of Type 1a patients. The ECG strips in panel B were recorded from a 37-year-old woman with idiopathic ventricular tachycardia. The peak FPP in this patient was observed in the high-frequency zone and her FPP is above 1.0 in the mid-frequency zone. This is shown in the right upper panel, whose FPP indicates the features of Type 1b patients. The ECG strips in panel C were recorded from a 31-year-old man with Brugada syndrome. This panel also demonstrates that an episode of ventricular fibrillation was stopped after cardioversion. The peak FPP in this patient was observed in the mid-frequency zone (40– 80 Hz) as shown in the right lower panel, which is a different FPP than those of Type 1 patients. We defined such FPPs as Type 2. The bottom ECG strips in panel D were recorded from 45yearsold women with a long QT syndrome. An episode of Torsades de Pointes was also demonstrated in these ECG strips. The FPP in this case only increased in the mid-frequency zone, which indicates that it belongs to Type 2 patients.
Note: Abbreviations: VT: Ventricular Tachycardia; VF: Ventricular Fibrillation; Tdp: Torsades de Pointes; FPP: Frequency Power Profile; ITFP Ratio; Integrated Time-Frequency Power Ratio
Figure 4: Examples of lethal-ventricular arrhythmias and frequency power profile.
(Table 2) shows the clinical characteristics of Type 1 and 2 patients. The left ventricular ejection fraction (LVEF) of Type 1a, measured from the echocardiogram, was significantly lower than that of Type 1b (p < 0.05) and Type 2 (p < 0.05). The QRS duration (QRSd) in Type 1a patients was significantly longer than that in Type 1b (p < 0.01) and Type 2 (p < 0.05) patients. We did not recognize any significant differences in age and brain natriuretic peptide (an indicator for diagnosing cardiac failure), among the three types of patients. Additionally, the clinical features of patients in (Table 2) indicated that Type 1a patients had more severe cardiac complications than Type 1b and Type 2 patients.
We added the ITFP values among particular frequencies in the individual case and subsequently calculated the averaged values for objective patients. Next, we measured ROC curves to elucidate the quantitative differences between the groups. (Figure 5) shows the comparison of the sum of ITFPs at the three different frequency zones in the upper graphs, and their ROC curves assessing the ability to predict L-VAs. The left upper bar graph in (Figure 5) shows the sum of seven ITFP values between 150–250 Hz in the individual patient [ITFPSUM (150–250 Hz)] of the Type 1a group (n = 26, hatched column) and control cases (n = 60; black column). The sum of the ITFPs significantly increased in Type1a patients compared with controls (p < 0.01). The upper middle bar graph shows the sum of 26 ITFPs between 40–250 Hz [ITFPSUM (40–250 Hz) ]calculated from Type 1b patients, which was significantly higher than that of controls (p < 0.01). The upper right bar graph similarly demonstrates the sum of nine ITFPs from 40– 80 Hz [ITFPSUM (40–80 Hz) ] from Type 2 patients, which was significantly higher than that of controls (p< 0.01). Subsequently, the lower three graphs in this figure represent ROC curves of the sum of ITFPs for predicting L-VAs in the three frequency zones. When we selected the suitable cut-off value of SUM (150–250 Hz) over 7.8 E-03 [unit; log(mV2/Hz)] in Type1a, an outbreak of L-VAs could be predicted with a sensitivity of 0.85 and a specificity of 0.65.
Furthermore, the area under the ROC curve (AUC) for Type 1a was 0.82, resulting in moderate prediction accuracy. The AUC for the Type 1b ROC curve was 0.85, with the same accuracy as the L-VA prediction for Type 1a. When we selected the cut-off value of SUM (40–80 Hz) over 1.6 E-01 in Type 2, the L-VAs could be predicted with an AUC of 0.82. These results indicate a moderate accuracy in the prediction of L-VAs in Type 2 patients. (Table 3) shows the truepositive rate of L-VAs for the combined use of VLP and ITFP. In this study, the specificity could not be measured because we selected the control cases as negative VLP. The true positive rate of L-VAs measured from VLP was 0.57, but 16/22 false-negative patients became positive when both VLP and ITFP judgments were applied. Consequently, the sensitivity of predicting L-VAs increased from 0.57 to 0.92.
Note: Abbreviations: ITFP: Integrated Time-Frequency Power; L-VAs: Lethal Ventricular Arrhythmias; TP Ratio: True-Positive Ratio; FP Ratio: False-Positive Ratio
Figure 5: Sum of integrated time-frequency power and receiver operating characteristic curves to predict lethal ventricular arrhythmias.
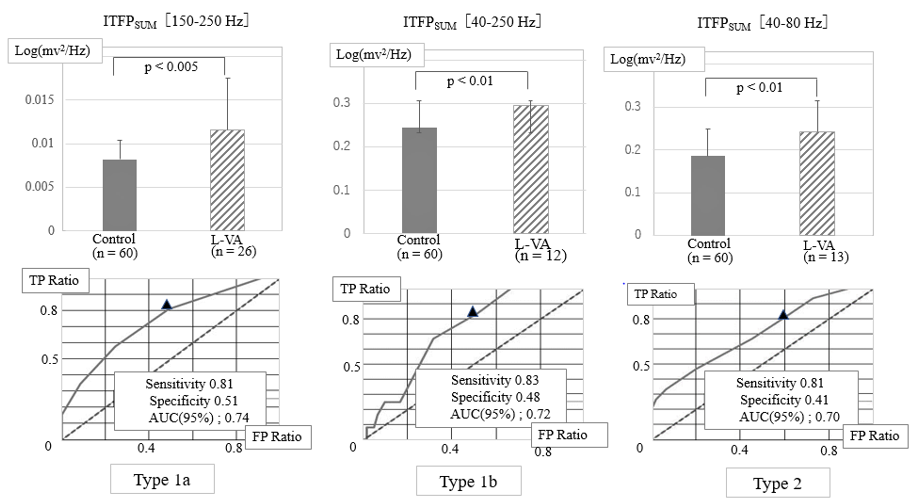
Table 3: The true-positive ratio of the occurrence of lethal-ventricular arrhythmias using ventricular late potential and integrated time-frequency power.

Note: Abbreviations: VLP: Ventricular Late Potential; ITFP: Integrated Time-Frequency Power; p/n: Number of Positive and Negative Patients.
As the results of measuring the spectrum of intra-QRS frequency contents from 15 to 250 Hz in the 57 patients with L-VAs, we noted a new finding that the FPP within the QRS could be classified into two types. The abnormal increase in the frequency power within the QRS was mainly recognized in the high-frequency zone (80–250 Hz) in Type 1, and the mid-frequency zone (40–80 Hz) in Type 2 which included the patients with a high percentage of IVAs. In addition, the VLP judgment for SCD prediction was negative in 22/57 patients; however, 16/22 false-negative patients became positive if an abnormal increase in the frequency power within the QRS was added to these judgments. We discuss these results in detail below.
The spectrum of frequencies within the QRS reflects the differences in the propagating speed and form of excitation wavefronts in cardiac ventricles throughout the cardiac cycle [11]. Accordingly, the full spectrum analysis of the frequency contents in the QRS can supply additional new findings for electrocardiographic diagnosis. However, according to a previous review [8], the full spectrum of frequencies within the QRS has not been adequately explored. Several reasons are considered:
1) Clinical significance of the frequency spectrum has not been shown.
2) Various patterns of the frequency spectrum can be seen in individual cases; therefore, it is difficult to decide whether it is normal or abnormal.
3) The frequency power above 200 Hz is too small, usually ≤ 0.01% value compared with it below 40 Hz; therefore, it is hard to judge the signal abnormality. To quickly ascertain characteristics in the frequency distribution, we adopted the ratio of frequency powers in L-VA patients to those of control cases with a wide frequency range. Additionally, measuring the frequency power ratio with the same device will be advantageous in reducing the mixing of mechanical noises. In the present study, an increase in the high-frequency power (80–250 Hz) was observed in L-VA patients with Type 1 FPP, and ICM was the most common underlying heart disease in Type 1a patients. These results do not contradict previous reports that high-frequency content was distinct between L-VA patients with ischemic heart disease [6,10,12,13] We previously studied the relationship between FPP within the QRS and the fibroblastto- myocyte ratio using the computer simulation model [11,14]. According to the results of our studies, L-VAs may be induced by time-dependent changes in the jagged excitation passing through small non-excitable tissue, such as fibrous tissue [11,14]. The apparent distinction between Type 1a and Type1b FPP is that the ITFP ratio in Type1a is below 1.0, but over 1.0 in Type1b, in the mid-frequency zone. As presented in (Table 2), the clinical features of Type 1a are distinct from those of Type1b. That is, lower LVEF and prolonged QRS duration were observed in Type1a patients, compared with those of Type1b patients. Additionally, the underlying heart diseases in Type 1a were more severe than those in Type 1b patients. Mor-Avi and Akselrod investigated the intra- QRS power content of an epicardial electrogram on the cardiac surface in dogs after occlusion of the coronary artery [15]. They noted that high-frequency (150–250 Hz) and mid-frequency (40– 150 Hz) powers increased immediately after coronary occlusion.
Subsequently, the mid-frequency powers decreased, accompanied by the prolongation of QRS duration. They concluded that ischemia causes a frequency shift of the mid-frequency power to the lower frequency zone. The frequency shift from mid to low frequency may cause both a reduced conduction velocity and a decrease in the amplitude of the cardiac action potential. Moreover, computer simulation showed that if the proportion of fibrous tissue to normal tissue increased, the frequency power distribution shifted to high and low frequencies, resulting in the reduction of frequency power in the mid-frequency zone [14]. Hence, we speculated that the Type1a FPP appears owing to the frequency shift of the midfrequency power in Type1b.
After the year 2000, the prediction of L-VAs by frequency domain analysis has mainly been studied in patients with specific heart diseases, e.g., ischemic heart disease [10-13] and Brugada syndrome [16], and these studies only referred to the highfrequency content within the QRS. However, various mechanisms are involved in the outbreak of L-VAs. Recently, Iglesias, et al. [17] selected ECGs of 42 patients with a prior history of sudden cardiac arrest or L-VAs from the commercially available standard 12 lead ECG database and analyzed frequency contents during the QRS, using CWT [17]. However, their data was limited to the frequency range of 0.05–150 Hz. Therefore, the present study may be the first to evaluate the frequency analysis of the QRS with a wide range, with a sample size of 57 consecutive L-VA patients with and without heart diseases. Visible electrocardiographic QRS waveforms are generally constructed from frequency components within 8–50 Hz. Type 2 FPPs are defined as the peak ITFP ratio above 1.0 between 40–80 Hz. Gramatikov, et al. [18] explored the intra-QRS spectral changes using CWT during acute myocardial ischemia [18]. They found that a significant increase in the frequency power from 40 to 80 Hz was consistently observed with acute ischemia during percutaneous coronary intervention. This abnormal frequency power may be due to a decrease in the rate of depolarization accompanying acute ischemia before a noticeable conduction delay appears.
Only one Type 2 patient with ischemic heart disease was included in this study. Therefore, there may be another unknown mechanism for the occurrence of L-VAs in Type 2 patients. The other specific features of Type 2 patients were as follows:
1) The average age of Type 2 patients was lower than that of Type 1a patients,
2) The patients with IVAs were included in Type 2, with a higher percentage (54 %), than other complications,
3) Type 2 patients had higher LVEF and then Type1a patients. Using fast Fourier transforms, Kinosita, et al. [19] studied the spectral analysis of SAECG in patients with idiopathic ventricular tachycardia, whose VLP was negative (n = 12) [19]. However, 75% of these patients observed an increase in abnormal frequency power from 40–100 Hz within the QRS, which partly correlates with the results of our present study. In recent studies, microstructural cardiomyopathy and Purkinje fiber abnormalities have been observed in IVA patients [20]. If this is the case, an unnoticeable abnormal potential— probably due to the ventricular impulse propagation with slight distortion [20] could have broken out in the cardiac ventricle of Type 2 patients, which may indicate differences in the electrophysiological base between Type 1 and 2 patients, producing L-VAs.
To date, various analytical methods have been reported to evaluate the noninvasive risk stratification of L-VAs, for example, frequency domain [10,11,16], or time domain analyses [9,21]. Haberl, et al. [13] compared frequency and time domain analyses and commented that the frequency domain overcomes some limitations of the time-domain study (e.g., VLP) [13]. Nogami, et al. [22] reported that the combined use of time and frequency domain analyses can enhance the accuracy of L-VA prediction [22]. These analyses are usually restricted to the terminal portion of the QRS in SAECG in post-MI patients. We adopted a single-beat analysis and measured the frequency power between the QRS. As shown in (Table 3), the true positive ratio of VLP in the time domain analysis was 81% in Type 1a patients but lower in Type 1b (33%) and Type 2 (31%) patients. However, if the time-domain analysis (VLP) was combined with frequency domain analysis (ITFPSUM), the true positive ratios for L-VAs prediction became 100% in Type 1a patients. Furthermore, they markedly rose from 33 to 83% in type 1b and 31 to 85% in Type 2 patients. Surprisingly, 7/9 idiopathic VA patients with false-negative VLP became positive if both the VLP and the abnormal increase in ITFP were applied to predict L-VAs. As a result, combined uses of both the time and the frequency domain analyses in this study were useful for predicting L-VAs.
Our study has several limitations. First, our sample size was small. To further characterize the types of FPP, many more L-VA patients (a minimum of 100) will be required. Moreover, 77% of L-VA patients in this study were male. Therefore, we need to consider sex differences in the frequency power within the QRS. We should also consider age-dependent changes in the frequency power. In our experience, mid-frequency power increases in young control cases (≤ 20 years), and high-frequency power tends to increase in older participants (≥ 60 years). Accordingly, in Type 2 patients, both frequency and other time-domain analyses will be preferable to distinguish between the control and L-VA groups. Therefore, further studies are needed to clarify the characteristic distribution of the frequency power and the prediction of sudden cardiac death.
We measured intra-QRS frequency content and VLP in 57 patients with L-VAs over a wide frequency range (40 – 250 Hz). We introduced FPP measurements to understand the characteristics of the frequency power along the frequency axis. Type 1 FPP consisted of 67% of patients whose FPP showed an increase in high-frequency power (80 –250 Hz). We found Type 2 FPPs in 23% of L-VA patients, in which the frequency power increased in the mid-frequency zone (40 – 80 Hz). Conduction abnormalities in the ventricle may cause high-frequency content during the QRS in Type1 patients. Furthermore, Type 2 FPP could be related to an unnoticeable abnormal distortion of the excitation fronts. These results indicate the distinction between the electro-pathological states in Type 1 and 2 patients. In addition, the combined use of abnormal intra- QRS frequency power and VLP improved SCD prediction.
The contents of this study were partly presented at the 67th annual congress of the Japanese Heart Rhythm Society 2021, held in Fukuoka, Japan
The studies involving human participants were approved by the ethics committees of the Dokkyo Medical University Hospital. The patients/participants proved their written informed consent to participate in this study.
JY contributed to collecting and analyzing the data and writing the manuscript. KI and TN contributed to analyzing data, and statistical analyses. NT, TK, KI, HK, and KM contributed to the clinical data acquisition. ST and TN contributed to the study design, clinical data acquisition, and data interpretation.
This work was not supported by any Funding.
The authors declare that the research was conducted in the absence of any commercial or financial relationships that could be constructed as a potential conflict of interest.
We would like to thank the ECG laboratory technicians and medical doctors at the Department of Cardiovascular Medicine for recording and storing the ventricular late potential data.


