Impact Factor : 0.548
- NLM ID: 101723284
- OCoLC: 999826537
- LCCN: 2017202541
Erum Feroz1, Rehana Kausar2*, Navid Feroze3 and Sania Begum4
Received: November 23, 2022; Published: November 30, 2022
*Corresponding author: Rehana Kausar, Associate Professor, Department of Botany, University of Azad Jammu & Kashmir, Muzaffarabad 13100, Pakistan
DOI: 10.26717/BJSTR.2022.47.007490
Genetic variability in the germplasm is vital for enhancement of crop species including maize. The present study was conducted to examine genetic variation among ten maize genotypes by using simple sequence repeat (SSR) and inter simple sequence repeat (ISSR) primers. By applying unweighted pair group method with arithmetic mean (UPGMA), cluster examination of maize genotypes was done to generate dendrogram using bivariate data matrix. Dendrogram for SSR revealed two main groups A and B with maximum level of diversity. Group A contained two genotypes whereas major portion of dendrogram was comprised of Group B with four sub clusters. ISSR dendrogram also revealed two major groups A and B. Group A contained six genotypes as compared to group B having four genotypes. The polymorphism information content (PIC) values were calculated for each SSR and ISSR locus. As per cluster analysis, dendrogram results interpreted that great genetic variability existed among genotypes of maize and ISSR primers were best suited for its determination. Spanning tree analysis was performed for both SSR and ISSR primers and G5 (Genotype Azam) and G7 (Genotype MMRI) came out as most diverse among all studied maize genotypes. These diverse genotypes are best suited for maize improvement through future breeding programs in the region.
Keywords: Maize; SSR; ISSR; DNA Polymorphism; PCR
Abbreviations: AJK; Azad Jammu & Kashmir; bp; Base Pair; ISSR; Inter Simple Sequence Repeat; MSN; Minimum Spanning Network; PCR; Polymerase Chain Reaction; PIC; Polymorphism Information Content; SSR; Simple Sequence Repeat; UPGMA; Unweighted Pair Group Method with Arithmetic Mean
The most important grain in the world is maize (Zea mays L.) after wheat and rice. It contains high quantity of nutrition and is important as a coarse cereal. The cultivation of maize crop is quite easy as it is widely grown by farmers and is cost effective because limited fertilizers are used. Maize crop usage as an infant food earns reasonable foreign exchange. Among other monoculture crops, growth of maize crop is quite fast. It is used as food or fodder crop worldwide because it has higher leafy mass and vegetative growth [1]. Maize crop plays vital role in the overall progress in the economy of any country. Although having high yield potential of maize in Pakistan, its average output is on lower side. Average maize yield per hectare can be increased if high quality genotypes are combined with proper production technology being adopted by farmers. In Azad Jammu Kashmir (AJK), maize is amongst the vastly growing crops and can be grown in different agro zones stretching from 1,828 to 3,656 meters high altitudes. Annually, 41 percent area is covered by this major crop and kharif period is best for its cultivation [2]. Poaceae is the family of maize crop with five phenotypes coming from common single predecessor. Maize provides main food, fodder, and oil and confectionary items to people of various countries due to which it is considered as a major source of income in the world.
All over the world, the production of maize crop is limited and threatened because of issues like wild animals, salt level, dry spell and other contaminations caused by microorganisms [3,4]. Vast damage of maize produce was reported in the field and in the storing stocks due to the diseases caused by fungi [5]. Genetic makers are firm and identified in all tissues of plant irrespective of differentiation, development, progress or position of cells. Apart from this, they are not pretentious to pleiotropic, epistatic or environmental factors [6-8]. Due to this, the use of DNA markers has become very important as compared to phenotypic aspects. Diverse types of markers are available and the most commonly used are the SSR markers [9], random amplified polymorphic DNA (RAPD) [10], ISSR [11,12], single nucleotide polymorphism [13] and diversity arrays technology [14]. ISSR technique necessitates the use of microsatellite sequences as primers to generate muti-locus markers in a polymerase chain reaction [15,16]. ISSR technique is considered faster and simpler like RAPD technique, however it has more rigidity as compared to RAPD. Also, ISSR markers are highly distinct, that is why they are very useful in the study of genomic mapping, phylogeny, genomic variations, coding and biology of evolution [15].
Due to a high level of polymorphism detected by automated analysis systems and high precision and repeatability, SSR markers are highly useful for large-scale DNA finger printing of maize genotypes. For diversity analysis of maize, RAPD, SSR and amplified fragment length polymorphism (AFLP) techniques are used by researchers [17-21]. In a study of 33 inherent lines, the information produced by SSR is twice as much as compared to AFLPs and RAPDs, and 40% more than random fragment length polymorphism in terms of numbers of alleles per locus [22]. Diverse forms of primers are capable to adapt and distinguish changes between genomes, in terms of rate, acceptance of handling, stability and repetition of the outcomes [23-25]. An efficient method for large scale application is genetic finger printing of maize which support breeders in the arrangement of breeding lines and populations into the correct heterotic group, which support the curation of gene bank collections by refining the core subsets formed from field evaluation and have a better understanding of the evolution of major tropical maize lines [26-28].
Genotypes and Plant Material
Ten maize genotypes were used to assess their genetic variability. The plants were grown in green house of National Agricultural and Research Centre Islamabad. The daytime and nighttime temperature of green house was maintained at 25°C and 18°C respectively. For DNA extraction, three weeks old young leaves of maize genotypes were taken (Table 1).
DNA Extraction
Total genomic DNA was extracted from frozen leaves of samples by CTAB method with slight modifications [29]. Young leaves were grinded with the help of mortar and pestle in 3000 L of CTAB buffer. Then the plant mixture was transferred to a clean microfuge tube. The CTAB/ plant extract was incubated in water circulating bath at 65°C centigrade for 30 minutes. During this period tube was inverted after every ten minutes. Next, to each microfuge tube 600 μL of isoamyl alcohol was added at the ratio of 24:1 and solution was mixed by inversion. After thorough mixing by hand, tubes were spin at 12000 rpm for ten minutes. The upper aqueous phase containing DNA was transferred to clean microfuge tube and addition of 480 μL chilled isopropanol was added. Tubes were slowly inverted so that DNA gets precipitated. Inversion was done several times. As the DNA precipitates, it was placed for 1 hour at -20 degree centigrade. The precipitated DNA gets easily stick with tip of pipette. The DNA was washed with 100ul of 70% ethanol and the tubes were inverted slowly. After washing, DNA was centrifuged for 10 minutes at 12000 rpm to form pellet. DNA pellet was kept for overnight to dry completely. To dissolve the pellet, 1000 μL double distilled water was added. The sample was then ready for further processing.
DNA Quantification
Gel electrophoresis was carried out to quantify the isolated DNA. Agarose gel was prepared by mixing 1000 mL of 1X TAE buffer and 1g agarose gel in a measuring flask. The gel was melted for 2 minutes in microwave oven. After that, it was cooled little bit and then 5 μL of ethidium bromide was added and shaken for few minutes. The gel was then shifted to gel casting tray and waited for 20- 25 minutes until it gets solidified. The gel was then placed in gel tank containing 1X TAE buffer and was run by applying voltage power of 100 Volts. To estimate DNA concentration in samples, the gel was visualized under gel documentation system having UV light.
Primers
Ten SSR and ISSR primers reported by [30] and [31] respectively, were used to detect the genetic diversity in present maize genotypes (Tables 2 & 3).
Optimization of PCR Conditions
Isolated genomic DNA was used as template in amplification reaction. A reaction mixture was prepared. The PCR conditions standardized for SSR and ISSR amplification in this study was an initial denaturation at 94°C for five minutes; 35 cycles of denaturation (94°C) for 30 seconds, annealing (55°C) for 30 seconds, extension (72°C) for one minute followed by final extension at 72°C for 10 minutes. To visualize the PCR amplified material, 2 % agarose gel and 5 μL ethidium bromide was used to as dying agent so that the DNA bands could be easily visualized under UV Trans illuminator in gel documentation system. By supplying 100 V for 35 -40 minutes, PCR product was resolved. Scoring was done by comparing them with marker DNA ladder of known base pairs.
Statistical Analysis
Analysis of the maize genotypes was done through NT SYS program and all the genotypes were tested by constructing UPGMA dendrogram. Poppr package was also employed to find out the similarities and differences among and within genotypes of ten districts. Spanning trees were also constructed using Poppr software [32]. Polymorphism information content (PIC) values were calculated for each SSR and ISSR locus by formula of Smith & Smith [33].
SR and ISSR analysis were done using primers with good polymorphism and reproducibility in previous research. Dendrogram analysis revealed various grouping and clustering patterns which further partitioned genotypes at different levels of similarity and diversity. More commonness in the pedigree of genotypes depicted their closeness [34].
SSR Polymerase Chain Reaction (PCR) and Cluster Analysis
The present study was conducted to assess the genetic diversity of ten maize genotypes to find out the most diverse maize genotype. For this purpose, ten SSR primers were used (Table 4). SSR primers reported by Shah, et al. [30] were used. PCR product with primer xp-umc-1354 amplified a 250-base pair (bp) fragment in 9 maize genotypes whereas 1 genotype did not show amplification with 250 bp fragment as shown in (Figure 1a). PCR product with primer xp-umc-1824 produced bands at 255 bp and amplified all the maize genotypes (Figure 1b). PCR product with xpumc- 1184 amplified 200 bp to 500 bp fragments while 2 genotypes showed no amplification with these fragments (Figure 1c). PCR product with xp-umc-2281 produced bands at 300 bp to 450 bp and amplified all maize genotypes (Figure 1d). PCR product with primer xp-umc-1325 amplified a 250 bp fragment while remaining 3 genotypes did not show 250 bp fragment as shown in (Figure 1e). Microsatellite primer xp-umc-1186 was used to amplify 250 bp fragment in all 10 genotypes of maize (Figure 1f). PCR product with primer xp-umc-0411 produced 285 bp fragment and showed amplification in all the genotypes (Figure 1g). Primer xp-umc-1984 amplified fragment of 300 bp to 350 bp in 9 maize genotypes while remaining one genotype did not show amplification as shown in (Figure 1h).
Figure 1 Images showing the amplified PCR product generated from genomic DNA of maize genotypes (1-10) using different SSR primers. a. xp-ume-1354; b. xp-umc-1824; c. xp-umc-1184; d. xp-umc-2281; e. xp-umc-1325; f. xp-umc-1186; g. xp-umc-0411; h. xp-umc-1984; i. xp-umc-1586; j. xp-umc-1154.
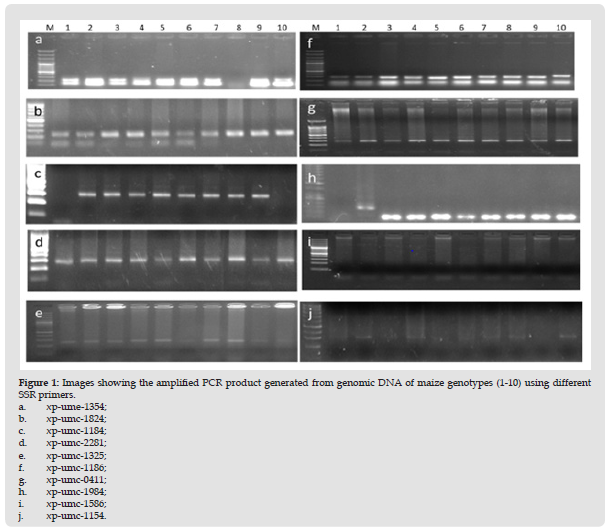
Figure 2 Dendrogram of SSR primers constructed through UPGMA (Unweighted Pair Group Method with Arithmetic mean). The x-axis shows a number of observations while y-axis shows similarity among clusters ranging from 0 to 0.35.
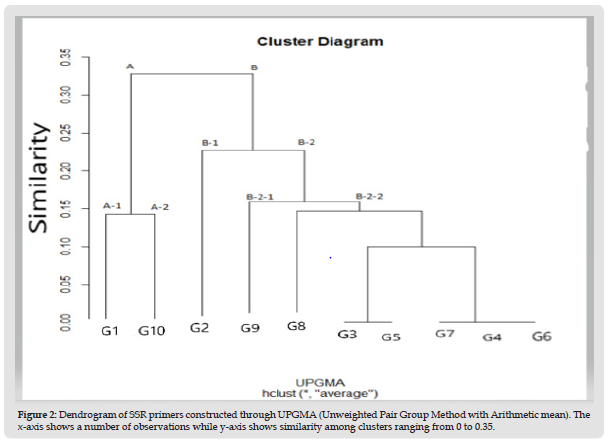
PCR product with primer xp-umc-1586 did not show amplification in any genotype (Figure 1i). PCR product with xpumc- 1354 amplified fragment at 300 bp in 4 maize genotypes while remaining 6 genotypes did not amplify 300 bp fragment as shown in (Figure 1j). The dendrogram constructed through UPGMA determined two main groups on the basis of diversity. Group A consisted of two subgroups with no clustering while group B revealed two subgroups with two clusters. Subgroup A-1 comprised of G1 and subgroup A-2 also having G7. Similarly, subgroup B-1 was having no cluster with G2. Group B-2 consisted of two clusters B-2-1 and B-2-2. Cluster B-2-1 was comprising of G9. Cluster B-2-2 contained G8, G3, G5, G7, G4 and G6 due to close resemblance with each other as per dendrogram analysis (Table 5 & Figure 2).
Molecular markers have verified valued for assessing variability among crop species. As their expression is independent of environmental issues which is more common in case of morphological markers thereby redirect the level of genetic transformation prevailing between genotypes [33,35]. SSRs have been proved to be a best option for genome mapping in maize [36]. These microsatellites are DNA markers with di, tri, or tetranucleotide motifs [37]. In the current research work, genetic diversity of ten maize genotypes grown in different areas of AJK were assessed using SSR primers (Table 6). Dendrogram analysis revealed two main groups of maize genotypes with zero to 100 percent level of diversity. Group A was having two subgroups while no cluster was seen for group A. Group A comprised of only two genotypes G1 and G7. The main portion of dendrogram consisted of Group B containing a greater number of genotypes as compared to Group A. Group B was divided into two subgroups B-1 and B-2. B-1 was without any cluster having only single G2 while sub-group B-2 was having two sub-clusters B-2-1 and B-2-2. Sub-cluster B-2- 1 was comprising only G9 while rest of genotypes such as G8, G3, G5, G7, G4, and G6 were present in sub-cluster B-2-2. The primers were used earlier on maize inbred lines in Pakistani genotypes and showed amplified fragments ranging from 250 to 750 bp. All of the primers produced remarkable results with high level of polymorphism except xp-mmc-0411 and xp-umc-11 did not amplify any genotype in previous analysis.
In the current study, xp-umc-1354, produced 4 bands with 75 % polymorphism and 0.2275 PIC value. Primer xp-umc-1824 produced 2 bands with 50 % polymorphism and PIC value of 0.127. Microsatellite SSR xp-umc-1184 produced 2 bands with 100 % polymorphism and 0.132 PIC. SSR xp-umc-2281 produced 2 bands with 50 % polymorphism and 0.48 PIC value. Primer xp-umc-1325 produced 3 bands with 66% polymorphism and 0.186 PIC value. Xp-umc-1186 produced 4 bands with 50 % polymorphism and 0.495 PIC value. Primer xp-mmc-0411 produced 2 bands with 50 % polymorphism and 0.169 PIC. Primer xp-umc-1984 produced 3 bands with 50 % polymorphism with 0.88 PIC. But xp-umc-1586 did not amplify any genotype. However, xp-umc-1154 produced 2 bands with 100 % polymorphism and 0.68 PIC (Table 7). Ten SSR primers produced 26 bands for ten maize genotypes. Among these bands, 9 were monomorphic and 17 were polymorphic. All of these showed a different level of polymorphism. Primers xp-umc-1154 and xp-umc-1184 showed maximum polymorphism (100%) while lowest polymorphism (0 %) was shown by primer xp-umc-1586. Similar work has been done by [38] using six SSR primers for assessing molecular diversity of maize inbred lines in Bangladesh. The PIC value determined in our findings are well correlated with these investigations. SSR primers are characterized by a great abundance [39], high variability [9,40] and even distribution throughout a wide range of genomic regions [41,42]. They are codominant, highly polymorphic, multi-allelic and have become the marker of choice for genetic analysis in crops [43].
ISSR PCR and Cluster Analysis
Genetic diversity of ten maize genotypes of AJK were detected by ISSR primers previously reported by [31]. ISSR UBC-801 produced bands starting from 100 bp to 1500bp. Nine genotypes out of ten showed banding pattern by this primer whereas one genotype did not produce any amplified fragment (Figure 3a). Microsatellite marker ISSR UBC-802 produced bands starting from 500 to 1200 bp. Out of ten genotypes, five produced remarkable bands whereas no band was shown by rest of the five genotypes (Figure 3b). ISSR UBC-803 produced banding pattern ranging from 500 to 900 bp. All ten genotypes showed remarkable banding series by this primer (Figure 3c). ISSR UBC-804 produced bands ranging from 380 bp to 1200 bp. Eight out of ten genotypes produced bands while two genotypes showed no band formation (Figure 3d). ISSR UBC-805 produced bands starting from 300 bp to 1200 bp. All genotypes were amplified by this primer (Figure 3e). ISSR UBC-806 produced bands ranging from 250 bp to 1500 bp. Nine genotypes out of ten showed banding pattern by this primer whereas in one genotype no band was produced (Figure 3f). ISSR UBC-807 produced bands starting from 200 bp to 1500 bp. This primer amplified DNA fragments in all 10 maize genotypes (Figure 3g). ISSR UBC-808 did not amplify fragments. All the ten genotypes indicated no band formation (Figure 3h). ISSR UBC-809 produced bands ranging from 370 bp to 800 bp.
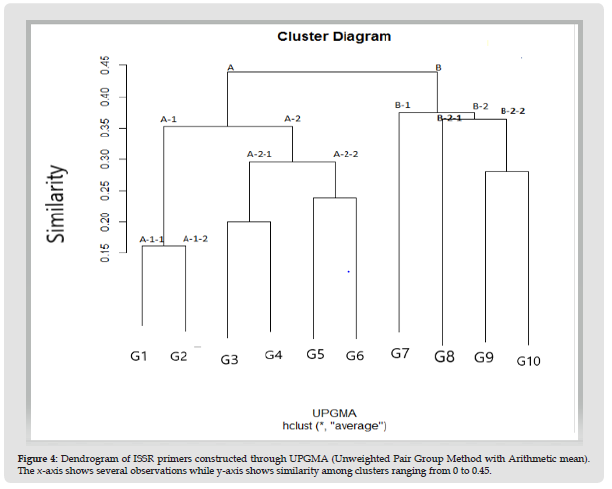
Eight genotypes out of ten showed banding pattern by this primer whereas two genotypes exhibited no band formation (Figure 3i). ISSR UBC-810 produced bands starting from 100 bp to 210 bp. All of the ten genotypes produced amplified fragments by this primer (Figure 3j & Table 8). Dendrogram analysis divided ten genotypes of maize in two broader categories A and B which were further divided into subgroups and sub clusters at 0 to 100 % level of similarity and diversity among genotypes. Group A comprised of a greater number of genotypes containing six genotypes out of 10 as compared to group B. Group A was further divided into subgroups A1 and A2. Subgroup A1 was divided into sub clusters A-1-1 and A-1-2 comprising G1 and G2 respectively. While subgroup A2 clustered into A-2-1 containing genotype 3 and 7 and A-2-2 comprising G5 and G8. Group B was also divided into subgroups B1 and B2. B1 carried only single genotype G4. B2 further categorized into clusters B- 2 -1 containing G7 and B- 2-2 comprising of G6 and G9 (Table 9) and (Figure 4). Similarity coefficient was ranging from 0.15 to 0.45. To find out the genetic diversity, different techniques have been used such as morphological features, pedigree information and most common use of molecular markers [44,45]. For successful breeding programs, assessment of genetic diversity by use of molecular markers for crop species are gaining worldwide importance [46,47] as molecular marker schemes are usually reflected to be autonomous of environmental stimulus and can accurately cover the genome.
Figure 3 Images showing the amplified PCR product generated from genomic DNA of maize genotypes (1-10) using different ISSR primers. a. UBC-801; b. UBC-802; c. UBC-803; d. UBC-804; e. UBC-805; f. UBC-806; g. UBC-807; h. UBC-808; i. UBC-809; j. UBC-810.
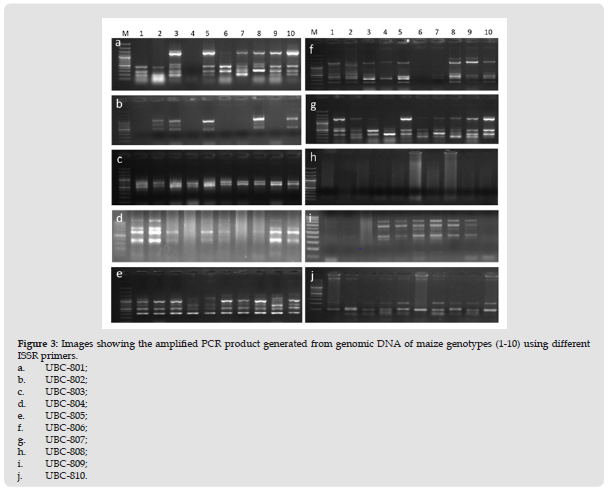
Figure 4 Dendrogram of ISSR primers constructed through UPGMA (Unweighted Pair Group Method with Arithmetic mean). The x-axis shows several observations while y-axis shows similarity among clusters ranging from 0 to 0.45.
Because of their residency in the whole plant body, these markers are not affected by environmental, pleiotropic or epistatic phenomena [7]. Molecular markers have presented marvelous offerings in the consideration of genetic analysis, mapping of genome and survey of population demographic studies [48,49]. In the current analysis, ten ISSR primers were adopted to assess the genetic diversity among ten maize genotypes grown all over AJK (Table 10). These primers were early used to detect the genetic variation among 21 maize accessions in Pakistan [31]. Primer UBC-801 produced 11 bands with 0.88 PIC value and 100 % polymorphism. Primer UBC-802 produced 4 bands with 0.72 PIC value and 100% polymorphism. UBC-803 produced 4 bands with 0.37PIC value and 50% polymorphism. UBC-804 produced 3 bands with 100 % polymorphism and 0.57 PIC. UBC-805 produced 5 bands with 80 % polymorphism and 0.81 PIC. UBC-806 produced 8 bands with 0.54 PIC and 75 % polymorphism. UBC-807 produced 5 bands with 60 % polymorphism and scored 0.27 PIC value. UBC- 808 did not prove good in amplification and revealed 0 PIC value.
UBC-809 produced 5 bands with 100 % polymorphism and 0.58 PIC value. UBC-810 produced 2 bands with 50 % polymorphism and 0.095 PIC value (Table 11).
Dendrogram interpretation revealed two main groups A and B. Overall Group A having maximum number 6 of the total genotypes whereas group B contained only 4 genotypes. Group A was divided into subgroups A1 and A2. Cluster A-1-1 consist of G1 and cluster A-1-2 containing G2. Cluster A-2-1 containing G3 and G7 and cluster A- 2- 2 consisted of G5 and G8. Based on ISSR molecular characterization, genotypes 3 and 7 and 5 and 8 were closely associated to each other revealed through dendrogram analysis of maize genotypes based on similarity matrix generated through UPGMA. Group B was further divided into subgroups B1 and B2. Subgroup B1 was having single genotype G4. B2 was further clustered into B-2-1 and B-2-2. B-2-1 was comprising single G7 and B-2-2 was comprising G6 and G9. Both of these were showing close resemblance to each other.
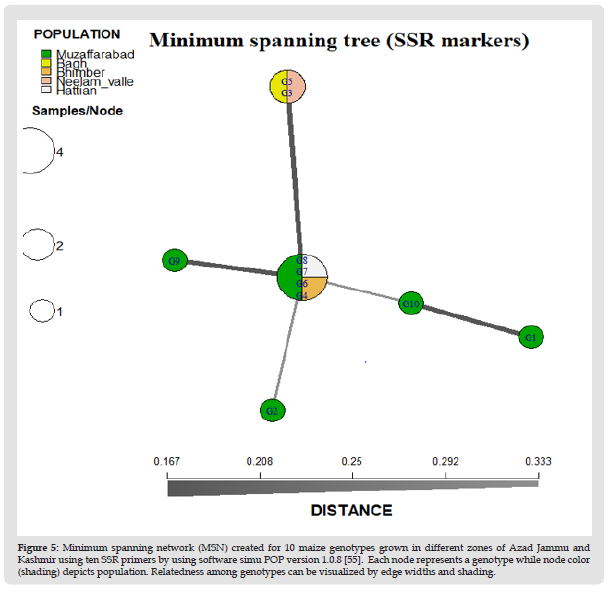
Figure 5 Minimum spanning network (MSN) created for 10 maize genotypes grown in different zones of Azad Jammu and Kashmir using ten SSR primers by using software simu POP version 1.0.8 [55]. Each node represents a genotype while node color (shading) depicts population. Relatedness among genotypes can be visualized by edge widths and shading.
Comparison within and Among Genotypes of Different Areas of Azad Kashmir
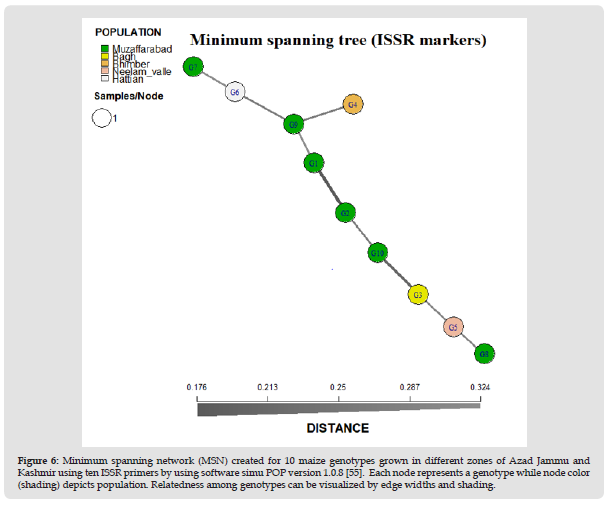
Discernment analysis of ten genotypes in the present study was investigated through Poppr package software [32]. Genotypes were selected from different localities of AJK. These areas are Muzaffarabad, Hattian Bala, Neelam Valley, Bhimber and Bagh. Utilizing Poppr software, minimum spanning network (MSN) was constructed for SSR and ISSR to show the difference between all the genotypes selected from different areas of AJK. Through spanning tree constructed for SSR, genotypes were allocated at different distances on the basis of similarity and dissimilarity between them. G8 and G7 from Muzaffarabad showed close genetic relationship because they were at very little distance to each other in the minimum spanning tree generated. G6 and G4 were also present closely to each other. Though these two genotypes were collected from different localities but genetically they showed close relatedness so it can be assumed that they have evolved from a common ancestor. G8, G7, G6 and G4 were closely related to G2 and G10 as compared to G1, G9, G3 and G5. Although G3 and G5 belong to different geographical regions but are at very little distance to each other showing genetic similarity (Figure 5). Spanning tree for ISSR primers revealed that genotypes were at different positions in minimum spanning tree. Almost all genotypes were lying at close distance among each other. The line connecting these genotypes depicted the burvo distance between these genotypes. If the line is thin, genotypes show close resemblance while thick line depicts genetic dissimilarity. In MSN, G9 showed close relatedness with G1 and G6 which is from different locality and also closely related with G7. G1 and G2 both are from same population of Muzaffarabad but were genetically dissimilar. G10 was showing relatedness with G2 but not showing resemblance with G3. G3 was showing close relation with G5, both occupying close genetic distances. G5 also depicted resemblance to G8, though both belong to different regions but having genetic similarity (Figure 6).
Figure 6 Minimum spanning network (MSN) created for 10 maize genotypes grown in different zones of Azad Jammu and Kashmir using ten ISSR primers by using software simu POP version 1.0.8 [55]. Each node represents a genotype while node color (shading) depicts population. Relatedness among genotypes can be visualized by edge widths and shading.
Overall examination by ISSR revealed total of 48 bands generated from ten genotypes of maize. Out of these, 10 were monomorphic and 38 were polymorphic bands representing all the amplified loci with an average of 3.9 polymorphic bands produced by each of the primer. Number of maximum alleles were produced from ISSR UBC-801 and minimum by UBC -808. UBC-808 did not amplify any locus in any genotype. The highest polymorphism was produced by primers UBC- 801, 802, 804 and 809 while the lowest was produced by UBC-808. Average polymorphism for all ten ISSR was calculated as 71.5%. ISSR UBC-805 produced maximum number of locus amplified while minimum number of locus were amplified by UBC-802 and 808. UBC-803, 804, 806, 807, 810 amplified maximum number of genotypes while minimum number of genotypes were amplified by ISSR UBC- 802 and 808. The PIC value was calculated by the formula of Smith, et al. [33] and it ranged from 0.27 to 0.88. Average PIC calculated for all ISSR primers was 0.572.
SSR analysis revealed total of 26 bands generated from ten genotypes of maize. Out of these, 9 were monomorphic and 17 were polymorphic bands representing all the amplified loci with an average of 1.5 polymorphic bands produced by each of the primer. Number of maximum alleles were produced from xp-umc-1354 and xp-umc-1186 and minimum by xp-umc-1586 which amplified single locus in genotype. The highest polymorphism was produced by primers xp-umc-1184 and xp-umc-1154 while the lowest was produced by xp-umc-1586. Average polymorphism for all ten SSRs was calculated as 57.4. xp-umc-1354 and 1186 amplified maximum number of locus while minimum number of locus were amplified by xp-umc-1184 and 1586. Primers xp-umc-1824, 2281, 1186 and 0411 amplified maximum number of genotypes while minimum number of genotypes were amplified by xp-umc-1184 and -1586. The PIC value ranged from 0.12 to 0.88. Average PIC calculated for all SSR primers was 0.337.
Comparison of SSR and ISSR Markers
Genetic diversity analysis was carried out by SSR and ISSR primers. SSR primers are highly monomorphic, co-dominant and reproducible. SSRs have recorded high rate of polymorphism for crop plants so they are best choice to be used for assessing genetic diversity because of their easy manipulation [50]. Dendrogram cluster analysis revealed that ten maize genotypes were allocated in two main groups A and B by SSR primers. Both of these groups were further segregated into sub- groups and clusters. Earlier reports have demonstrated more divergence of SSR primers [51- 53] than ISSR. But in our study, ISSR primers proved better for maize genotypes. In the present study, ISSR primers proved to be more efficient as they produced polymorphic bands, capable to amplify multiple loci and well described the diversity among maize genotypes grown all over in AJK. Maximum polymorphism was presented by ISSR markers i.e. UBC- 801, 802, 804 and 809 whereas other primers depicted low polymorphism. ISSRs have been applied successfully in population genetic studies for a variety of organisms, including clonal plants [54,55]. It was further confirmed by the cluster analysis and dendrogram that ISSR primers segregated into more inter clustering and subgroups as compared to SSR primers.


