info@biomedres.us
+1 (502) 904-2126
One Westbrook Corporate Center, Suite 300, Westchester, IL 60154, USA
Site Map
Received: November 02, 2022; Published: November 11, 2022
*Corresponding author: Wanjiang Yu, Department of Medical Imaging, Qingdao Municipal Hospital, Qingdao, 266071, Shandong, China
DOI: 10.26717/BJSTR.2022.47.007451
Purpose: This study aimed to assess the influence of different collimations on bone mineral density (BMD) measurements by Dual-energy computed tomography (DECT) using the European spine phantom (ESP).
Methods: To simulating abdominal total adipose tissue (TAT) of the patients as normal, overweight and obese, ESP was wrapped by fresh subcutaneous fat from pigs of 200cm²,320cm2 and 400cm2, respectively. The ESP was scanned by DECT with two kinds of collimations (group 40 (640.625mm) and group 80 (1280.625mm), respectively), and CTDI was recorded. The relative measurement error (RME, %) and the root mean square error (RMSE) of HAP (water) values were calculated to assess the accuracy by paired t-test. In addition, correlation and agreement analyses were performed using Pearson correlation, linear regression, and Bland-Altman plots.
Results: When TAT was 200cm², HAP values between two groups were significantly different in L1(P<0.01) and L2(P<0.0001), except for L3. For L1 and L2, RMEs and RMSEs in group 40 were obviously lower than those in group 80. When TAT was 320cm2 and 420cm2, there were no statistically significant differences for these values between the two groups. There was good correlation and agreement between the measurements of two collimations. The values of CTDI were 9.09mGy and 8.83mGy for group 40 and 80, respectively.
Conclusions: For the patients as normal, especially with bone loss and osteoporosis, 40mm-collimation shows higher accuracy than 80mm-collimation on BMD measurements by DECT. For the overweight and obese patients, there was no significant difference between the two collimations, and 80mm-collimation is recommended to reduce the radiation dose.
Keywords: Dual-Energy Computed Tomography; Collimation; Phantom; Bone Mineral Density; Osteoporosis
Abbrevations: DECT: Dual-Energy Computed Tomography; ESP: The European Spine Phantom; BMD: Bone Mineral Density; ASiR-V: Adaptive Statistical Iterative Reconstruction-V; CTDI: Computed Tomography Dose Index
Osteoporosis is a well-known bone disease characterized by decreased bone strength due to weakened bone micro architecture and increased vulnerability to fractures [1]. As demographics change, it is becoming an increasing burden of global healthcare [2]. Therefore, it is becoming more and more important to assess bone mineral density (BMD) accurately. In the past, the diagnosis of osteoporosis used DXA examination and Quantitative computed tomography (QCT) usually. However, both techniques have their respective limitations [3-6]. With the continuous development of Dual-energy computed tomography (DECT) in recent years, its advantages in clinical BMD measurement are gradually reflected [7-9]. Li et al. demonstrated that BMD can be measured with even smaller bias using DECT compared to QCT [10]. DECT characterized the composition of tissues using the differences in attenuation between two x-rays of high and low tube voltages [11].
Previous studies have explored some suitable scanning parameters for BMD measurements by DECT. Huang. et al. have explored that using tube voltage 140/100 kV, tube current 230 m As and rotation speed 8s/rot can further ensure the accuracy of the measurement [12]. Collimation is also one of the important parameters of CT scanning. However, it is rarely discussed the effect of different collimation on the accuracy of BMD measurement by DECT. In this study, we attempted to evaluate the influence of different collimations on BMD measurements by DECT. Considering the possible effects of fat and better linking to the clinical practice, the ESP we used was wrapped by fresh subcutaneous fat from pigs of 200cm², 320cm2 and 400cm2, simulating abdominal total adipose tissue (TAT) of the patients as normal, overweight and obese, respectively [13].
An European spine phantom (ESP; QRM GmbH, Moehrendorf, Germany) used in this study containing three hydroxyapatite (HAP) inserts with densities of 50mg/cm3(L1), 100 mg/cm3(L2), and 200 mg/cm3(L3), respectively. The ESP was wrapped in fresh subcutaneous fat from pigs. The TAT of 200cm²,320cm2 and 400cm2 were measured by QCT and adjusted manually, respectively (Figure 1). The scanning parameters of QCT were as follows: 120 kV, smart mA (200-370mA), 0.8s/r and 0.992:1. The QCT examinations with the Mindway calibration phantom underneath the ESP.
The ESP was scanned on a 256-rows detector spectral CT system (Revolution CT, GE Healthcare, Waukesha, WI, USA). In the spectral CT protocol, two kinds of collimations (group 40 (64×0.625mm) and group 80 (128×0.625mm), respectively)was selected to scan the ESP wrapped by the fresh subcutaneous fat from pigs. Scans were repeated 10 times in each group. Each scan covers the same area, and the computed tomography dose index (CTDI) was recorded. (Table 1) shows the detailed scanning parameters of group 40 and 80. The BMD images with HAP and water as the base material pair were reconstructed. In these reconstructions, the image section thickness was 1.25 mm. Then the reconstructed images were transmitted to the GE AW4.7 workstation, and the MD Analysis in the GSI Viewer software was selected. The region of interest (ROI,15mm×15mm) was set at the central level of L1-L3 vertebrae, avoiding the high BMD areas such as bone cortex and pedicle (Figure 1). The HAP (water) values of L1-L3 vertebrae were measured and recorded.
Figure 1:
a) The central level TAT of L1 measured by QCT, the blue part outside the green aperture is the measurement range.
b) The HAP (water) value of L1measured by DECT, the yellow circle is ROI (15×15mm).
c) The central level of L1.

Table 1: Scanning parameters.

SPSS statistical analysis software (v.23.0; IBM) was used for statistical analysis. The relative measurement error (RME, %) and the root mean square error (RMSE) of HAP were calculated through the following equations to assess the accuracy of measurement.
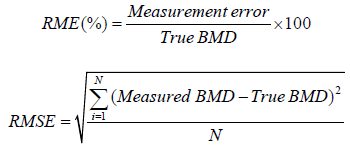
In addition, the paired t test was used to compare values for L1- L3 on group 40 and 80, a p value of less than 0.05 indicated a statistically significant difference. Linear regression was used to calculate formulas to make the measurement closer to the true BMD value. The correlation analyses were determined by the Pearson correlation test. Bland-Altman analysis was conducted to assess agreement between the measurements of two groups.
Overall correlation analysis showed strong correlation between the measurements of two groups and the true BMD values (r = 0.99; p < 0.001), When TAT was 200cm2,320cm2 and 420cm2, respectively. Furthermore, the measurements of group 40 were highly correlated to group 80(r = 0.99; p < 0.001). The corresponding Bland-Altman plot demonstrated substantial agreement between group 40 and 80 (Figure 2).
Figure 2:
a) TAT=200cm²
b) TAT=320cm²
c) TAT=400cm². The Bland-Altman plots show the agreement of the HAP (water) values of L1-L3 between group 40 and group 80. Solid line: mean BMD difference. Dot line: 95% limits of agreement (mean difference ±1.96 standard deviation). BMD, bone mineral density. TAT, the total adipose tissue.

When TAT was 200cm², HAP values between two were significantly different in L1(P<0.01) and L2(P<0.0001), except for L3. For L1 to L3, in group 40, RMEs were 2.12,1.17 and 2.59, respectively, and RMSEs were 0.44, 0.65 and 1.64, respectively. In group 80, RMEs were 7.57, 3.70 and 2.56, respectively, and RMSE were 1.29,1.30 and 1.64, respectively. For L1 and L2, RMEs and RMSEs in group 40 were obviously lower than those in group 80(Table 2). When TAT was 320cm2 and 420cm2, respectively, there were no statistically significant differences for these values between the two collimations (Figure 3).
Figure 3:
a) TAT=200cm²
b) TAT=320cm²
c) TAT=400cm². Compare the difference of measurements using 40mm-collimation (light blue column) and 80mm-collimation (dark blue column), (ns P>0.05,** P<0.01,**** P<0.0001). L1 (50mg/cm3), L2(102mg/cm3), and and L3(197mg/cm3) represent the vertebrae of different BMD values.

Table 2: HAP (water) measurements of the 40mm and 80mm-collimations.

Note: The true BMD values for L1, L2 and L3 are 50 mg/cm3,102 mg/cm3 and 197 mg/cm3, respectively. Mean±SD: mean ± standard deviation. RME: relative measurement error. RMSE: the root mean. square error. 40mm: 40mm-collimation. 80mm: 80mmcollimation.
For TAT= 200cm², linear regression analysis was performed on the HAP (water) values of group 40 and 80 for reducing deviations. For group 40, the regression equation was y=1.0431x-3.1983 with R2=0.9995. Using this equation, the values for L1, L2 and L3 were 50.06±1.00mg/cm3,101.95±1.84mg/cm3 and 196.98±1.61mg/cm3, respectively, and RMSEs were scaled to 0.30,0.5 and 0.31, respectively. For group 80, the regression equation was y=1.0671x-8.6992 with R2=0.9986 (Figure 4). Using this equation, the values for L1, L2 and L3 were 48.69±1.70mg/cm3, 104.18±1.61mg/cm3 and 196.13±1.69mg/cm3, respectively, and RMSEs were scaled to 0.65,0.84 and 0.57, respectively.
Figure 4:
a) Linear regression of the HAP (water) values for L1-L3 on 40mm-collimation.
b) Linear regression of the HAP (water) values for L1-L3 on 80mm-collimation. /cm3. 40mm: 40mm-collimation. 80mm: 80mmcollimation. The true BMD values for L1, L2 and L3 are 50 mg/cm3,102 mg/cm3 and 197 mg/cm3, respectively.

In this study, we assessed the influence of different collimations on BMD measurements by Dual-energy computed tomography using ESP. For the patients as normal (TAT=200cm²), the measurements between 40mm-collimation and 80mm-collimation were significantly different in L1(P<0.01) and L2(P<0.0001), except for L3. And RMEs and RMSEs in group 40 were obviously lower than those in group 80. It means that the accuracy of BMD measurement using 40mm-collimation is better than 80mm-collimation for L1 and L2. The possible reason for this result is that 40mm-collimation field would have the smaller thickness, the increased spatial resolution and contains more details, reducing part of the volume effect and making the HAP (water) values more accurate, compared to 80mm-collimation. Furthermore, the result may be relevant to cone beam effect increased as the collimation wide increases [14]. Though the HAP (water) values for L3 were not significantly different between two groups(P> 0.05), it had little value in routine clinical practice. However, For the overweight and obese (TAT=320cm², 400cm²), there was no significant difference between the measurements of two collimations, which may be related to the effect of abdominal adipose tissue on BMD measurement by dual-energy computed tomography.
For collimation of DECT, some studies have shown the effect of the different collimations on CT scans of different organs. Wang, et al. [15] demonstrated that using 40 mm collimation was more conducive to fill of small vessels and reduce the radiation dose compared to 80mm collimation, when applying automatic tube current modulation (ATCM) technique on head/neck CTA. Yuan, et al. [3] have shown that for using ATCM technique on chest CT scan, 40 mm collimation can reduce radiation dose while ensuring image quality. However, in our study, CTDI values of 40mm collimation was lower than 80mm collimation, which may be because of the application of the ATCM technology. ACTM can be automatically and accurately adjusted tube current according to the changes of information in scan-layer, such as the thickness, density and atomic number of the tested part [4]. But the tube current we used was fixed during the scanning process, which may be the reason why the results are inconsistent.
According to the International Society for Clinical Densitometry (ISCD), DXA and QCT have been used as the main clinical techniques to diagnose osteoporosis [5]. However, both techniques have their respective limitations. As a measure of areal bone mineral density (aBMD), DXA is biased by covering soft tissue and calcified structures. Though QCT is a 3-dimensional measurement of bone density (mg/cm3), it does have several drawbacks, including underestimate trabecular volumetric BMD (vBMD) [6,16-17]. With the continuous development of Dual-energy computed tomography in recent years, its advantages in clinical BMD measurement are gradually reflected [7-9]. Patients can benefit from BMD measurements by CT examinations, resulting in reduced cost and radiation exposure. DECT has a higher correlation with bone strength and can provide more information and reference [18]. Koch V, et al. [19] have shown that it has a higher accuracy compared with QCT. The results of our study also have shown the feasibility of BMD measurement by DECT using 40mm-collimation or 80mm-collimation. Overall correlation analysis showed strong correlation between the measurements of two groups and the true BMD values (r = 0.99; p < 0.001), When TAT was 200cm2, 320cm2 and 420cm2, respectively. Furthermore, the measurements of group 40 were highly correlated to group 80(r = 0.99; p < 0.001). The corresponding Bland-Altman plot demonstrated good agreement between group 40 and 80.
Several studies have explored some suitable scanning conditions for BMD measurements by DECT. Huang, et al. [11] showed that Scanning conditions are as follows: tube voltage 140/100 kV, tube current 230 m. As and Rotation speed 8s/rot, which can further ensure the accuracy of the measurement. Some studies found that the use of HAP/water as a base material is more accurate for the measured bone density and can most accurately quantitatively evaluate bone strength [20-21]. However, it is rarely discussed the effect of different collimations on its accuracy of bone mineral density measurement by DECT. In this study, the optimized scan protocol and the HAP (water) values were selected to evaluate the influence of the different collimations by energy spectrum CT on BMD measurement. Moreover, DXA and QCT on BMD measurement were influenced by fat content significantly [22]. So, to better related to clinical practice closely, the fresh subcutaneous fat from pigs of different TAT was selected to wrap the ESP around, simulating abdominal adipose tissue of the patients as normal, overweight and obese, respectively.
This study has certain limitations that need to be addressed. First, we used the phantom only considering the factor of fat. The impact of these factors on BMD assessment, such as age and gender, was not possible to assess in our phantom study and should be considered in future clinical studies. Second, the optimized scan protocol of DECT was based on the ESP phantom, and whether it is still the best scan condition under the influence of abdominal fat deserves further investigation. In addition, only the results of the dual-energy spectral scan between 40mm collimation and 80mm collimation were compared. It will be interesting to investigate the effect of QCT using different collimation on measuring BMD.
In summary, for the patients as normal, especially for the patients with bone loss and osteoporosis, 40mm collimation shows higher accuracy than 80mm collimation on BMD measurements by DECT. And the corrected HAP (water) measurement value can be made closer to true BMD value by the linear regression analysis. For the overweight and obese patients, there was no significant difference between the two collimations, and 80mm collimation is recommended to reduce the radiation dose.
The successful completion of this paper is inseparable from the tutor’s careful guidance and my classmates’ help. From the beginning of the topic selection to the completion of the opening report, the revision of the first draft, the adjustment of the final draft, they gave a lot of care and help. Moreover, I would like to thank my family for their understanding and support.
Authors declare that there is no conflict of interests.


