 Research Article
ABSTRACT
Lower lip (compression) and thumb-index finger (pinch) isometric force dynamics data were collected from 29 neurotypical children ages 7-12 years during a cued visuomotor ‘ramp-and-hold’ task. These children were stratified into two age groups, including a younger age group (N=16, age 7.6-9.9 years) and an older age group (N=13, age 10-12.3 years). Dependent measures included maximum voluntary contraction force (MVCF), reaction time, maximum rate of force change (dF/dtmax), peak force during recruitment, and hold phase mean and standard deviation, and hold phase criterion percentage (±5% of target force). Biomechanical data were sampled in real-time using the ForceWIN10 system for 29 children (13M/16F; 27 right-handed, 2 left-handed). Participants were instructed to track their real time force output and contract the muscles of interest as ‘rapidly and accurately’ to computer displayed endpoint target forces (0.25N, 0.5N, 1N, 2N) presented to an HD monitor in a randomized block design. using visually guided force targets displayed on a laptop screen. Results indicated main effects related to age and muscle group tested. The younger children had poorer isometric force end-point accuracy and greater inconsistency in holdphase stability when compared with older children. The lower lip showed slower reaction times, lower MVCF, and greater hold-phase variability and standard deviation than the fingers.
Keywords: Force Dynamics; Lower Lip, Thumb-Index Finger Pinch; Isometric; Children; Linear Mixed Modeling
Introduction
Biomechanical analyses of active force dynamics can be used for clinical assessment of muscle force control of single motor subsystems, including force control in the tongue, lips, jaw, and digits Barlow, et al. [1-3]. Custom designed force transducers with real time visuomotor tracking software can be used to measure muscle forces in individuals with neuromotor disorders such as Parkinson’s disease and cerebral palsy. The resulting data can be used to predict motor speech impairments and develop corresponding rehabilitative measures Barlow, et al. [1,4]. Furthermore, there is evidence that the sensitivity of strain gage force transducers can be used to precisely measure patterns of muscle force impairment that were not evident from a neurological evaluation, as well as to track changes in orofacial and limb muscle function across the lifespan during periods of recovery and assess the efficacy of motor rehabilitation Barlow, et al. [5-8].
This aim of the present study was to establish normative data regarding fine muscle force dynamics in the lower lip (lower lip compression) and thumb-index finger (pinch grip) of neurotypical children at 0.25, 0.50, 1.00, and 2.00 N (Newtons), which represent less than 20% of a maximum contractile force for these muscle systems typically used in skilled movements. Independent variables examined included target force level, muscle group, sex, and age. Dependent measures included maximum force, reaction time, maximum rate of force change, standard deviation, hold phase criterion percentage, mean force, and peak force. Hypotheses were formulated regarding the dependent variables. A sex effect was anticipated for maximum force measurements. It was expected that an age effect would be present for maximum forces based on increasing muscle mass with age, as well as in hold phase criterion percentage based on fine motor control development. Similarly, it was predicted that the standard deviation of active force would decrease with age due to increasing fine motor control with maturation. Based on results present in adults, a sex effect is not expected for reaction time and a positive relationship was expected between target force and maximum rate of force change Barlow, et al. [9].
Materials and Methods
Participants
Twenty-nine (29) neurotypical children (16F/13M, 9.82 [SD = 1.34] years old) were recruited for the study. These children were stratified into two age groups, including a younger age group (N=16, 7.6-9.9 years, 8.81 [SD = 0.72]) and an older age group (N=13, 10- 12.3 years, 11.07 [SD = 0.77]). Child assent and written informed parent/guardian consent were recorded following University of Nebraska Institutional Review Board approval. Inclusion criteria: no report of injury or illness affecting the nervous system. Exclusion criteria: traumatic injury to the hands or face resulting in sensorimotor impairment, and traumatic brain injury or neurologic disease resulting in sensorimotor impairment to the orofacial or hand movements.
Instrumentation
Research participants were assessed using the ForceWIN10 system, a biomechanics visuomotor tracking application that runs on a DELL XPS laptop PC (MS WIN10 x64) with a 15” HD touchscreen display to measure muscle force output for both diagnostic and therapeutic purposes Greenwood, et al. [8]. ForceWIN10 measures voluntary fine force muscle dynamics in both the lower face (tongue, lips, and jaw) and the hand (thumb-index finger pinch). The ForceWIN10 connects to our custom designed Bluetooth low-energy (BLE) strain gage sensors to measure active forces generated by the participant. There are separate transducers used to sample active force dynamics for orofacial and thumb-index finger muscle systems (Figure 1). The transducer for the thumbindex finger pinch is composed of a Cooper Instruments load cell (Model LKCP 410-25 lb; Warrenton, VA, USA) and a Li-ion battery. For the finger transducer, the load cell sensitivity is 1.17mV/V at 100% load (111N). The orofacial transducer is composed of a stainless steel jaw cantilever, lip cantilever, and titanium maxillary and mandibular dental trays. For the orofacial transducer, the lip cantilever sensitivity is 2.03 mV/V at 100% load (40N) Greenwood, et al. [8]. In this study, a pediatric-sized jaw tray set was attached to the transducer apparatus to measure muscle force output of the lower lip. A dental impression mold was created for both the maxillary and mandibular dental trays, so that users could bite down on the trays comfortably to keep the transducer stable in the mouth while testing the muscle groups of interest. The dental molds were made using a polyvinylsiloxane impression material (Kerr Extrude XP, Kerr Corporation, Romulus, MI, USA) Barlow, et al. [3].
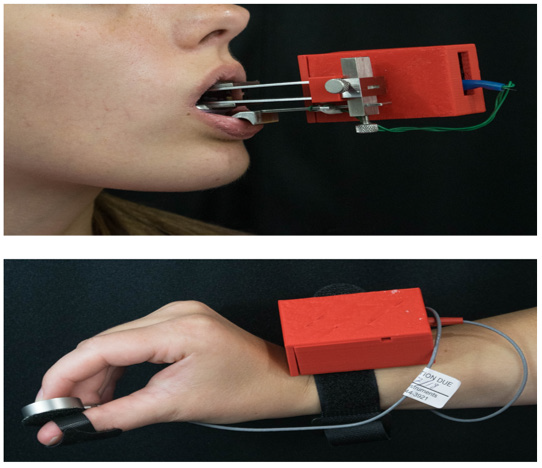
Figure 1: Wireless Bluetooth orofacial and finger pinch force transducers.
Protocol
Participants completed a series of visuomotor isometric ‘rampand- hold’ muscle contractions to target forces of 0.25, 0.5, 1, and 2 N in a randomized block design while seated in front of a laptop display. Participants were prompted to contract their muscles ‘rapidly and accurately’ and hold the contraction for approximately 5 seconds before relaxing. Ten ramp-and-hold contractions were completed at each force level for a given structure. For each structure, following the ramp-and-hold trials, participants were asked to contract their muscles maximally for 2 seconds and subsequently relax (3 repetitions) to collect MVCF data. The protocol consisted of 43 trials per structure (lower lip, right thumbfinger pinch, and left thumb-finger pinch). Test order for structure was also randomized for all participants.
Force Signal Processing
A low-pass filter was applied for each ‘ramp-and-hold’ contraction (finite impulse response (FIR) filter at 40 Hz, with high stopband and flat passband attenuation). The terminal holdphase was divided into T1 (2.0-3.4s) and T2 (3.4-4.8s). Hold-phase criterion percentage was calculated using the data points in T1 or T2 that were in the range of ±5 % of the target force measure. Hold phase mean force was calculated for T1 and T2. Baseline force was calculated by finding the mean during the first 100ms of a force trial. The first derivative maxima (dF/dtmax) were used to compute the maximum rate of force change (N/s). During the recruitment phase, peak force was computed by finding the maximum force in the first 2 seconds of a trial. Lastly, reaction time was calculated by linearly interpolating a value when the force was γ standard deviations (SD) above the baseline.
Statistical Analysis
Linear mixed modeling was conducted for each dependent variable [peak force (N), dF/dt (N/s), reaction time (seconds), mean force for T1 and T2 (N), standard deviation for T1 and T2 (N), holdphase criterion for T1 and T2 (proportion within +/- 5% target), and maximum force (N)] to estimate overall difference between muscle groups (right thumb-index finger, left thumb-index finger, lower lip; i.e., muscle effect), change in the dependent variable as a linear or polynomial function of target force (0.25, 0.5, 1, and 2 N; i.e., force effect), and muscle group difference in this change (i.e., muscle-by-force interaction effect). The models accounted for participants’ sex and nesting of repeated measurements within participants, thereby providing unbiased estimates of the model effects. When the muscle and/or muscle-by-force interaction effect was significant, adjusted means were pairwise compared at a Bonferroni corrected alpha level while controlling for Type I error at the nominal level. A proper error covariance structure was determined for each dependent variable based on model fit (i.e., adjusted Akaike Information Criterion, Bayesian Information Criterion). All analyses were conducted using SAS 9.4 SAS Institute [10] and statistical significance was determined at .05 alSignificant improvements in the performance of active force dynamics were apparent for boys and girls between the younger and older age
Results
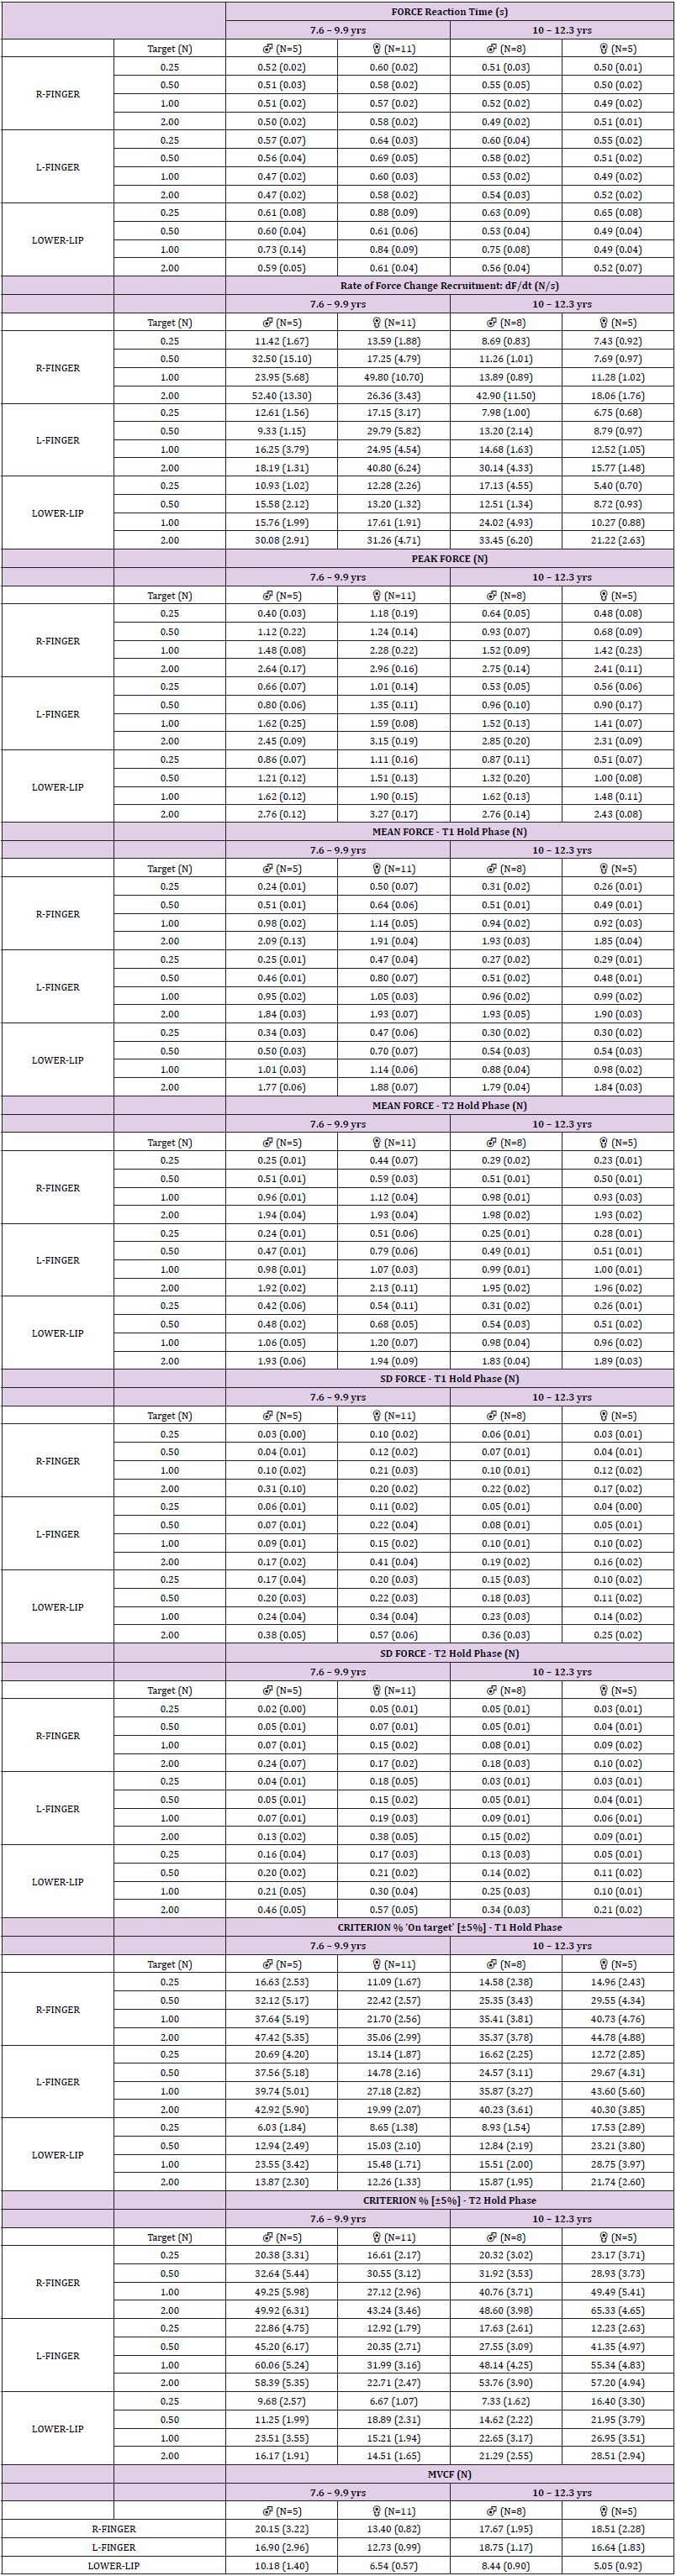
Table 1: Descriptive summary statistics for ‘ramp-and-hold’ isometric force dynamics in children stratified by age group among selected dependent measures [ ± SEM].
Significant improvements in the performance of active force dynamics were apparent for boys and girls between the younger and older age cohorts, and between the face and digits. An example of individual ramp-and-hold isometric force trials during the ForceWIN10 visuomotor tracking paradigm for the left finger, right finger, and lower lip are shown for two males, at age 8 and 12 years in Figure 2. Waterfall displays are shown at each of the four target force levels for each muscle system. A performance advantage is evident for the left and right thumb-index finger pinch force productions compared to the lower lip during compression. A notable improvement can also be seen between the 8 year-old and 12 year-old males performing similar tasks. Corresponding force heat maps are shown below each of the waterfall displays to highlight striking differences in force variability, baseline force control, and reaction time consistency. Similar trends are evident for girls as well as shown in Figure 3 which contrasts the isometric ramp-andhold force trials as produced by a 9 year-old and a 12 year-old child. The force heat maps also reveal greater variability in achieving the four discrete level target force productions for the three muscle systems. An analysis of the pooled results (N=29 children) is shown in Figure 4 to contrast target force accuracy (thick line at each force is the median) and variability (shaded regions correspond to the median of the standard deviation) of composite trials for each of the three muscle systems among younger and older child groups (left and right plot columns).Overall, the older children (10.0-12.3 years of age) manifest improved accuracy in force control with reduced variability compared to their younger cohort. Descriptive summary statistics are shown in Table 1 by dependent variable.
Estimated marginal means for force reaction time ranged from 535 to 760 milliseconds across all conditions and factors (Table 2a). The force reaction time (RT) variable showed significant main effects for age group (p < 0.01), force target (p < 0.01), and muscle group (p < 0.0001). Estimated marginal means for combined digits was 564.6 ms compared to 679.3 ms for the lower lip across the four target levels. The lower lip manifested significantly longer RTs (by 50 to 70 ms) compared to the right and left hand digits during pinch force recruitment. Sex was not significant (p = 0.712). The dF/ dtmax force variable, a measure of active force recruitment, showed significant main effects as a function of target force (p < 0.0001) and age group (p < 0.05) (Table 2a). The estimated marginal means of the force derivative ranged from 10.39 to 31.10 N/sec. The estimated marginal means for dF/dtmax increased as a function of target force (0.25N target = -16.63N/s, 0.5N target = -15.44N/s, 1.0N target = -11.79N/s, and 2.0N target = 0.0N/s (reference)), respectively. The factors muscle group (p = 0.1174) and sex (p = 0.4923) were not significant. Among the neurotypical children in the present cohort, the tendency was to overshoot the visuomotor target during the ‘rapid-and-accurate’ force recruitment task. The magnitude of force overshoot (percent increase re: target force), was greatest at the 0.25N target where estimated marginal means for the right index-thumb, left index-thumb, and lower lip were 0.53N, 0.46N, and 0.68N greater than the target force, respectively.
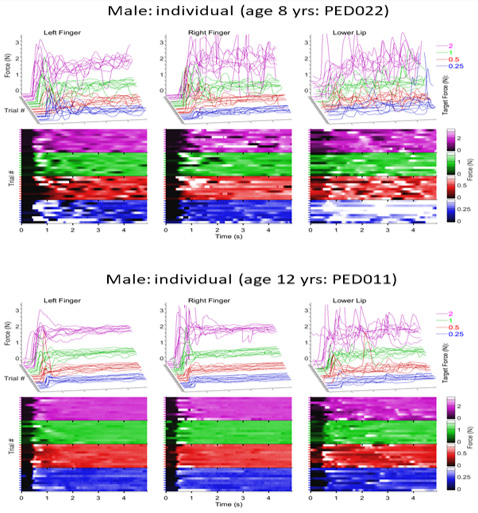
Figure 2: Upper panel (row 1) shows individual ramp-and–hold force trials sampled from an 8-year-old male at 0.25 [blue], 0.5 [red], 1.0 [green], and 2.0 N [magenta] target force levels in waterfall display format for the left finger, right finger, and lower lip. Upper panel (row 2) shows the distribution of individual force trials including onsets as a function of structure and target as a heat map (absolute force amplitude is coded by a color heat scale). Bottom panel shows similar individual isometric waveforms and heat map sampled from a 12-year-old male.
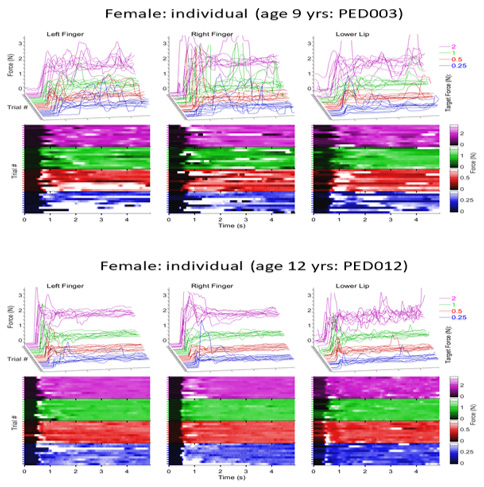
Figure 3: Upper panel (row 1) shows individual ramp-and–hold force trials sampled from an 9- year-old female at 0.25 [blue], 0.5 [red], 1.0 [green], and 2.0 N [magenta] target force levels in waterfall display format for the left finger, right finger, and lower lip. Upper panel (row 2) shows the distribution of individual force trials including onsets as a function of structure and target as a heat map (absolute force amplitude is coded by a color heat scale). Bottom panel shows similar individual isometric waveforms and heat map sampled from a 12-year-old female.
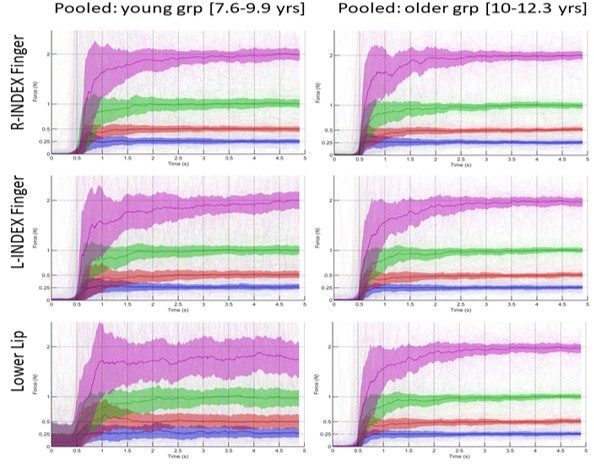
Figure 4: Pooled right thumb-index finger (row 1), left thumb-index finger (row 2), and lower lip compression (row 3) trials at 0.25 [blue], 0.5 [red], 1.0 [green], and 2.0 N [magenta] target force levels among boys and girls [age 7.6-9.9 years [N=16], and age 10.0-12.3 years [N=13]. The thick colored line at each target force level represents the median, and shaded regions correspond to median standard deviation for composite force trials.
A clear finger advantage was found at the 0.25N target level with peak forces ranging from 186.9% to 214.5% of the intended target, whereas the lower lip peak force was 274.6% of target. The degree of overshoot (expressed as a percentage of the target) decreased with increasing target force levels such that the marginal means resulted in peak forces for the right and left digits that were 37.8% and 38.9% greater than the intended 2N target, whereas peak force for the lower lip exceeded the 2N target by 45%. In absolute terms, the fingers showed the clear advantage with 0.46N to 0.53N of overshoot at 0.25N target, whereas the lower lip yielded the greatest error at 0.69N of overshoot at this target. Peak isometric force overshoot increased at each higher target force, culminating in the largest absolute force errors approaching 0.78N for the digits, and 0.90N for the lower lip at the 2N target force. For the LMM, the peak force dependent variable showed significant main effect as a function of muscle group (p = 0.001) and target force (p < 0.0001) (Table 2a). Age group was marginally significant (p = 0.0539). Sex was not significant (p = 0.617). Mean force during the T1 and T2 hold-phase periods showed a high degree of end-point accuracy in isometric force output, favoring the digits over the lower lip (Table 2a). The LMM revealed a significant interaction for force target by muscle group (T1 phase, p = 0.0013; T2 phase, p < 0.0001). Sex and age were not significant.
Isometric contraction stability, calculated as the standard deviation (SD) during the same T1 and T2 hold-phase periods showed a significant main effect as a linear function of the child’s age (SD T1, p < 0.01; SD T2, p <0.001). Sex was not significant (SD T1, p = 0.751; SD T2, p = 0.428). LMM for the SD of isometric force revealed a significant interaction between force target and muscle group during the T1 and T2 hold phases after controlling for child’s age and sex (T1 phase, F(6,3440) = 5.21, p < 0.0001; T2 phase, F(6,3440) = 5.92, p < 0.0001). Estimated marginal means for SD showed a significant advantage for the digits at each target force level compared to the lower lip (Table 2b). For example, the composite SD in isometric force output during the T1 period was 0.1233N for the right thumb-index finger, 0.1497N for the left thumb-index finger, and nearly double indicative of greater instability for the lower lip at 0.2659N. A similar pattern for SD in isometric force was found during the T2 period (SD=0.0995N for the right thumbindex finger; 0.1526N for the left thumb-index finger, and 0.2523N for the lower lip). Post-hoc pairwise comparisons confirmed this trend with lower lip isometric compression force SD significantly greater than the same measure for either the right- or left thumbindex finger pinch contractions at each of the four target forces (p < 0.0001, effects size (d) ranging from 0.205 to 0.611). The additional 1.4 seconds of afforded by the T2 period resulted in more stable isometric force output, especially for the dominant right handdigits and lower lip, with marginal means for SD reduced by 16.99 to 26.99% RF, and 1.25 to 12.72% for LL across the force targets 2N, 1N, 0.5N, and 0.25N, respectively.
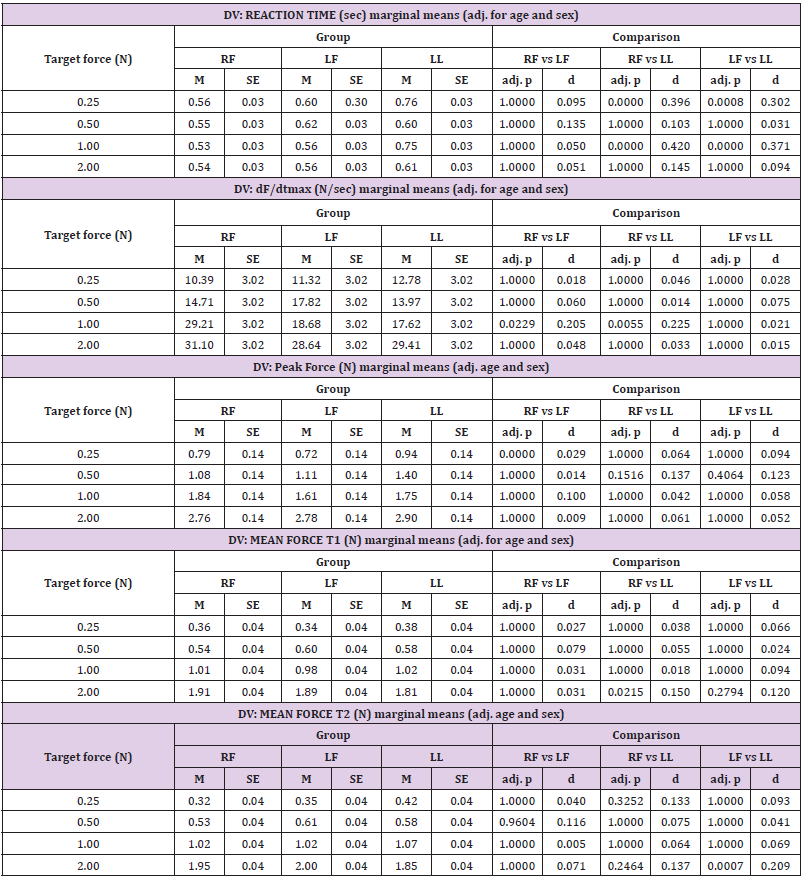
Table 2a. Linear mixed modeling (LMM) by dependent variables.
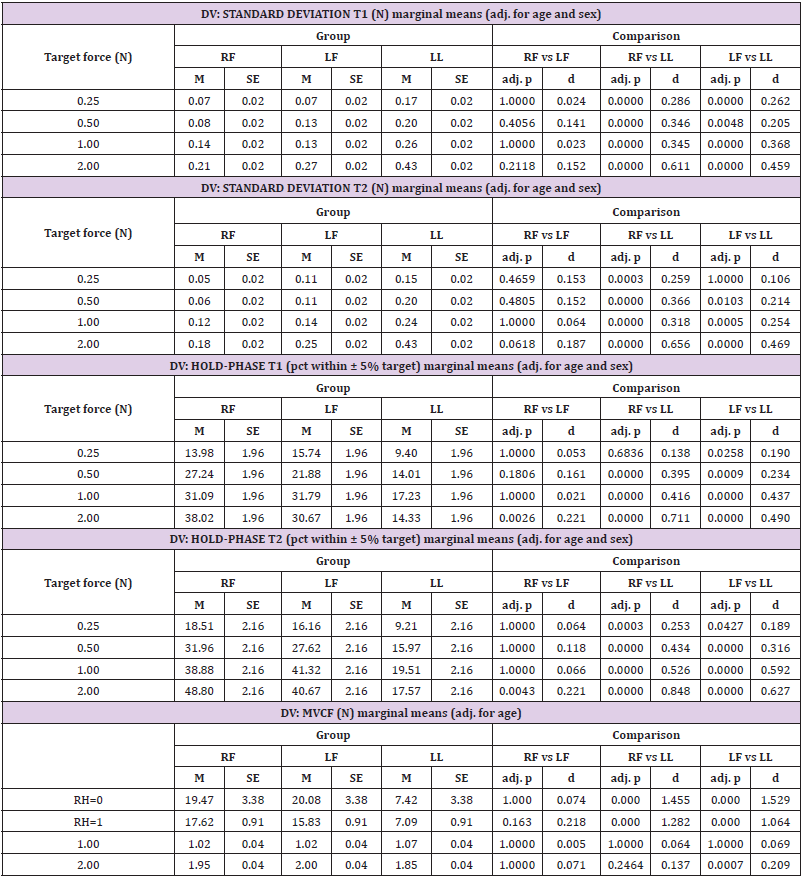
Table 2b. Linear mixed modeling (LMM) by dependent variables.
The hold-phase criterion percentage achieved during both the T1 and T2 hold phase periods showed a linear significant main effect age (p = 0.004, and p = 0.0011, respectively). Sex was not a significant factor during T1 and T2 (p = 0.93, and p=0.97, respectively). Overall, the thumb-index fingers of either hand are significantly better at maintaining a target force criterion (within ±5% of target) compared to the lower lip. LMM for the criterion percentage of isometric force at target revealed a significant interaction between force target and muscle group during the T1 and T2 hold phases after controlling for child’s age and sex (T1 phase, F(6,3440) = 11.00, p < 0.0001; T2 phase, F(6,3440) = 13.29, p < 0.0001). Overall, the digits of the hand performed at approximately twice the efficiency of the lower lip in generating isometric force within the ±5% criterion at each of the four target levels. For example, the marginal means for criterion performance (within ±5% of target window) during the T1 phase were 13.98 and 15.74% for the right and left thumb-index finger digits at 0.25N target, whereas only 9.4% of the digitized lower lip isometric force record fell within the prescribed criterion target (Table 2b).
A similar pattern was found at the other target forces for the right- and left-hand, and lower lip (FT=0.5N: 27.24, 21.88, 14.10%; FT=1N: 31.09, 31.79, 17.23%; and FT=2N: 38.02, 30.67, and 14.33%, respectively). As isometric contractions advanced into the T2 phase, criterion performance improved even more favoring the digits of the right- and left hand compared to the lower lip (FT=0.25N: 18.51, 16.16, 9.21%; FT=0.5N: 31.96, 27.62, 15.97%; FT=1N: 38.88, 41.32, 19.51%; and FT=2N: 48.80, 40.67, 17.57%, respectively). Overall, criterion ‘on-target’ performance increased by 22.86% from the T1 to T2 hold phase. Post-hoc pairwise comparisons confirmed this trend with superior criterion level ‘ontarget’ performance exhibited by the thumb-index fingers of the hand compared to the lower lip at each force target (p < 0.0001, effects size (d) ranging from 0.316 to 0.848 among force targets 2N, 1N, and 0.5N; and p < 0.05, d = 0.189 to 0.253 at the 0.25N target force). The maximum voluntary compression force (MVCF) variable showed a significant main effect as a function of muscle group (p < 0.0001). Age (p = 0.18), sex (p = 0.09), and handedness (p = 0.50) were not significant factors. As shown in Table 2b, MVCF marginal means were approximately 2.26 to 2.66 times greater for the thumb-index pinch (15.83 to 20.08 N) compared to lower lip compression (7.09 to 7.42N) (p<0.0001, d = 1.064 to 1.529).
Discussion
Thumb-Index Finger Pinch Versus Lower Lip Compression
One of the themes that emerged from the project was the performance advantage of the fingers over the lower lip in terms of hold-phase variability and force recruitment. Overall, the lower lip showed greater hold-phase variability and a shallower slope for force recruitment to the initial peak. The lower lip showed slower reaction times and a lower MVCF when compared with the fingers. Gentil, et al. [11] studied fine force generation in the fingers and lips of adults, and found that the fingers demonstrated a higher degree of precision, hold-phase stability, and force control accuracy when compared with the lips Gentil, et al. [11].
Age Differences
Another of the emergent trends throughout the research was the different performance capabilities of the two age groups. Overall, the younger children manifest much more variance in their force trials, inconsistency in peaks during force recruitment, hold-phase isometric contraction stability, and a lesser degree of end-point accuracy at each target force level when compared with the older cohort. The older children also showed higher force recruitment rates to the initial peak and shorter reaction times than the younger children. This trend was consistent across muscle groups measured. Ager, et al. [12] found age to be a significant factor in pinch strength of children between ages 5 and 12 years, with strength (MVCF) increasing with age. Similarly, Mathiowetz, et al. [13] found that maximum pinch force increases with age in children between 6 and 19 years of age [14]. For the lower lip, Chigira, et al. [12] found that in typically developing young children, lip pressure increases between 5 months and 5 years of age. They also found that the coefficient of variation for lip pressure decreased with increasing age, supporting this study’s findings of less variance and greater force stability in older children. Limitations of this study include a relatively small sample size (N=29) divided across two age groups, a greater number of female participants (16F/13M), and a greater number of younger children (16 young/13 older). The scope of the study can be expanded to include younger children and teenagers to complement existing data Barlow, et al. [3] sampled using the same ForceWIN10 system to create a developmental profile of active force dynamics over the human lifespan. Further research applications will extend into participants with neuromotor disease and/or brain injury resulting in movement disorders of the hand and/or face Barlow, et al. [4]. The real-time visuomotor tracking features of ForceWIN, also offer many possibilities for motor rehabilitation applications in patients recovering from cerebrovascular stroke and other insults to the brain that affect fine motor control.
Conclusion
This study investigated the orofacial and hand force dynamics of neurotypical children using wireless force transducers and realtime data analytics for the thumb-index finger pinch and the lower lip compression forces. This study found multiple significant effects related to muscle group and age. Overall, the lower lip showed a higher degree of hold-phase variability, slower reaction time, greater standard deviation, and lower MVCF when compared with the fingers. For age, the younger children had greater inconsistency in peak force and hold-phase contractile stability, as well as poorer end-point accuracy when compared to the older children. The ForceWIN10 system, featuring wireless sensing technology and advanced data analytics, has been used to test neurotypical adults Barlow, et al. [3], and survivors of cerebrovascular ischemic MCA strokes Barlow, et al. [4]. The present study is the first to demonstrate the feasibility of ForceWIN10 in a pediatric population to advance our understanding of active force dynamics and development in the lower face and thumb-index finger of each hand.
Conflict of Interest
Authors SMB and JG are the co-inventors of the ForceWIN10 system and were awarded a US Patent No. 11,202,595 on December 21, 2021.
Acknowledgement
This study was supported by the UCARE Program (University of Nebraska-Lincoln), and the Barkley Trust Foundation (Barlow). Special gratitude to Anna Jean Scarborough, Kaytlin Tippin, and Brianna Wardyn for technical assistance, and the research participants and their families who consented for this study.
References
- Barlow SM, Abbs JH (1983) Force transducers for the evaluation of labial, lingual, and mandibular motor impairments. Journal of Speech, Language, and Hearing Research 26(4): 616-621.
- Kumar A, Tanaka Y, Grigoriadis A, Grigoriadis J, Trulsson M, et al. (2017) Training-induced dynamics of accuracy and precision in human motor control. Scientific reports 7(1): 6784.
- Barlow SM, Hozan M, Lee J, Greenwood J, Custead R, et al. (2018) Orofacial and thumb-index finger ramp-and-hold isometric force dynamics in young neurotypical adults. Journal of Biomechanics 72: 81-89.
- Barlow SM, Custead R, Lee J, Hozan M, Greenwood J (2020) Wireless Sensing of Lower Lip and Thumb-index Finger ‘Ramp-and-Hold’ Isometric Force Dynamics in a Small Cohort of Unilateral MCA Stroke: Discussion of Preliminary Findings. Sensors 20(4): 1221.
- Barlow SM, Abbs JH (1986) Fine force and position control of select orofacial structures in the upper motor neuron syndrome. Experimental Neurology 94(3): 699-713.
- McHenry MA, Minton JT, Hartley LL, Calhoun K, Barlow SS (1999) Age‐related changes in orofacial force generation in women. The Laryngoscope 109(5): 827-830.
- Etter NM, Mckeon PO, Dressler EV, Andreatta RD (2017) Effects of ageing on orofacial fine force control and its relationship with parallel change in sensory perception. International journal of speech-language pathology 20(5): 1-14.
- Greenwood J, Hozan M, Barlow SM (2019) Wireless isometric force sensor platform for bedside automated evaluation and therapeutics of orofacial and hand muscle systems across the lifespan. Biomedical Journal Scientific & Technical Research 21(3): 15824-15829.
- Barlow SM, Burton MK (1990) Ramp-and-hold force control in the upper and lower lips: Developing new neuromotor assessment applications in traumatically brain injured adults. Journal of Speech, Language, and Hearing Research 33(4): 660-675.
- (2002-2012) SAS Institute. SAS/STAT 9.4 user’s guide. Cary, NC: SAS Institute Inc.
- Gentil M, Tournier CL (1998) Differences in fine control of forces generated by the tongue, lips and fingers in humans. Archives of Oral Biology 43(7): 517-523.
- Chigira A, Omoto K, Mukai Y, Kaneko Y (1994) Lip closing pressure in disabled children: a comparison with normal children. Dysphagia 9(3): 193-198.
- Mathiowetz V, Wiemer DM, Federman SM (1986) Grip and pinch strength: norms for 6-to 19-year-olds. American Journal of Occupational Therapy 40(10): 705-711.
- Ager CL, Olivett BL, Johnson CL (1984) Grasp and pinch strength in children 5 to 12 years old. American Journal of Occupational Therapy 38(2): 107-113.
