 Research Article
 Abstract
The role of weathering in carbon sequestration has not got attention enough. This study is assessing regional factors: annual temperature (Temp), groundwater (gw) Si, agricultural total (tot) and soil-type pH´s and soil-type proportions (Prp) of moraine (mor), sand, silt, clay and mull soils in order to clarify whether weathering could be associated with pH variation in different soil-types. [mor + sand soils are labeled as coarse mineral soils (coms), respectively coms + silt + clays as mineral soils (miner). 1 – Prp.miner = Prp organic (org). Moraines, sands and clays include several subclasses].
Materials and Methods: Regional soil pHs, soil-type Prps, Si.gw and Temp are from old sources. N of regions in statistical survey was 15 (after combining 2 and excluding 4 of them – Åland + 3 continental regions - because of carbonate soil prominence or statistical inadequacy). N of soil-samples was ca 570,000 and gw samples 596.
Results: Regional pH´s ranged from 5.35 to 6.20 in different soil-types. Temp associated significantly positively with pH´s, Si.gw and Prp.miner. Si.gw-pH associations [(Pearson/ Spearman): pH.mor (0.42 / 0.37) + , pH. sands and silts [( 0.53, 0.52) / ( 0.58, 0.55)] ++ ++ , pH.clays [( 0.74 / 0.77)] + + seemed to increase from coarse towards finer mineral soils. Represented soil-type pH´s associated significantly with pH.tot.
Conclusion: Regional pH.mor, pH.sands, pH.silt and pH.clays associated significantly with pH.tot and Temp, as well as obviously with soil weathering status. pH associations with Si.gw seemed to increase towards finer mineral soils. This phenomenon is possibly related to carbon silicate cycle.
Keywords: pH; Groundwater; Agriculture; Silicon; Temperature; Geography; Soil-Type
Abbreviations: Clay: Clays (Several Subtypes); Coms: Coarse Mineral Soils (incl. mor + sand soils); Gw – Groundwater; Incl: Including; Miner: Mineral Soils (incl. coms + silt + clays); Mor: Moraines (Several Subtypes); Mull: A Single, Main, Organic Soil-Type; Prp: Proportion; RC: Rural Center (earlier Agricultural Advisory Center); Sand: Sands (Several Subtypes), Silt: Silt (No Subtypes), Si: Silicon; Soil: Agricultural Soils
Introduction
Dissolved silica (SiO2 ) is known as a product carbonate silicate cycle [CaSiO3 + 2CO2 + H2O ↔ Ca + 2HCO3 - + SiO2(dissolved silica)] [1]. Weathering is associated with temperature (Temp) [2], soiltype [3] and soil ageing [3,4]. Silicate slags [5] and granite powder [6] can be used for pH elevation of acid soils. Inter-regional relative pH stability during three decades (1961 – 1990) and pH asso ciation with Temp and Si.gw is suggesting on pH association with soil weathering [7]. Association of pH.tot with Si.gw is interestingly mirror-like when the regions were arranged by Temp [8]. Inter-relations between soil-type pH´s, Temp and Si.gw after [7,8] need somewhat clarification. The aim of this survey is to clarify whether regional Temp, Si.gw and soil-type pH variations could support the role of weathering in soil pH regulation.
Materials and Methods
Available data concerning regional Temp, Si, pH and soil-type proportions are first collected per 21 Rural Centers (RC, earlier Agricultural Advisory Centers). Regional Si.gw values, means, median and N of samples, are from Groundwater database © Geological Survey of Finland 2017 [9]. pH values and soil-type proportions of cultivated fields per RC´s, concerning period 1986-90 are provided by Eurofins Viljavuuspalvelu Oy [10]. Average annual temperatures of RCs from 1981-2010 are visually approximated by combining map of Finnish Meteorological Institute [11] and map of RC´s [12]. Regional values for “VarsinaisSuomi” are got by weighting RC values of “(03). Varsinais-Suomen” and “(4b). FinskaHushållningss.” by their arable land areas [13] and respectively values for “Uusimaa” by weighting RC values of “(01). Uudenmaan” and “(02).Nylands Svenska” by their arable land areas. After this RC values were given for respective Regions [14]. Åland has been excluded because its pH is in the “carbonate buffer” range, where the soil pH regulation (and Si availability) seems not to be associated with Si.gw [15].
Lapland has been excluded because of missing clay soil samples, Kainuu with only one clay soil sample. Si.mean/Si.median ratio in gw of Ostrobothnia was 1.62 (i.e. ca mean + 4*SD – can be calculated by data in Table1). This is a sign of statistical inadequacy, why Ostrobothnia has been excluded from calculations. Northern Karelia, with two and Central Finland with three clay soil samples included to this study. The boundaries, names and numbers of RCs and Regions deviate slightly from each other [14]. Number of included soil samples was 565,558 and gw samples 596. Numerical data from included and excluded regions are in Table 1, where excluded data are over-lined.
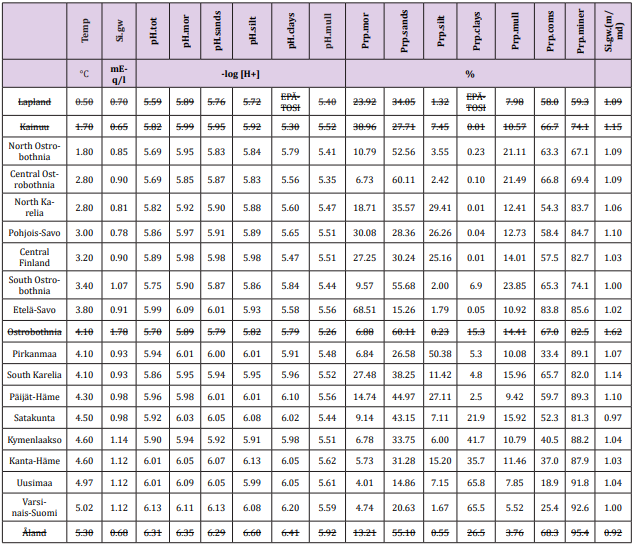
Table 1: Regional annual temperature, groundwater Si, agricultural soil pH and proportion of moraine,sand, silt clay and mull soiltypes, as well as average pH (pH.tot), their means, standard deviations (SD), coefficients of variation (SD/mean). Additionally are given data on mean/median ratio of Si.gw [Si.gw.(m/md)]. Regions are arranged by increasing temperature.
Results
Soil-type proportions (Prp, %): Prp.miner 83 ( / 8) + − , Prp. coms 52 ( / 18) + − , Prp.sands 35 ( / 14) + − , Prp.mor 17 ( / 17) + − , Prp.clays 17 ( / 24) + − , Prp.silt 14 ( / 14) + − , Prp.mull 14 ( / 5) + − . Prp variation (SD/mean, %) when coms and miner excluded was lowest in sands and mull (39 %) and highest in clays (143 %).
Associations with pH.tot
Pearson and Spearman correlations of pH.tot with pH´s of other soil-types were significantly positive (Tables 2-4).
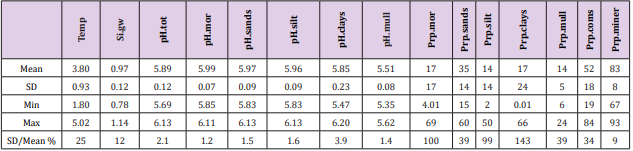
Table 2: Mean, SD, minimum, maximum and coefficient of variation (SD/mean, %) of parameters from included regions (Table 1).
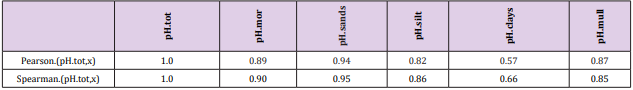
Table 3: Pearson and Spearman associations of pH.tot with other pH´s.
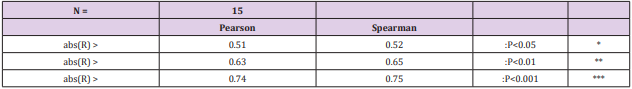
Table 4: Significances of simple correlations (variable pairs).
Associations with Temp
Table 5 and Figure 1
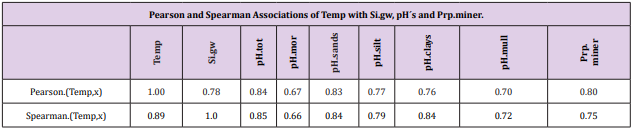
Table 5: Temp associated significantly (Table 4) positively with all the given parameters. Temp “explained” 64 % (0.8*0.8*100) of Prp. miner variation.
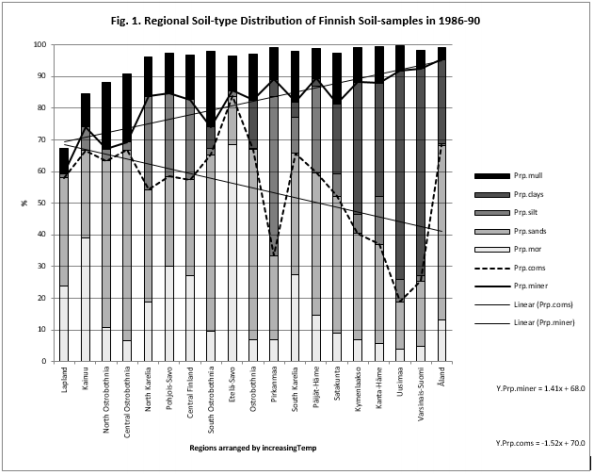
Figure 1: Shows that Prp.miner trend-line associated positively, Prp.org and Prp.coms negatively with Temp (All regions included). (Prp.org soil-types above line Prp.miner).
Associations with Si.gw
Table 6 and Figure 2
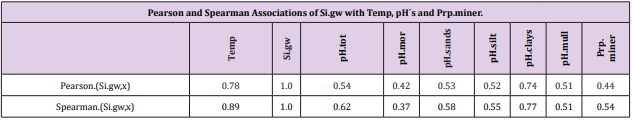
Table 6: All Si.gw associations were positive with Temp, pH´s and Prp.miner (Tabl. 5). pH association strength increased from coarse to finer mineral soil-types (Pearson/Spearman): pH.mor (0.42/0.37) < [pH.sands, pH.silt (0.53, 0.52)/(0.58, 0.55)] < pH.clays (0.74/0.77). Associations were weaker than respective associations with Temp, most associations were anyhow significant (Table 4).
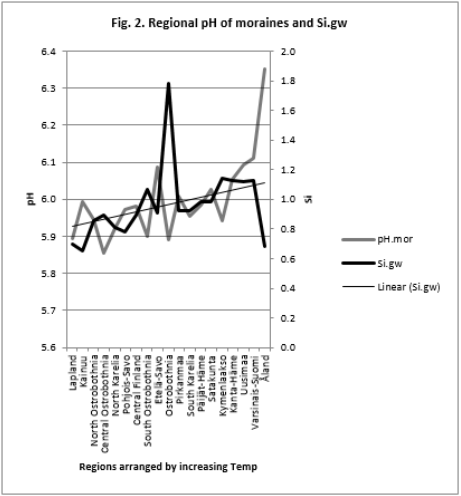
Figure 2:
Temp, Si.gw and pH´s when Regions Arranged by Increasing pH.mor
Table 7 and Figure 3-6
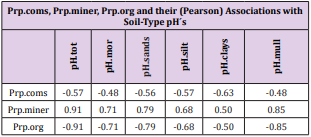
Table 7: pH associations were positive with Prp. miner and negative with Prp.coms and Prp.org. pH associations with pH.miner and pH.org were significant or nearly significant. pH.mull associated more strongly negatively with Prp.org than pH of mineral soils. Spearman associations of pH.clays with soiltype Prp´s of coms, miner and org) were significant.
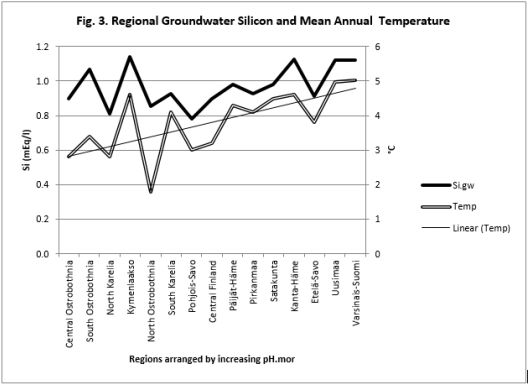
Figure 3: Regional Si.gw and Temp are positively associated with each other and their curves form similar fluctuations when regions are arranged by increasing pH.mor.
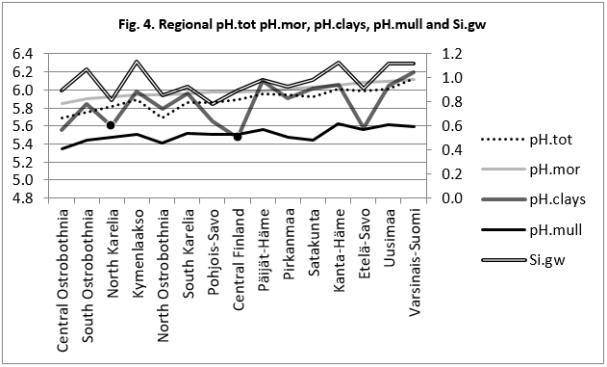
Figure 4: Regional pH.tot, pH.clays, pH.mull and Si.gw are positively associated with pH.mor and their curves form similar fluctuations when regions are arranged by increasing pH.mor (cf. pH.mor in Figure 2).
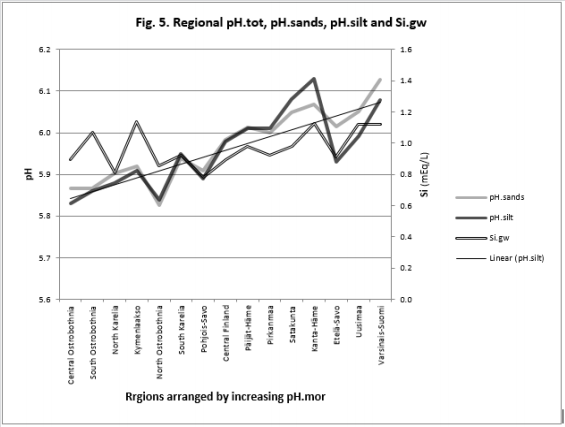
Figure 5: Regional pH.sands, pH.silt and Si.gw are positively associated with each other and their curves form similar fluctuations when regions are arranged by increasing pH.mor.
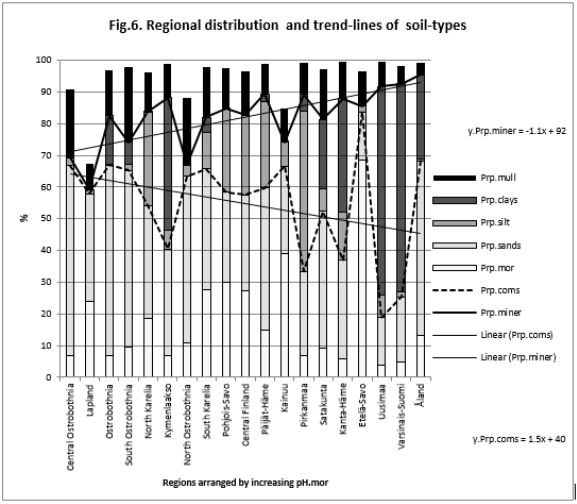
Figure 6: shows that Prp.miner (trend-line) was positively and Prp.coms negatively associated with pH.mor (All regions included).
Discussion
Because the main aim of this article was to assess pH variation inside mor, sand, silt, clay and mull soil-types, (Figures 1 & 6) are without proportions of peat, gyttja and mud soil-types. Practically the part between 100 and Prp. mull colums is peat (Figures 1 & 6). pH´s of mineral soils were 0.34 – 0.49 units higher than pH.mull (Table 2) (N.B. pH.peat was lower than that pH.mull, why the difference between pH.org and pH of mineral soil-types is higher). All analyzed soil-type pH´s associated significantly with pH.tot. (Table 3), pH.clays with lowest association. Remarkable is that pH.tot is not a golden standard, because it is a sample weighted pH mean of different soil-types, in which proportion of mineral soil-types increased (and acid organic soil-types decreased) with increasing Temp (Figure 1).
Temp and pH: Temp associated significantly positively with pH´s, Si.gw and Prp.miner (Figure 1) and (Table 5). Si.gw association can be explained by weathering rate, which is associated with temperature [2]. Additionally Prp.miner and Prp.org are as such indicators of soil ageing, humus and peat formation [4] and pH decrease [16] is known to be associated with reduction of alkaline substrates, e.g. CaSiO3 [1] or CaCO3 [4]. (Latitude and longitude of RC´s explained 99 % of Temp variation [14]. Temp is a strong geographic factor).
pH-Si.gw Association Strength Seemed to Increase from Coarse Towards Finer Mineral Soil-Types (Pearson/Spearman): pH.mo (0.42 / 0.37) < [pH .sands, pH. silt, (0.53, 0.52)/ (0.58, 0.55)] < pH .clays (0.74 / 0.77). Associations with pH.mull were borderline significant (p < 0.06) and with pH.mor non-significant (Table 6). pH.mor was most “resistant” to Si.gw variation, next sensitive were pH.mull, pH.silt and pH.sands, most sensitive was pH.clays (Figures 3-5). Because of scanty number of clay soil samples and possible several sampling error in conclusion selected interpretation: “association with Si.gw seemed to increase towards finer mineral soils”. Soil-type pH’s (e.g. pH.mor, (Figure 2)) deviate mirror-like from trend-line with Si.gw when the regions were arranged by Temp (similarly as pH.tot in [8]). In Fig. 3 Temp-Si.gw association can obviously be understood by old and new processes in the soil. Low Si.gw in carbonate soil areas in Åland(pH > 6.2) has been explained by “carbonate buffer range” [limits of silicateand carbonate buffer (pH 6.2 – 8.0) range[15]].
Mengel and Kirkby [16] have determined the limits of buffer ranges somewhat differently and wrote even about diurnal variation of pH. Silicate buffer cannot be explained by pK1 or pK2 of monosilicic acid (9,51 - 11,74) [17]. In pH range below 6.2 we cannot speak about silicate buffer solution, but “silicate buffer mixture” containing water and particles or surfaces, which can disintegrate [18], liberate e.g. Ca as [1], uptake 2 H+, release SiO2 and so increasing pH [5,6]. Dissolved silica SiO2 or Si(OH)4 [19] can condense and form dimers and oligomers [20]. Oligomers of Si(OH)4 can have buffering abilities around pH 6.8 [20] (possibly in micro-milieu, too). pKa1 for carbonic acid (H2 CO3 ) including CO2 (aq) is 6.3, so macroscopic pH regulation above 6.3 could be mainly regulated by carbonic acid [21]. Regional pH´s in different soil-types were associated with different measures of soil juvenility (e.g. Prp.miner - an inverse measure of humus formation [4]) and pH as such [4], as well as with regional Temp. The carbonate silicate cycle [1] could be benefited for fertilizing and liming of agricultural soils by juvenile silicates [3,5,6,22], like the mother earth has benefited during her long life.
Conclusion
Regional pH.mor, pH.sands, pH.silt and pH.clays associated significantly with pH.tot and Temp, as well as obviously with soil weathering status. pH associations with Si.gw seemed to increase towards finer mineral soils. This phenomenon is possibly related with carbon silicate cycle.
Acknowledgement
I am grateful to Professor Osmo Hänninen and late veterinary surgeon Seppo Haaranen for discussions and co-working during several years on these kinds of questions.
References
- Carbonate–silicate cycle.
- Johansson M, Tarvainen T (1997) Estimation of weathering rates for critical load calculations in Finland. Environmental Geology 29(3-4): 158-164.
- Ma JF, Takahashi E (2002) Soil, Fertilizer, and Plant Silicon Research in Japan. Survey on Si fertility. In Ma JF, Takahashi E (Eds.), pp. 182.
- Jones A (2014) Soil Atlas of Europe, European Soil Bureau Network, European Commission, 2005. Soil formation: 14 and 15.
- White B , Tubana BS , Babu T , Mascagni H , Agostinho F, et al. (2017) Effect of Silicate Slag Application on Wheat Grown Under Two Nitrogen Rates. Plants (Basel) 6(4): E 47.
- Silva MTB, Silva HB, García Rodeja E, Vázquez Freire N (2005) Reutilization of granite powder as an amendment and fertilizer for acid soils. Chemosphere 61(7): 993-1002.
- Töysä T, Hänninen O (2017) Soil pH, Ca and Mg Stability and pH Association with Temperature and Groundwater Silicon. Biomedical Journal and Scientific and Technical Research.
- Töysä T (2018) Regional pH change in groundwater between field and laboratory analyses, temperature, groundwater silicon, agricultural soil pH, soil-type distribution in Finland. Biomed J Sci & Tech Res 12(3): 20
- Lahermo P, Tarvainen T, Hatakka T, Backman B, Juntunen R, et al. (2002) Tuhatkaivoa - Suomenkaivovesienfysikaalis-kemiallinenlaatuvuonna 1999. Summary: One thousand wells - the physical-chemical quality of Finnish well waters in 1999. Geological Survey of Finland, Report of Investigation 155, and Groundwater database of Geological Survey of Finland 2017.
- (2015) Acidity and mineral element contents per soil-type in Finnish Rural Centres 1986-90. Permission.
- Temperature: Average annual temperature 1981-2010.
- (1988) Official Statistics of Finland: Farm Register. Agriculture and forestry 1990:2 Helsinki: National Board of Agriculture. Copyrights by Maanmittauslaitos (MML), pp. 16.
- Toysa T, Hanninen O (2016) Soil weathering, silicon and CHD in Finland. J J Agriculture 2(1): 008.
- Töysä T (2018) Regional associations of CHD and musculoskeletal morbidity with environmental and geographic factors – e.g. Ca, Mg, Si, Sn. Biomed J Sci& Tech Res.
- Kauppi P, Kämäri J, Posch M, Kauppi L (1986) Acidification of forest soils: Model development and application for analyzing impacts of acidic deposition in Europe. Ecological Modelling Terrestrial Ecosystems. International Institute for Applied Systems Analysis, A-2361 Laxenburg Austria 33(2-4): 231-254.
- Mengel K, Kirkby EA (2001) Principles of Plant Nutrition. In Mengel K, Kirkby EA (Eds.) (5th denticola.) Kluwer Academic Publishers, Dordrect, The Netherlands, pp 51-54.
- Kieselsäure
- Boyle JR, Voigt GK, Sawhney BL (1974) Chemical weathering of biotite by organic acids. Soil Science 117(1): 42-45.
- Orthosilicic acid.
- Belton DJ, Deschaume O, Perry CC (2012) An overview of the fundamentals of the chemistry of silica with relevance to biosilicification and technological advances. FEBS J 279(10): 1710-1720.
- Carbonic acid.
- Bernard R (1894) Introduction to Bread Prom Stones. From Bread From Stones: A New and Rational System of Land Fertilization and Physical Regeneration by Dr. Julius Hensel (Agricultural Chemist). Translated from the German.
