 Research Article
Abstract
Background: Artemether and lumefantrine are antimalarial drugs used as first line treatment of malaria. The pharmacokinetics of artemether and lumefantrine suggested the fixed dose combination can be used worldwide for the treatment of malarial infections. In the present study an analytical method has been developed, validated to determine artemether and lumefantrine simultaneously on HPLC to perform more reliable, cost effective analysis.
Method: Artemether and lumefantrine was dissolved in 0.1N methanolic HCl and studied for its UV absorption on HPLC. Analytical method validation parameters including linearity, accuracy, and precision, limit of detection and quantitation, and specificity were determined.
Results: The method was found linear in the concentration range of 50 to 150 %. Correlation coefficient (r2) value was found to be 0.9981 for artemether and 0.9968 for lumefantrine. The %RSD for accuracy and inter and intra-day precision was < 2.0%. The mean %age accuracy of three studied concentrations with three samples was 101.28 % ± 1.5. The limit of detection and quantitation was found to be 0.024 and 0.0714 mg/ml for lumefantrine and 0.055 and 0.079 mg/ml for artemether respectively.
Conclusion: The developed method was considered to be most appropriate to be used for the detection and quantification of artemether and lumefantrine.
Keywords: Malaria, Oral Dry Suspension, Artemether, Lumefantrine, HPLC
Abbreviations: HPLC: High Performance Liquid Chromatography; HCl: Hydrochloric acid; UV: Ultraviolet; WHO: World Health Organization; LUM: Lumefantrine; ART: Artemether; AL: Artemether, Lumefantrine; UV-VIS: Ultra violet, visible; FTIR: Fourier Transform Infrared Spectroscopy; LOD: Limit of Detection; LOQ: Limit of Quantitation; UNODC: United Nations Office on Drugs and Crime; FDA: Food and Drug Administration; USP: Unique Selling Proposition; RSD: Relative Standard Deviation.
Introduction
Malaria has been transmitted by female Anopheles mosquito
and considered to be the leading cause of morbidity and mortality
worldwide Guinovart, C et al. [1] Malaria has been endemic to
Pakistan and patients suffering from causing specie Plasmodium
vivax were more critical than the patients suffering from
Plasmodium falciparum Zubairi ABS et al. [2] It has been suggested by WHO that lumefantrine and artemether can be used as fixed
dose combination for first line treatment of malaria Suleman S et
al. [3] Lumefantrine and artemether are used individually for the
treatment of malarial infection separately for many years but recent
research has declared that this combination of AL is successful
combination for the prophylaxis of malaria. But now-a-days this
combination is increasingly being considered as challenging and
successful treatment for malaria Pawan K et al. [4] One drug of fixed
combination was able to provoke some of the adverse effects of
the second drug. Fixed dose combination simplified the treatment
regimen, prohibiting the failure of treatment as a result of missed
doses or by any other significant reason Epstein JE et al. [5]
Several methods have been suggested for the assay of ART and
LUM in combination dose therapy. Both are detected qualitatively
and quantitatively, individually and in combination with each
other by Gas Chromatogrphy, Differential pulse Polarogrphy, Thin
layer chromatography, HPLC, capillary electrophoresis, Iodometric
titration Da Costa César et al. [6-11] Stages in method development
surrounds information of sample, define the goals of separation,
pre- treatment of sample, HPLC procedures, detector selection and
the settings of the detector, selection of liquid chromatography
method, preliminary run, estimation of most suitable separation
conditions, optimization of separation conditions, checking for
issues or need for particular procedure and final approach for the
validation of the method Partap YP et al. [12] The aim of present
study was to develop and validate a simple and reliable method
for simultaneous estimation of Artemether and Lumefantrine in
oral dry suspension. Experiments were followed by the validation
of different parameters like wavelength selection, concurrent
detection and accuracy of the method. A different dry suspension
available in the market was also compared.
Materials and Method
Preparations of Reagents
Triflouroacetic Acid (0.1 %v/v): Triflouroacetic acid (0.1%) was prepared by mixing 0.2ml of triflouroacetic acid into 250ml volumetric flask already containing distilled water into it. Sufficient water was added to produce final volume upto 200ml with the same solvent.
Buffer (pH 2.5): The buffer was manufactured by mixing 5ml of triethylamine in 0.1 % of triflouroacetic acid, pH maintained up to 2.5 with phosphoric acid.
Mobile Phase: Mobile phase was manufactured by mixing buffer (pH 2.5) and methanol in the ratio of 1:4 respectively. The mobile phase was mixed, passed through 0.45um filter membrane to get rid of any foreign particles and degassed by sonication.
Reference Standard of Drugs
The reference standards artemether with batch number AM1/2014090) tested and approved against working standard with batch number WS/AM/01/2014 and lumefantrine with batch number LFI/20140501 tested and approved against WS/ LF/01/2014. The identification of the artemether and lumefantrine standard was also done by FTIR analysis (Annexure 1).
Chromatographic conditions of High-Pressure Liquid Chromatography
The analysis was carried out using high pressure liquid chromatography on reverse phase mode that consisted of LC- 10Avp Schimadzu pump combined with 10Avp UV-VIS detector. The column used was ODS Hypersil (250x4.6mm i.d; 5um particle size). The high-pressure liquid chromatography was controlled by computer system using class GC-10 software. The wavelength used for the detector was 210 nm with rate of flow 1.5 ml per min. Volume of injection was 20uL.
Optimization of Wavelength
Artemether (15mg) was dissolved in methanol and lumefantrine (90mg) was dissolved in 0.1N methanolic HCl individually and then both solution were mixed equally and tested for different wavelengths such as 216 nm, 210 nm, 260 nm, 302 nm (Table 1).
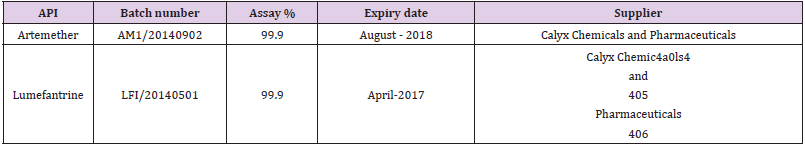
Table 1: Reference standards of drugs.
Selection of Diluents
Placebo was prepared by mixing excipients and active in defined quantities as mentioned in the Table 2. 60ml dry suspension sample was prepared by reconstituting prepared sample with 50ml of distilled water. 5ml of sample containing 15mg of artemether and 90mg of lumefantrine was withdrawn and subjected to dissolve in 100ml of methanol, 0.1N methanolic HCl, 10% glacial acetic acid in methanol, 1% phosphoric acid in methanol individually. The recovery of active ingredients was observed against the standard prepared by dissolving 15mg of artemether and 90mg of lumefantrine in the respective diluents.
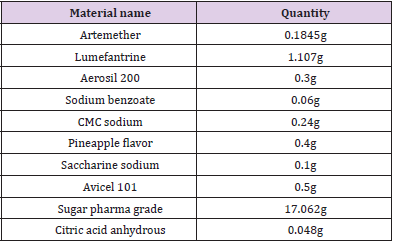
Table 2: Formulation of dry suspension of artemether and Lumefantrine.
Assay of Artemether and Lumefantrine (Dry Suspension)
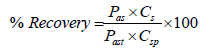
Assay of artemether and lumefantrine was done by injecting three injections of standard concentration prepared by dissolving 15mg of artemether and 90mg of lumefantrine in 0.1M methanolic HCl whereas on the other hand sample concentration was prepared according to the label claim i.e 5ml of suspension that is equivalent to 15mg of artemether and 90mg lumefantrine. Dry suspension was prepared and reconstituted to check the assay in the selected diluent. 5ml of reconstituted suspension was pipetted out from the bottle and added to the 100ml volumetric flask 75ml of diluent was added and sonicated for 5 min and stirred for 15min on magnetic stirrer. The obtained mixture was filtered prior to inject the sample. The peak area was obtained by the chromatograms and the percentage recovery of sample against standard was calculated according the formula
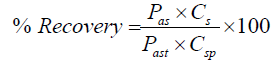
Whereas; Pas = peak area of sample
Cs = concentration of standard
Past = peak area of standard
Csp = concentration of sample
Method validation
Precision: Precision was carried out by preparing pure solution of Artemether and Lumefantrine by dissolving 15mg and 90mg respectively in 0.1M methanolic HCl. Six consecutive injections were injected and peak area for Artemether and Lumefantrine were obtained and calculated for statistical reasoning. Average, mean and Standard deviation were calculated. Retention time, area and height of the peak were recorded.
Accuracy: Accuracy was carried out at three different concentrations 100%, 75% and 50% against standard concentration prepared at 100% concentration. The percentage recovery obtained from the sample concentrations were compared and calculated against the standard concentration. Mean, standard deviation, relative standard deviation was evaluated and percent recovery for all samples was calculated according to the formula;
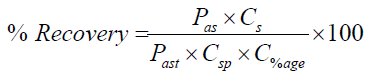
Whereas;
Pas = peak area of sample
Cs = concentration of standard
Past = peak area of standard
Csp = concentration of sample
C%age = Percenatge of interest i.e 50, 75, 100
Specificity: The specificity of the assay method was evaluated by injecting placebo excluding active ingredients to clarify the absence of hindrance with the elution of analyte. The excipient compounds should not hinder with the choice of analyte for analysis.
Linearity: Linearity was determined on five different concentration of standard such as 125, 75, 100, 150, and 50%. Stock solution was prepared by dissolving 30mg of artemether and 180mg of lumefantrine in 0.1N Methanolic HCl. Serial dilutions were prepared by stock solution and three replicates of each concentration were evaluated. The way of standard preparation and the no. of injections were alike as utilized for final method. Results were concluded. Average, SD, and RSD for every concentration were calculated. Graph was plotted concentration taken on (x-axis) versus mean response (y-axis) for each concentration. Equation of regression and coefficient of variance (r2) were calculated.
Limit of Detection: The least concentration of the standard solution was evaluated by sequentially diluting the sample. Minimum five and maximum 14 replicates were made from this sample solution. The lowest detectable concentration along with relative standard deviation was calculated.
Limit of Quantitation: Evaluating the least concentration at which the detection of analyte in the sample matrix can be done and its quantification, precision and accuracy can also be assured an analyte in the sample matrix can be detected and quantified with definite accuracy and precision required for the method. Minimum five and maximum 14 replicates were prepared from a single solution and the lowest quantified concentration along with the relative standard deviation was calculated and evaluated. Tables 3 & 4 show the dilution scheme of lumefantrine and artemether
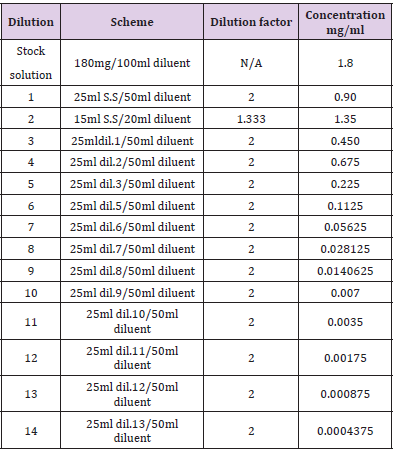
Table 3: Dilution scheme of lumefantrine for LOD & LOQ.
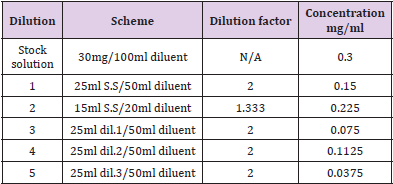
Table 4: Dilution scheme of Artemether for LOD & LOQ.
Assay Comparison of Different Suspension Available in the Market
The comparison was done on three different formulations purchased from local market to check the reproducibility of the method. Standard concentration was prepared by dissolving 15mg of artemether and 90mg of lumefantrine according to the label claim of the product. Three consecutive injections were injected average, mean and standard deviation was calculated. Two injections were injected of each sample prepared by using 5ml of suspension which was pipetted out from the reconstituted sample and added to the 100ml volumetric flask 75ml of diluent was added and sonicated for 5min and stirred for 15min on magnetic stirrer. The obtained mixture was filtered prior to use. The percentage recovery of sample against standard was calculated against standard
according the formula:
Results
Optimization of wavelength
Figure 1 shows the peak area of artemether at different wavelengths, Artemether gave maximum absorption at 210nm moderate absorption at 216nm and no peak was detected at 302nm whereas on the other hand Figure 2 shows the peak area of lumefantrine at different wavelengths giving maximum absorption at 302nm, moderate absorption at 210nm and 260nm and minimum absorption at 216nm. Figure 3 illustrates the peak spectrum of artemether and lumefantrine at 210nm.
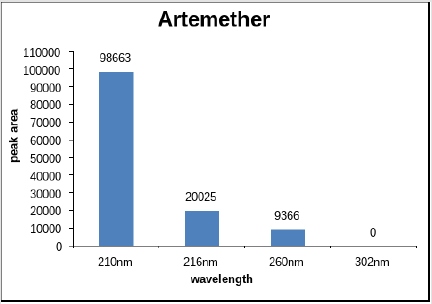
Figure 1: Peak area of artemether at different wavelengths.
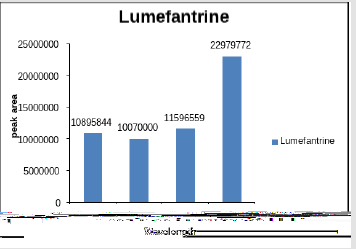
Figure 2: Peak area of lumefantrine at different wavelengths.

Figure 3: Peak spectrum of artemether and lumefantrine at 210nm.
Selection of Diluent
The percentage recovery of artemether and lumefantrine in methanol was 101.89% and 92.98% respectively, in 0.1N methanolic HCl 100.67% and 99.23% respectively, in 10% glacial acetic acid in methanol 85.71% and 74.66% respectively and in 1% phosphoric acid in methanol 86.96% and 83.68% respectively. Figure 4 shows the percentage assay of artemether and lumefantrine in different solvents. Table 5 shows the relative standard deviation of standard and sample of artemether and lumefantrine in different solvents.
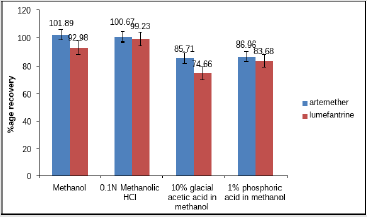
Figure 4: Assay of Artemether and lumefantrine in different solvents.
Note: All the values are means of three parallel replicates (n=3). Y-bar errors indicate the standard error of the me
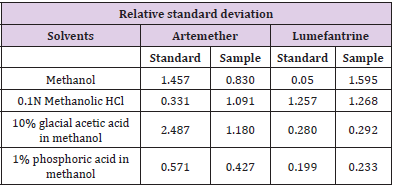
Table 5: Relative standard deviation of artemether and lumefantrine in different solvents.
Analysis of artemether and lumefantrine in dry suspension
Dry suspension of artemether and lumefantrine was prepared, reconstituted and sample equivalent to 15mg of artemether and 90mg of lumefantrine was withdrawn and treated.
Assay of Artemether and Lumefantrine in dry suspension: The retention time of standard peak area is 6.5 minutes for artemether and 12 minutes for lumefantrine which complies with the retention time of sample. The relative standard deviation of standard peak area is 1.456 and for sample peak area is 0.830 in case of artemether and is 0.612 and 1.595 respectively for lumefantrine, that is less than 2 complying with specified criteria. The weight of standard taken was 14.7mg whereas the label claim of the sample is 15mg per 5ml for artemether and for lumefantrine it was 95mg and 90mg per 5ml accordingly. The assay of artemether is 101.79% and for lumefantrine is 100.90% in dry suspension i.e within the specified limit given by USP along with the standard peak area of 37666.66 for artemether and 21639180.3 for lumefantrine and sample peak area of 38508.66 for artemether and 206865133 for lumefantrine. Figures 5 & 6 shows assay of artemether and lumefantrine in dry suspension sample. Figures 7 & 8 illustrates the peak area of standard and sample of both artemether and lumefantrine.
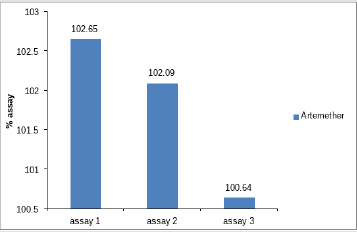
Figure 5: Assay of artemether in dry suspension sample.
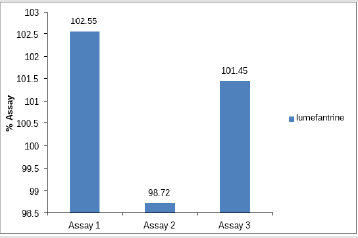
Figure 6: Assay of lumefantrine in dry suspension sample.
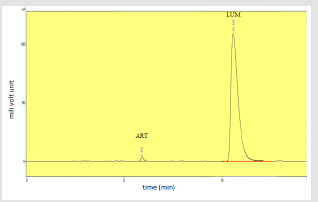
Figure 7: Standard peak area of artemether and lumefantrine.
Note: Abbreviations: LUM: lumefantrine; ART: artemether
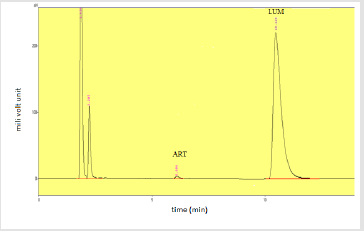
Figure 8: Sample peak area of artemether and lumefantrine. Note: Abbreviations: LUM: lumefantrine; ART: artemether
Method validation
Accuracy: Determination of mean percentage accuracy for concentrations 100%, 75%, 50% and it was found to be within the limit of ± 2% of the standard value. The recovered concentration of artemether at three concentrations was found to be 101.98, 75.09 and 50.87% with percentage accuracy of 101.98%, 100.13% and 101.74% respectively. On the other hand, the recovered concentration of lumefantrine were found to be 98.89, 76.34and 51.06% with %age accuracy of 98.89, 101.78 and 102.12% respectively. Figure 9 shows percentage assay versus concentration and Tables 6 & 7 shows the recovered assay of artemether and lumefantrine respectively.
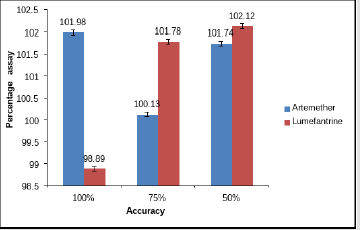
Figure 9: Recovered assay versus concentration.
Note: All the values are means of three parallel replicates. Y-bar errors indicate the standard error of the mean
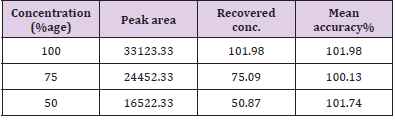
Table 6: Accuracy of Artemether.
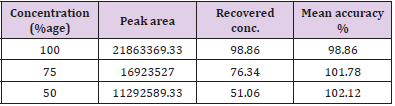
Table 7: Accuracy of Artemether.
Precision
a. Precision of lumefantrine and artemether
Precision of lumefantrine and artemether was performed on 100% concentration of the standard solution. The mean, standard deviation and RSD was calculated for lumefantrine and artemether accordingly. Tables 8 & 9 shows the precision of lumefantrine and artemether.
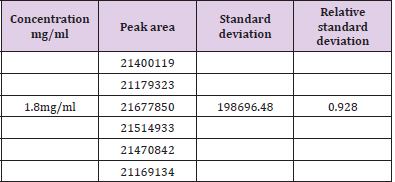
Table 8: Precision of lumefantrine.
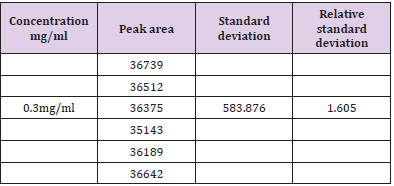
Table 9: Precision of Artemether.
Linearity
a. Linearity of Artemether and lumefantrine
In linearity five concentrations 150, 125, 100, 75, 50% were taken as shown in Tables 10 & 11 along with their respective peak areas 49836, 43522.33, 29887.5, 22498.66, 15389 for artemether and 30470619, 25937384.3, 19308837.3, 15427092 and 11772645.67 for lumefantrine obtained in the complete linearity. The maximum relative standard deviation obtained was 1.280 and the minimum 0.488 for artemether and was 1.988 and the minimum 0.372 for lumefantrine found to be within the limit of 2. The method was found to be linear throughout the experiment. The Correlation coefficient for artemether was found to be 0.9981 which was under the limit of Health Canada, FDA guidelines and coefficient correlation was found to be 0.9968 for lumefantrine. The dilutions were manufactured in the concentration range of 50 to 150%. To represent on graph concentration was taken on x-axis and respective peak area was taken on y-axis. Figures 10 & 11 shows the linearity of artemether and lumefantrine respectively.
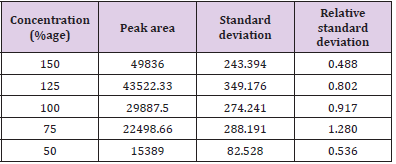
Table 10: Linearity of Artemether.
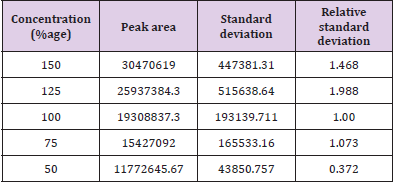
Table 11: Linearity of lumefantrine.
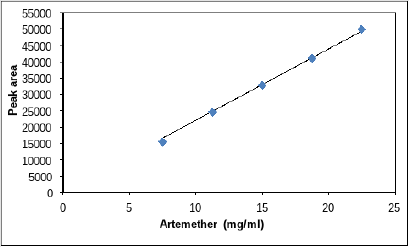
Figure 10: Linearity for Artemether.
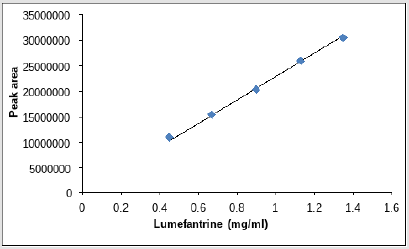
Figure 11: Linearity for Lumefantrine.
Limit of detection and limit of Quantitation
a. LOD and LOQ for Lumefantrine and Artemether
The dilution for LOD and LOQ was prepared for lumefantrine and artemether as discussed in Tables 3 & 4. The correlation coefficient was observed to be 0.999 for lumefantrine and 0.9955 for artemether in the calibration curve. The detection limit and quantitation limit for lumefantrine was observed to be 0.024mg/ml and 0.0714mg/ml respectively and for artemether was observed to be 0.055mg/ml and 0.079mg/ml respectively which form 2.66% and 7.93% in percentage concentration for lumefantrine and 36.66% and 52.66% in percentage concentration for artemether. . Figures 12 &13 illustrates the graphical representation of artemether and lumefantrine.
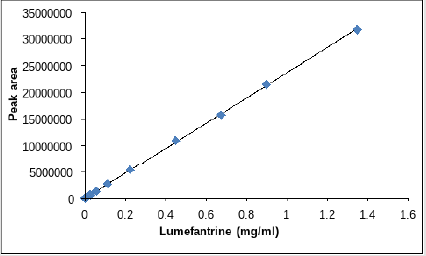
Figure 12: LOD and LOQ graph of lumefantrine.
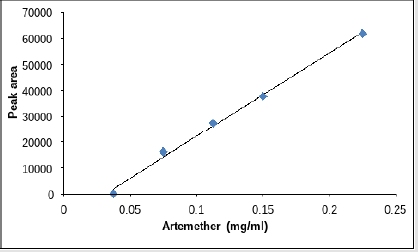
Figure 13: LOD and LOQ graph of Artemether.
Specificity: Injection of solvent methanol and methanolic HCl along with placebo was injected individually to assure the absence of excipients and solvent with the focused drug in the sample of dry suspension. Table 12 shows the specificity components and their results. Figures 14-16 shows the injections of methanol, 0.1N methanolic HCl and placebo respectively.
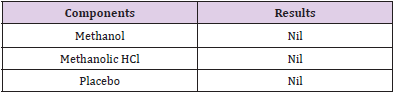
Table 12: Specificity.
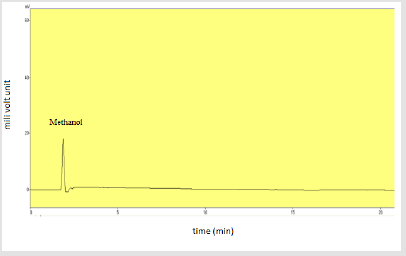
Figure 14: Injection of methanol.
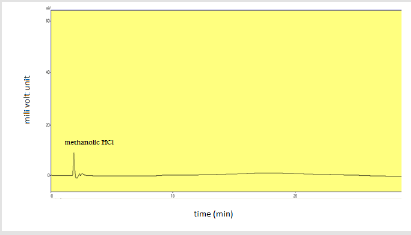
Figure 15: Injection of 0.1N methanolic HCl.
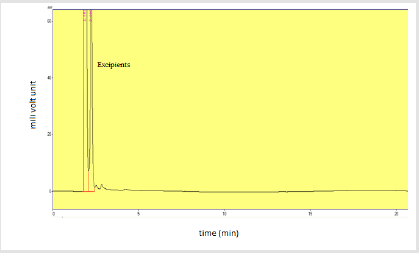
Figure 16: Injection of placebo.
Assay comparison of different dry suspensions available in the market
The percentage assay obtained from sample A dry suspension was 99.46% and 103.49% for artemether and lumefantrine respectively. The assay of sample B was 99.27% and 103.01% for artemether and lumefantrine respectively. The assay of sample C was resulted to be 101.55% of artemether and 100.71% for lumefantrine respectively. Table 13 shows the respective efficacy of the tested products. Figures 17-19 shows standard peak spectrum, Peak spectrum of sample A and sample C respectively.
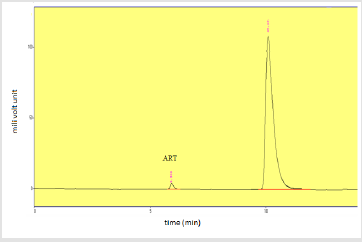
Figure 17: Standard peak of artemether and lumefantrine. Note: Abbreviations: LUM: lumefantrine; ART: artemether
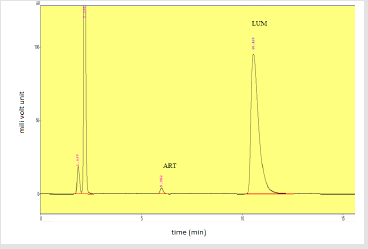
Figure 18: Peak spectrum of artemether and lumefantrine of Sample
Note: Abbreviations: LUM: lumefantrine; ART: artemether
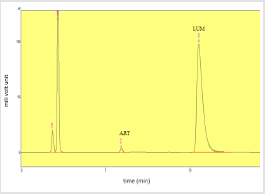
Figure 19: Peak spectrum of artemether and lumefantrine of Sample C.
Note: Abbreviations: LUM: lumefantrine; ART: artemether
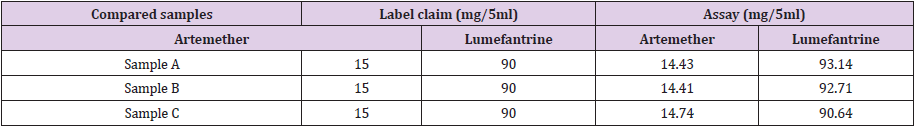
Table 13: Comparison of different dry suspensions available in the market.
Discussion
The main goal of the present study was to determine both
artemether and lumefantrine simultaneously on single wavelength.
Wavelength of 210nm was selected as detector wavelength to
obtain both the drugs on single run. As lumefantrine was slightly
soluble in organic solvents and insoluble in aqueous acids whereas
solubility of artemether was maximum in organic solvents the
diluent methanol was then acidified to methanolic HCl to improve
the absorbance of lumefantrine. Finally 0.01N methanolic HCl
was proved to be promising alternate to be used throughout the
experiment. The mean percentage recovery value of ± 2% was
mandatory for accurate method (ICH Guideline, 2005). For the
U.S. pharmaceutical industry, 100 ± 2% limits were used for drug
substance potency in a product over the limit of 80 - 120% of the
target concentration. Health Canada stated that the accuracy was
a bias of less than or equal to 2% for dosage forms and less than
and equal to 1% for drug substance. The mean accuracy of present
study was declared to be 101.28% for artemether and 100.92% for
lumefantrine which were in the defined limits as discussed. Health
Canada stated that the coefficient of variance of drug substance
should be ≥ 0.997.
In the present study value of coefficient of variance obtained for
artemether was 0.9981 and for lumefantrine it was 0.9968 which
fell within the range stated by Health Canada. A curve achieved
in limit of detection and limit of quantitation with coefficient of
variance (r2) value of 30.99 was considered to be linear and r2 value
of greater than 0.99 was considered more authentic (UNODC,2009).
In the present study the value for r2 in the limit of detection and
limit of quantitation was obtained to be 0.9998 and 0.9955 for
lumefantrine and artemether respectively. If 5 samples are studied
the % RSD of ≤ 3 is acceptable (UNODC, 2009). The maximum %
RSD obtained after studying minimum 5 samples was 1.988 for
lumefantrine and 1.280 for artemether which was acceptable
under the range of UNODC. The FDA stated that the typical RSD
should be 1% for active ingredients and drug products, ± 2% for
raw drugs and finished products. HC also stated that the relative
standard deviation should be 1% for active ingredients and 2% for
their products. The RSD value for artemether and lumefantrine fell
in the defined limit stated by FDA guidelines and HC guidelines.
Individual injections of methanol, 0.1N methanolic HCl and placebo
stated that there was no interference of the diluents with any of
the components of artemether and lumefantrine. On comparison
of different products purchased from the market it had been
revealed that all of the three products of different brands were
equally effective and potent according to their assay. By applying
statistical tool p value was found to be less than 0.05 so the results
are considered to be significant.
Conclusion
The aim of developing simultaneous HPLC method for detection of artemether and lumefantrine in the sample of dry suspension is successfully accomplished and validated. As the results from this study showed that all the analysis results and validation parameters including precision, accuracy, linearity, limit of detection, limit of quantitation and specificity falls under the specified limits of FDA, UNODC, USP and guidelines (2005). Further the application of this method on various suspensions of lumefantrine and artemether have proved that method is reliable and reproducible.
Acknowledgement
The authors would like to acknowledge Riphah Institute of pharmaceutical sciences, Riphah International University Lahore, Pakistan.
Competing interests
The authors declare that they have no competing interests.
Authors’ contributions
Komal Shamshad did the experimental work. Umer Farooq supervised the project. Hamid Mukhtar provided the lab for work. Shamroza Mubarik wrote and finalized the manuscript. Asma Zafar reviewed the manuscript and added tables and figures.
Funding
None.
References
- Guinovart C, Navia MM, Taner M, (2006) Alonso PL. Malaria: burden of disease. Current molecular medicine 6: 137-140.
- Zubairi, ABS Sobia N, Afsheen, Vikram M, Anita F, et al. (2013) Severe Plasmodium vivax malaria in Pakistan. Emerging infectious diseases 19: 1851.
- Suleman S, Vandercruyssen K, Wynendaele E, Hondt M, Brack N, et al. (2013) A rapid stability-indicating, fused-core HPLC method for simultaneous determination of β-artemether and lumefantrine in anti-malarial fixed dose combination products. Malaria Journal 12: 1186.
- Pawan KS, Raman MS, Satish C, Gyanendia S, Chhotan L, et al. (2010) A simple and sensitive HPTLC method for quantitative analysis of artemether and lumefantrine in tablets. Journal of Planar Chromatography-Modern TLC 23: 119-122.
- Epstein JE, Giersing B, Mullen G, Moothy W, Richie TL, et al. (2007) Malaria vaccines: are we getting closer? Current opinion in molecular therapeutics 9: 12-24.
- Da Costa César I, Nogueira FHA, Pianetti GA (2008) Simultaneous determination of artemether and
- Mohamed S, Khalid SA, Ward SA, Want TS, Tang HP, et al. (1999) Simultaneous determination of artemether and its major metabolite dihydroartemisinin in plasma by gas chromatography–mass spectrometry-selected ion monitoring. Journal of Chromatography B: Biomedical Sciences and Applications. 731: 251-260.
- Mannur V, Mastiholimath, Patware P, Khayra R, Mascarenhas, et al. (2013) Analytical method development and validation for simultaneous estimation of Artemether and Lumefantrine in pure and pharmaceutical dosage form using reverse phase high performance liquid chromatography method. Malaysian Journal of Analytical Sciences 17: 348-358.
- Sultan S, Yanick V, Leiseloette V, Luc D, Bart de, et al. (2015) Gas chromatographic method for the determination of lumefantrine in antimalarial finished pharmaceutical products. journal of food and drug analysis 23: 552-559.
- Debnath C, Haslinger E, Likussar W, Michelitch A (2006) Determination of the antimalarial drug artemether in pharmaceutical preparations by differential pulse polarography. Journal of pharmaceutical and biomedical analysis 41: 638-643.
- Tayade NG, MS Nagarsenker (2007) Validated HPTLC method of analysis for artemether and its formulations. Journal of Pharmaceutical and biomedical analysis 43: 839-844.
- Partap YP, Manish P, Geetanjli K, Ghanwat M, Manish A, et al. (2011) Validated spectrophotometric method for quantitative determination of Artemether in pharmaceutical formulation. Der Pharm Chem 3: 135-139.
