 Research Article
Abstract
Proper hydration status is important for athletes, because of its significant influence on physical fitness and mental perception during exercise. Assessment of hydration status is conducted mainly using urinary and plasma indices, which are not always useful at a single time measurements. The study aim was to compare different markers of hydration status in athletes, measured at a single time point. Eighty-nine volleyball players (37 women, 52 men, mean age 16.9y) were recruited. Serum and urine samples were analysed for specific gravity, osmolality, urine and serum osmolality ratio and water deficit. We found a strong correlation between urine specific gravity and osmolality, and only weak correlations with serum osmolality. Urine indices identified 61.8 to 70.8% cases of dehydration, while serum osmolality only 32.6%. Water-deficit was calculated using two different equations which gave contrary results (1.38±0.74% vs -0.33±0.88%). In conclusion, the urinary and plasma indices identified a high occurrence rate of dehydration in athletes, but results derived from different parameters were contradictory. The Uosm:Posm ratio seems to be a useful indicator of dehydration, but should be specified with a reference range or cut-off value.
Keywords:Hydration Status; Osmolality; Specific Gravity; Athletes
Introduction
Maintaining the correct water balance is one of the most
dynamic and important process in human body [1]. This is
especially important for athletes, because dehydration can have a
negative influence on physical and cognitive performance [2,3]. As
such, monitoring athlete hydration status is crucial for optimising
performance during training sessions and competitions. The
assessment of hydration is mainly based on urine and blood indices,
with no consensus regarding the “gold standard” in dehydration
markers [2]. One of the most popular markers is plasma osmolality,
which reflects intracellular dehydration [3]. Other common
indices are urine osmolality and urine specific gravity. Shirreffs
[4] concluded that urinary markers are more sensitive indicators
of dehydration, but they may have a delay in the reaction. Urine
measurements seems to be secondary to plasma osmolality changes
[5]. Searching for better indicators of dehydration, researchers
have tested composite measures calculated on the basis of blood
or urine tests. For example, Cheuvront et al. [6] tested a series of
water-deficit equations, and they found significant improvements
after replacement in the equation of sodium to plasma osmolality.
Likewise, Armstrong et al. [7] suggested that urine:plasma
osmolality ratio could be good indicator of hydration status,
measured at a single time point.
Parallel to the search of reliable dehydration markers, studies
have investigated the utility of identifying cut-off values. The
physiological regulation of plasma osmolality makes that normal
values vary about 1-2% from value of 287mOsm/kg in wellhydrated
individuals [8]. Based on the small deviation, a cut-off of
290mOsm/kg would seem suitable for classifying subjects as being
either euhydrated or dehydrated [9]. Manz and Wentz [7] suggested
cut-off value for urinary osmolality of 830mOsm/kg. Baron et al. [8] suggest that osmolality over 800mOsm/kg is a more appropriate
threshold for differentiation between euhydrated and slightly
dehydrated status. In the case of urine specific gravity, a number of
studies indicate cut-off values of 1.020-1.025 for the upper range
of euhydrated state [10-12]. Given the discrepancies, the aim of
this study was to compare different markers of hydration status in
athletes, measured at a single time point.
Materials and Methods
Eighty-nine volleyball players (37 women and 52 men, anthropometric data in Table 1) participated in this study. Testing was conducted in a laboratory at the Department of Biochemistry, Institute of Sport–National Research Institute in Warsaw, Poland. This study was approved by the Ethical Research Committee at the Institute of Sport-NRI in Warsaw. Participants were arrived at laboratory between 7:00 and 9:00am. The players were at the beginning of the league season and had two training sessions daily. Venous blood and urea samples were collected after arrival on an empty stomach and transferred to the laboratory within 1 hour of collection.
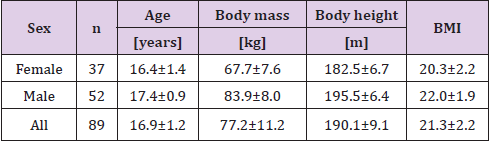
Table 1: Anthropometric characteristic of the study group (mean±SD).
Whole blood was collected into different tubes (Vacuette vacuum system tubes, Greiner bio-One, Kremsmünster, Austria): for glucose measurement containing sodium fluoride, for sodium measurement containing lithium heparin, for measurements in serum containing coagulation accelerator (and left to clot for 30 minutes and centrifuged at 2000g for 10 minutes). Urine was collected in a sterile urine beaker. Serum (Sosm) and urine (Uosm) osmolality was measured by freezing point depression method (OS3000 osmometer, Marcel, Zielonka, Poland), Urine Specific Gravity (USG) using a handheld refractometer (Atago PAL-10s, Tokyo, Japan). For further calculations, sodium concentration (Na+) was measured in whole blood using ion analyser (pHOx plus M, Nova Biomedical, Waltham, MA, USA), plasma glucose and serum urea concentrations were measured using colorimetric methods with Cobas Integra400 biochemical analyser (Roche Diagnostic, Basel, Switzerland) with original manufacturer reagent kits. Water deficit was calculated by equations [6]:
WD1=0.6 x body mass x [1–(140÷Na+)], and
WD2=0.6 x body mass x [1–(290÷Sosm)]
Additional osmolality variable was computed by the formula:
OSMcal= 2 x [Na+]+[glucose]+[urea]
All assays were completed on the same day. Testing was conducted in a laboratory certified from the Polish Centre for Accreditation (no. AB 946).
Statistical Analyses
All data are presented as mean±SD. The Shapiro-Wilk test was employed to determinate data normality. Because most of the data did not follow a normal distribution, Wilcoxon signed-rank tests was used for a comparison of mean differences. Relationships between variables were also determined using Pearson’s correlation coefficient. The level of p≤0.05 was considered significant. Variables were analysed with Statistica 13 software (TIBCO Software INC., Palo Alto, CA, USA).
Results
Table 2 shows the measured parameters, and Table 3 shows correlation between them. Significant but weak correlations were observed between USG and Sosm or WD2. Interestingly, Sosm strongly correlated with WD2 but there were only weak correlation with Uosm:Sosm ratio. Calculated osmolality was significantly higher than measured one, and correlation between them was statistically important but rather weak. We observed statistically significant differences between water deficit equations WD1 and WD2 but with opposite mean values and weak correlation between them. In approximately half of the athletes (49.3%) WD1 results were above 2%, what can be considered as important dehydration, while by WD2 only 1.1% reached this threshold.
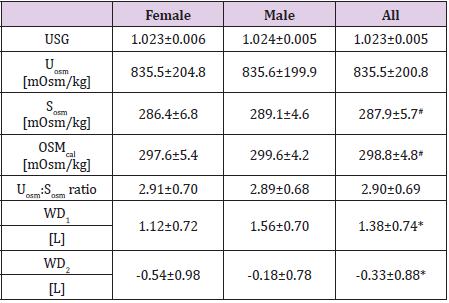
Table 2: Values of measured and calculated parameters (mean±SD).
Note: Statistically significant relationships between: # Sosm and OSMcal, *WD1 and WD2 (p<0.05, Wilcoxon signed-rank test).
There were large discrepancies between numbers of results beyond the adopted cut-off values (Table 4). The highest percentage of athletes with dehydration shows OSMcal, and the lowest Sosm. There were no significant correlation between measured or calculated parameters and the age of the athletes.
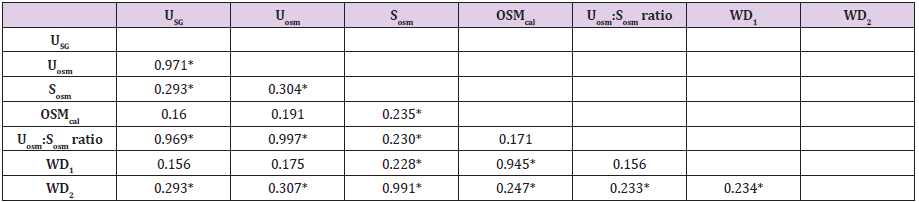
Table 3: Values of measured and calculated parameters (mean±SD).
Note: *Statistically significant correlation (p<0.05).
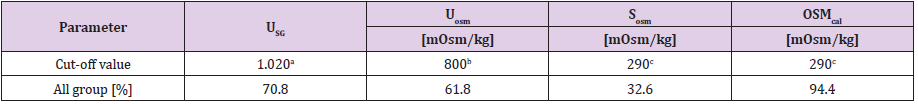
Table 4: Percentage of results above adopted cut-off values.
Note: Cut-off values adopted from: aSawka et al [14], bManz and Wentz [9], cKenefick et al [8].
Discussion
Maintaining proper hydration status is important for athletes, because its impact on physical fitness and mental perception [13]. A common practice in sport is the monitoring of hydration using different biomarkers [14]. Problem of maintaining appropriate hydration status is often studied in disciplines with weight categories, e.g. combat sports [15]. In our study, more than 60% athletes had results of urine indices above cut-off values, shows dehydration status. Considering serum osmolality, only about one-third of the athletes tested were classified as dehydrated. It is noteworthy that the urine indices identified a similar percentage of euhydrated subjects. The greatest percentage of above cut-off values was observed in OSMcal. It is interesting, because only in 33.7% of cases [Na+] concentration were above 145mmol/L, what indicates hypertonicity [10]. The results show that the problem of dehydration applies even in those sports that seem less exposed to the occurrence of this phenomenon. One of the most accepted indicators of hydration is plasma osmolality [11]. However, Hamouti et al. [12] suggested that Posm is less sensitive after an overnight recovery, and urine specific gravity and osmolality are better under these circumstances. In turn, Cheuvront and Kenefick [16] concluded that urine-based measurements are secondary to changes in Posm for detecting dehydration. Shirreffs [4] stated that urinary measures could have a time lag over the short term.
In the current study, we found significant correlations between the urinary indices and Sosm. The percentage of urine results above the adopted cut-off values shows more dehydration cases when compared with data for Sosm. This finding partly confirms the assertion that plasma osmolality could better describe acute changes of hydration status. Although, we measured serum not plasma osmolality, the results are interchangeable [10]. For an accurate assessment of hydration status in sport, it is important to determine appropriate cut-off values for different hydration biomarkers. Unfortunately, wide discrepancies exist in the proposed values for urine osmolality, ranging from 700mOsm/kg [17] to above 1000mOsm/kg [18]. We adopted a value of 800mOsm/kg as a meaningful threshold for differentiation between euhydrated and dehydrated status [7]. In reference to urine specific gravity, most authors apply 1.020 as a cut-off value [11]. Similarly, in case of plasma osmolality, a threshold value of 290mOsm/kg is widely accepted.
A lack of consensus around what constitutes the “gold standard” index for assessing hydration status has promoted studies in this area. Armstrong et al. [19] proposed the Uosm:Posm ratio as a potential hydration biomarker, which can be measured at a single time point. Results obtained in our study are similar to Armstrong’s data on a low-volume drinkers group. To our knowledge, there are no specific reference range for this ratio, with values <1.0 only indicating the existence of relative water excess. Our data highlight the need to determine reference range or cut-off value for this parameter. Two water-deficit equations were replicated in this work; the most common (WD1) and the best according to the authors (WD2). We found significant differences and in relation to other obtained results, the WD1 equation seems to be more relevant. The percentage of results above 2% of water deficit, that is considered as significant for performance [20], were 49.4% for WD1 and 1.1% for WD2. Thus, the WD1 results are more convergent with other measures taken in this study. In conclusion, the occurrence frequency of dehydration in the athletes confirms the need for determination of reliable markers of hydration status in different sports disciplines. Urine is a more accessible material for research, but seems to be less effective with only single measurements obtained. The Uosm:Posm ratio seems to be a useful indicator of dehydration status, but should be applied with a specified reference range or cut-off value. In future study should be investigated the need of determining the specific cut-off values for different sports disciplines.
Acknowledgment
The study was financially supported by Institute of Sport– National Research Institute, grant number: 103.04.
References
- Jequier E, Constant F (2010) Water as an essential nutrient: the physiological basis of hydration. Eur J Clin Nutr 64(2): 115-123.
- Armstrong LE (2007) Assessing hydration status: the elusive gold standard. J Am Coll Nutr 26: 575S-584S.
- Cheuvront SN, Kenefick RW, Charkoudian N, Sawka MN (2013) Physiologic basis for understanding quantitative dehydration assessment. Am J Clin Nutr 97(3): 455-462.
- Shirreffs SM (2003) Markers of hydration status. Eur J Clin Nutr 57: S6-S9.
- Shoker AS (1994) Application of the clearance concept to hyponatremic and hypernatremic disorders: a phenomenological analysis. Clin Chem 40(7): 1220-1227.
- Cheuvront SN, Kenefick RW, Sollanek KJ, Ely BR, Sawka MN (2013) Water-deficit equation: Systematic analysis and improvement. Am J Clin Nutr 97(1): 79-85.
- Manz F, Wentz A (2003) 24-h hydration status: parameters, epidemiology and recommendations. Eur J Clin Nutr 57 Suppl 2: S10-S18.
- Baron S, Courbebaisse M, Lepicard EM, Friedlander G (2015) Assessment of hydration status in a large population. Br J Nutr 113(1): 147-158.
- Kenefick RW, Ely BR, Cheuvront SN, Palombo LJ, Goodman DA, et al. (2009) Prior heat stress: effect on subsequent 15-min time trial performance in the heat. Med Sci Sports Exerc 41(6): 1311-1316.
- Hew-Butler TD, Eskin C, Bickham J, Rusnak M, Vander Meulen M (2018) Dehydration is how you define it: comparison of 318 blood and urine athlete spot checks. BMJ Open Sport Exerc Med 4(1): e000297.
- Sawka MN, Burke LM, Eichner ER, Maughan RJ, Montain SJ, et al. (2007) American College of Sports Medicine position stand. Exercise and fluid replacement. Med Sci Sports Exerc 39(2): 377-390.
- Hamouti N, Del Coso J, Mora-Rodriguez R (2013) Comparison between blood and urinary fluid balance indices during dehydrating exercise and the subsequent hypohydration when fluid is not restored. Eur J Appl Physiol 113(3): 611-620.
- Maughan RJ, Shirreffs SM (2010) Dehydration and rehydration in competative sport. Scand J Med Sci Sports 20: 40-47.
- Lee EC, Fragala MS, Kavouras SA, Queen RM, Pryor JL, et al. (2017) Biomarkers in sports and exercise: tracking health, performance, and recovery in athletes. J Strength Cond Res 31(10): 2930-2937.
- Zubac D, Marusic U, Karninčič H (2016) Hydration Status Assessment Techniques and Their Applicability Among Olympic Combat Sports Athletes. Strength Cond J 38(4): 80-89.
- Cheuvront SN, Kenefick RW (2013) Comparison between blood and urinary indices for dehydration: A different interpretation. Eur J Appl Physiol 113(8): 2167-2168.
- Cleary MA, Hetzler RK, Wasson D, Wages JJ, Stickley C, et al. (2012) Hydration behaviors before and after an educational and prescribed hydration intervention in adolescent athletes. J Athl Train 47(3): 273-281.
- Armstrong LE, Maresh CM, Castellani JW, Bergeron MF, Kenefick RW, et al. (1994) Urinary indices of hydration status. Int J Sport Nutr 4(3): 265-279.
- Armstrong LE, Johnson EC, Munoz CX, Le Bellego L, Klein A, et al. (2013) Evaluation of Uosm: Posm ratio as a hydration biomarker in free-living, healthy young women. Eur J Clin Nutr 67(9): 934-938.
- Adan A (2012) Cognitive performance and dehydration. J Am Coll Nutr 31(2): 71-78.
