 Research Article
Abstract
Objective: Weathering of silicates produces Ca and Mg cations and soluble silicon (Si. gw). Ketosis, Acetonaemia (Keto) is a metabolic disorder associated with intense adipose mobilization, high glucose needs and partial anorexia, typical in early lactation. The Keto data are based on veterinary reports from eight Decembers in 1979-93 [Keto.(79-93) (.Dec)] and from 3x12 months from 1994-96 [Keto.(94-96).(1/12)].This study is assessing geographic associations of Keto and (male) CHD (from 1964-84) with weathering related: groundwater (gw) hardness [(Ca+Mg).gw], [Si.gw], [(Mg/Ca).gw], latitude and longitude of provincial capitals ([Lat.cap], [Long.cap]) and soil-type index: proportion of moraines in coarse mineral soil samples [Prp.(mor/coms)].
Results: Explanation percent (R square in percents), significance, beta coefficient signs (& their ratio, in combined regressions).
a. [(Ca+Mg).gw] explained Keto.(94-96) by 56.7 % (p = 0.005)(-); CHD by 65.7 % (p = 0.001)(-), Ca.gw by 95.8 % (p < 0.001)(+) and Mg.gw by 5.2 %,ns,(+). CHD explained Keto.(94-96) by (49.1 %, p = 0.011)(+).
b. [(Ca+Mg).gw; Si.gw] explained Keto.(94-96) by 60.2 % (p = 0.016)(-;-)(80:20) and CHD by 81.0 % (p = 0.001)(-;-)(69:31). [(Ca+Mg).gw;(Mg/Ca).gw] explained them somewhat more weakly, but with similar beta coefficient ratios.
c. [Lat.cap; Long.cap] explained Keto.(94-96) by 55.1 % (p = 0.027)(+;+)(56:44) and CHD by 96.9 % (p < 0.001)(+;+)(22:78). [Lat.cap;Prp.(mor/coms)] explained Keto. (94-96) by 55.9 % (p = 0.025) (+.+) (58:42) and CHD by 50.4 % (p = 0.042)(+.+) (45:55).
d. Keto.(79-93) (December values) associated weaker than Keto.(94-96) (whole year values) with the explaining parameters .
Conclusion: Regional CHD and Keto.(94-96) associated significantly with each other and factors associated with soil weathering.
Keywords: Silicon; Weathering; Groundwater; Availability;R egional; Cattle ketosis; Human CHD; Veterinary Reports
Abbreviations: CHD: Coronary Heart Disease; CVD: Cardiovascular Disease; Keto: Ketonaemia/Ketosis/ Acetonaemia; Provinces as in 1960- 97 (more precisely in 1974-97); Keto.(79-93) mean monthly data of 8 Decembers (1979, 1981,1983, 1985, 1989,1991, 1992,1993); Keto. (94-96): mean annual data of 1994, 1995 and 1996 divided by 12, i.e. mean monthly data; RC: Rural center; [Prp.(mor/coms)]: Number ratio of cropland moraine samples per samples from coarse mineral soils total.
Introduction
The sum of weathered/liberated Ca and Mg has been used as a measure for estimation of consumption of atmospheric CO2 [1]: “… only the weathering of Ca and Mg silicates is important for the global C cycle…”. Weathering of silicates consumes CO2 [1] and produces HCO3- and silicic acid [2], i.e. orthosilicic acid [Si(OH)4] [3] and cations: K, Mg [4] and Ca [1]. Example: Mg2SiO4 + 4 CO2+ 4 H2O ⇌ 2 Mg2+ + 4 HCO3+ H4SiO4 [i.e. Si(OH)4], in this article Si.gw [2]. (Weathering of one molecule of Ca- or Mg-silicate consumes 4 molecules CO2). Gaillardet et al. [1] estimated that silicate weathering consumes annually ca 58 Mt carbon [1] so working against soil acidification. Ketosis, Acetonaemia, (Keto) “typically occurs in dairy cows in early lactation and is most consistently characterized by partial anorexia and depression” [5]. “The pathogenesis of bovine ketosis is incompletely understood, but it requires the combination of intense adipose mobilization and a high glucose demand. Both of these conditions are present in early lactation” [5].
This study is assessing geographic associations of Keto and (male) CHD (from 1964-84) with weathering related: groundwater (gw) hardness [(Ca+Mg).gw] [1], Si(OH)4 [Si.gw] [2,3], (soil-type related) [(Mg/Ca).gw] [6], (temperature-related) [Lat.cap], (soil age related) [Long.cap] [7] and soil coarsenes index [Prp.(mor/ coms)].
Materials and Methods
Map and label numbers of Finnish Provinces are from [8], but they are put to the same order as respective RC’s in [6,7]: (08 Kuopio before 07 North Karelia and 03 Åland as the last province). Periods are represented by their two last numbers, e.g. (79-93) for 1973- 93). Number of dairy cows (cows) for December 1983, as a measure of cattle, are readily by provinces from [9]. Provincial data for May 1995 are formed, if needed, by combining data of Rural Business Districts (labeled as Rural Centers) [10] as follows: 02 Turku and Pori (= Turun+Satakunnan), 04 Häme (= Hämeen+Pirkanmaan), 10 Vaasan (= E-Pohjanm. + “Vaasan” + 2/3*K-Pohjanm.), 11 Oulun (= 1/3*K-Pohjanm.+Oulun+Kainuun). Other data was readily given, e.g. Åland. Data of December 1983 was adjusted to June 1983 (nearer, but not just to May 1983) by multiplying the provincial numbers from December 1983 [9,10] by 1.046, i.e. the ratio of total number (thousands) of dairy cows in May 1983 [11] (663.1) and December 1983 (634.2) [9]. Total number of dairy cows for 1979 is from [12], for 1980-1996 from [11]. Provincial cow number estimates for other than 1983 and 1995 are attained after that by linear interpolation by total cow number [11,12]. Total number of cows was reduced by 46 % during the study period (Table 1).
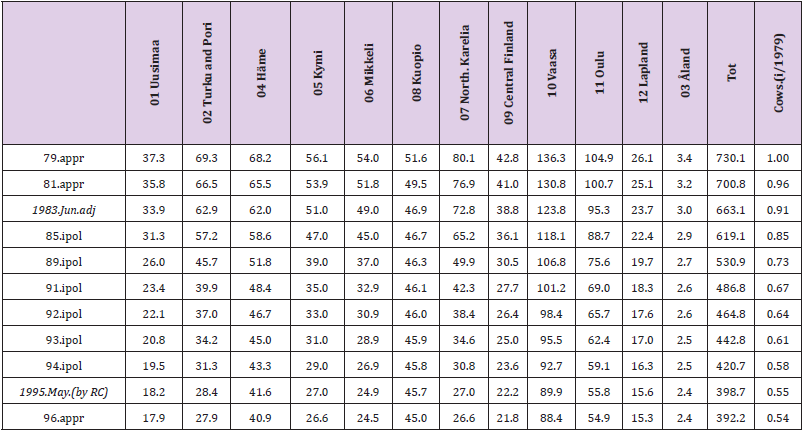
Table 1: Estimated number of dairy cows (1,000) of Finnish provinces in 1979-1996 and their relative ratio to respective number of 1979.
Data on incidental cases of Ketosis (Keto) are from the same source [13] as HMg and HCa in [9]. Given numbers of (94-96) are readily divided by 12, so all numbers in (Table 2) represent monthly incidence. Annual/inter-periodical variation predicted by Pearson correlations was rather small (Table 2). (Table 3) represents Keto. (79-93) and Keto.(94-96) and their provincial ratio with national means. Periodical values are attained by dividing means of periodical cases by means of periodical number of dairy cows. Keto showed inter-periodically a decreasing trend, on an average ca 30 %, only in Northern Karelia Keto number was higher in (94-96) to (79-93) (Table 3). Age adjusted CHD mortality estimates of middleaged men in 1964-84 is attained from [6], originally from [14] (Table 4). Latitude and longitude of Finnish provinces are attained via internet by the names of the provincial capitals (Table 4) and “Wikipedia”. Minutes (‘) and seconds (‘’) are changed to degrees by the author (Table 4). Provincial groundwater calcium, magnesium and silicon are as such, not composed by samples of Rural Centers, but changed to milliequalents (mEq/l) from Geological Survey of Finland [15], totaling 753 samples (Table 4). Soil-type index [Prp. (mor/coms)] is the numerical ratio of cropland moraine (mor) samples ( N 98,271) per samples from coarse mineral soils (coms) total ( N 318,788).
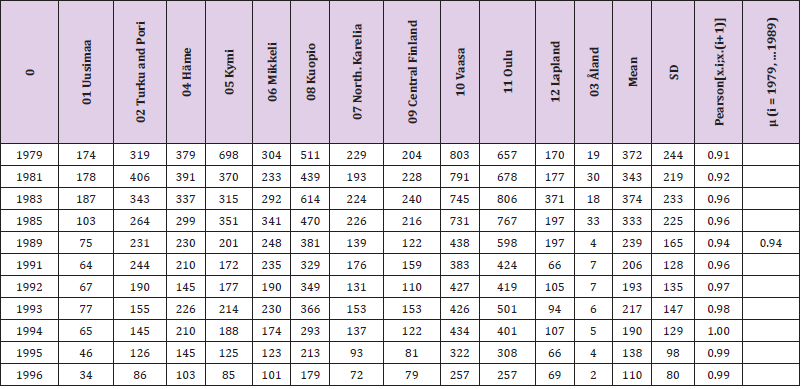
Table 2: Estimated number of dairy cows (1,000) of Finnish provinces in 1979-1996 and their relative ratio to respective number of 1979.
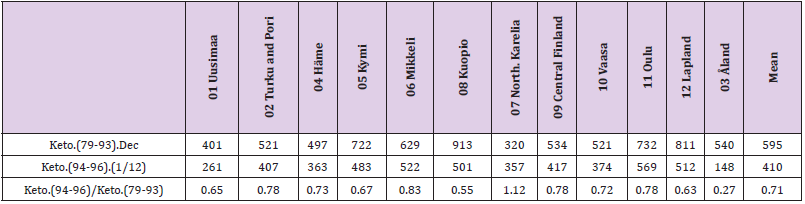
Table 3: Provincial Keto, (1/100,000), per month by periods and their national means and ratio of provincial cases of (94-96) to those of (79-93) by province and their national mean.
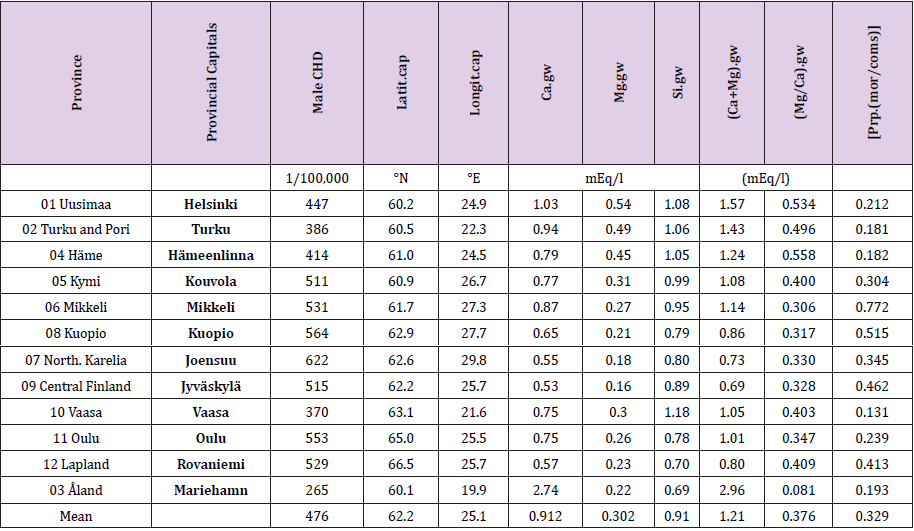
Table 4: Finnish provinces, provincial capitals, CHD mortality of middle-aged men, latitude, longitude of provincial capitals, groundwater Ca, Mg, Si, (Ca+Mg) and (Mg/Ca) with means and soil-type coarseness, [Styp.coars] (proportion of moraine samples per samples from all coarse mineral soils) (coarse mineral soils = moraines and sands).
Data by Rural Centers (RC) are available most easily from [16], originally from [17]. Provincial data are attained by weighting cropland values by the cropland areas by RC’s , which are totally inside of the province [6], but areas of Pirkanmaa, Itä-Häme and K-Pohjanmaa (Central Ostrobothnia), which are located in 2-3 provinces are multiplied by 0.7 before weighting (Table 4). After that weighting provincial Prp.(mor/coms) was got by dividing provincial Prp.mor by Prp.coms. Factors of (combined) regressions are in square brackets: [].
Results
Results are given in order: explanation percent (R square in percents), significance, beta coefficient sign(s) (& ratio of their absolute values, in combined regressions).
a. [(Ca+Mg).gw] explained [Keto.(94-96)] by 56.7 % (p =
0.005)(-); [CHD] by 65.7 % (p = 0.001)(-), [Ca.gw] by 95.8 % (p
< 0.001)(+), Mg.gw by 5.2 %,ns,(+), [Latit.cap] by 32.2 % (p =
0.054)(-) and [Long.cap] by 51.6 % (p = 0.009)(-).
b. [Keto.(94-96)] was explained 49.1 % (p = 0.011)(+) by
CHD (Figure 1); 40.5 % (p = 0.026)(+) by [Lat.cap], 30.8 % (p
= 0.061)(+) by [Long.cap]. [CHD] was explained 26.5 % (p =
0.087)(+) by [Lat.cap] and 91.1 % (p < 0.001)(+) by [Long.cap]
Fig.1 represents Keto.(94-96) and its regression by CHD.
c. [(Mg/Ca).gw] explained [Si.gw] by 45.6 % (p = 0.016)(+).
(Combined regression by) [Lat.cap;(Mg/Ca).gw] explained [Si.
gw] by 62.8 % (p = 0.012)(-;+)(39:61). Si.gw of Vaasa does not
comply with the regression. (Figure 2).
d. [(Ca+Mg).gw; Si.gw] explained Keto.(79-93) by 23.8 % (p
= 0.295)(-;-)(38:62); Keto.(94-96) by 60.2 % (p = 0.016)(-;-)
(80:20) and CHD by 81.0 % (p = 0.001)(-;-)(69:31). (Table 5,
Figures 3-5). Regional mean of CHD and Keto.(79-93) and Keto.
(94-96) are of the same magnitude. ca 400 – 600 (1/100,000).
e. Remarkable is the low number of Keto cases in North
Karelia.
f. Respectively [(Ca+Mg).gw;(Mg/Ca).gw] explained Keto.
(79-93) by 12.4 % (p = 0.551)(-;-)(53:47), Keto.(94-96) by
57.9 % (p = 0.020)(-;-)(87:13) and CHD by 72.8 % (p = 0.003)
(-;-)(76:24). (Table 6).
g. [Lat.cap; Long.cap] explained Keto.(79-93) by 26.9 % (p =
0.245)(+;+)(100:0.04), Keto.(94-96) by 55.1 % (p = 0.027)(+;+)
(56:44) and M.CHD by 96.9 % (p < 0.001)(+;+)(22:78), (Table7,
Figures6 & 7).
h. [Lat.cap; Prp.(mor/coms)] explained Keto.(79-93) by
34.9 % (p = 0.145)(+;+)(61:39), Keto.(94-96) by 55.9 % (p =
0.025)(+;+)(58:42) and M.CHD.(64-84) by 50.4 % (p = 0.042) -
(+;+)(45:55).

Figure 1: Keto.(94-96) and its regression by male CHD .(64-84).
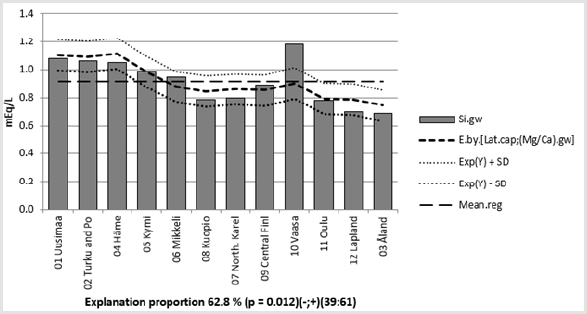
Figure 2: Si.gw and its regression by [Lat.cap;(Mg/Ca).gw].
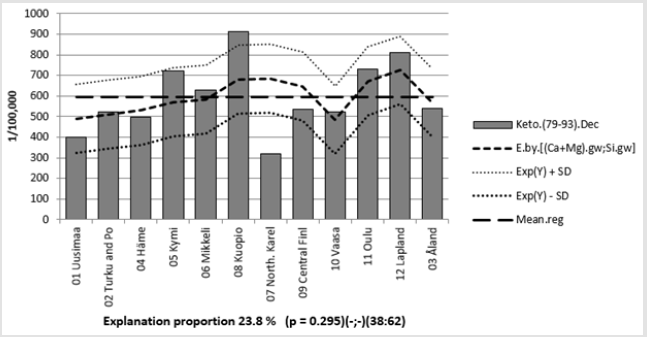
Figure 3: Keto.(79-93) and its regression by [(Ca+Mg).gw;Si.gw].
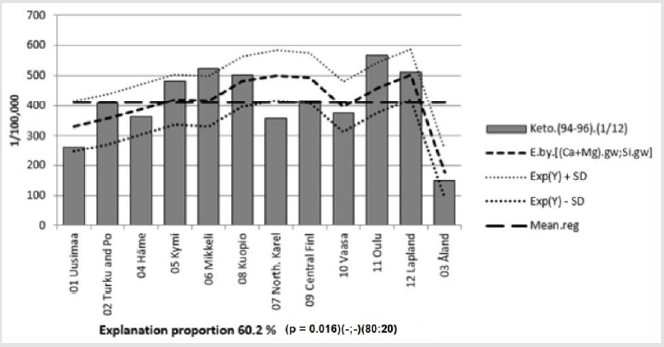
Figure 4: shows Keto.(94-96) and its regression by [(Ca+Mg).gw;Si.gw].
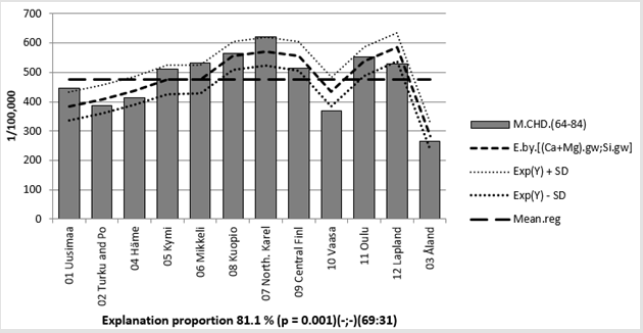
Figure 5: Male CHD.(64-84) and its regression by [(Ca+Mg).gw;Si.gw].
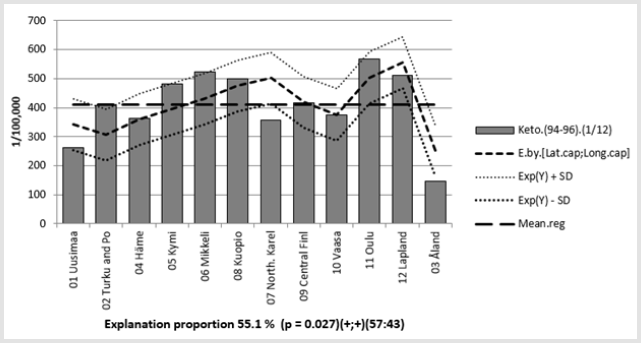
Figure 6: Keto.(94-96) and its regression by [Latit.cap;Longit.cap].
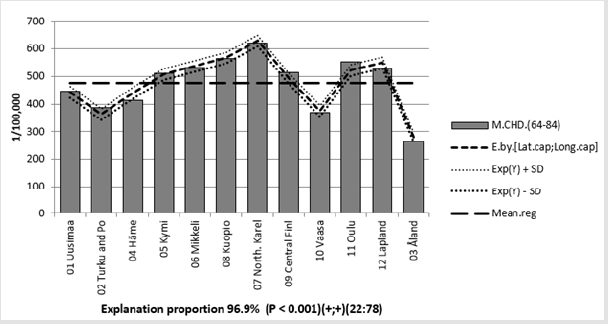
Figure 7: Male CHD.(64-84) and its regression by [Lat.cap;Long.cap].
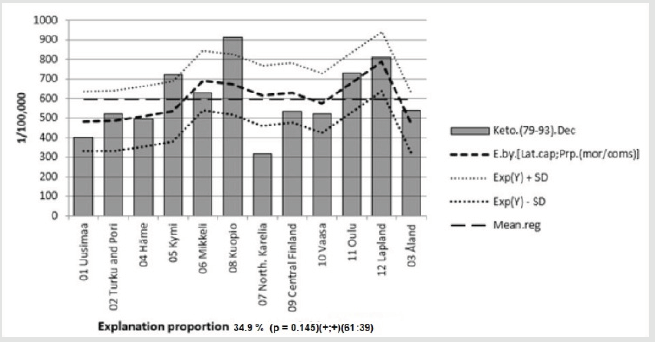
Figure 8: Keto.(79-93) and its regression by [Lat.cap; Prp.(mor/coms)].
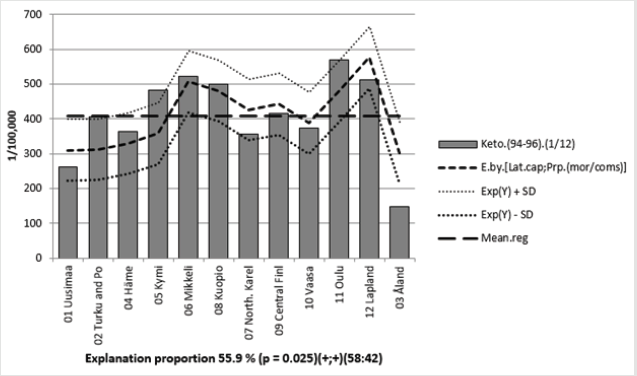
Figure 9: Keto.(94-96) and its regression by [Lat.cap; Prp.(mor/coms)].
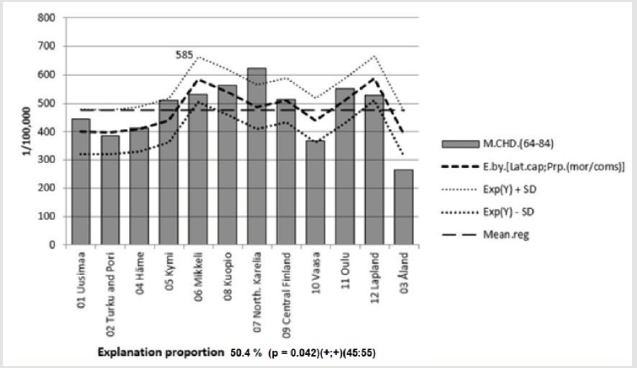
Figure 10: M.CHD.(64-84) and its regression by [Lat.cap;Prp.(mor/coms)].
Discussion
Combined regressions by factors associated with soil
weathering in Finland {[Ca+Mg).gw;Si.gw]; [Ca+Mg).gw;(Mg/Ca).
gw]; [Lat.cap;Long.cap] and [Lat.cap;Prp.(mor/coms)]} explained
significantly Keto.(94-96) and CHD, somewhat similarly, but weaker
Keto.(79-93). In general CHD was more significantly explained by
the combined regressions, but Keto.(94-96) complied better with
regression by [Lat.cap;Prp.(mor/coms)] (Tables 5-8). The indicator
of weathering: water hardness (Ca+Mg) explained significantly
Keto.(94-96) [by 56.7 % (p = 0.005), (-)] and M.CHD.(64-84) [by
65.7 % (p = 0.001),(-)]. Addition of explaining factors (Mg/Ca).
gw and Si.gw strengthened the associations, by Si.gw more than
by (Mg/Ca) (Tables 5 & 6). High correlation between Ca.gw and
(Ca+Mg).gw (higher than by Mg.gw) indicates, that Ca.gw can be
used at least in Finland, as an indicator of gw hardness.
We can ask: why the weathering products, (Ca+Mg).gw and
Si.gw, do not correlate well in Åland, when they are quite well
correlated in continental Finland. Answers: in Åland (Ca+Mg).
gw is produced from two sources: carbonates and silicates [18],
and moderately high pH obviously has reduced Si.gw content [6].
Carbonates indicate soil-type juvenility (and non-podsol soil-types)
[19], (i.e. better weatherability). High sum of cations suggests on
sustaining factor(s), silicates, or clay material [20].
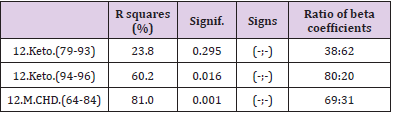
Table 5: Combined regressions of Keto.(79-93), Keto.(94-96) and CHD by [Ca+Mg).gw;Si.gw] their R squares, significances and signs and ratios of beta coefficients (by absolute values).
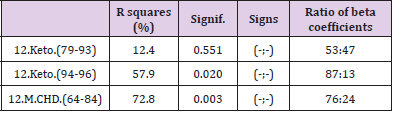
Table 6: Combined regressions of Keto.(79-93), Keto.(94-96) and CHD by [Ca+Mg).gw;(Mg/Ca).gw], their R squares, significances, signs and ratios of beta coefficients (by absolute values).
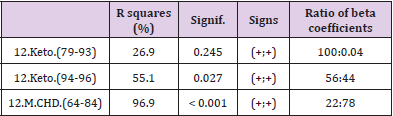
Table 7: Combined regressions of Keto.(79-93), Keto.(94-96) and CHD by [Lat.cap;Long.cap], their R squares, significances, signs, and ratios of beta coefficients (by absolute values).
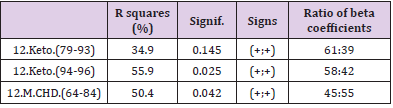
Table 8: Combined regressions of Keto.(79-93), Keto.(94-96) and CHD by [Lat.cap; Prp.(mor/coms)], their R squares, significances, signs and ratios of beta coefficients (by absolute values).
[(Mg/Ca).gw] has explained significantly inversely M.CHD in continental Finland in several studies, as in [17]. But [Mg/Ca). soil], which has been thought to be the influential factor, generally explained CHD remarkably more weakly, or not at all [19]. In north Finland, including 22 % of Finnish cultivated soil [6] and 25 % soil samples [16], (Mg/Ca) of soil did not comply with (Mg/Ca).gw, but in whole Finland gw and soil (Mg/Ca) explained significantly (p = 0.006) each other, calculated by data in [17]. Provincial [(Mg/Ca). gw] value of Åland, based only on six samples [15], could be rejected, because of statistical reasons, but it complies with cropland (Mg/ Ca), based on 4,200 soil samples [16,17-21]. (Mg/Ca) gw and soil got their lowest provincial value in Åland, where the CHD mortality of middle-aged men was the lowest (every year) between 1964 and 1984 [14]. On the other side the HCl-soluble Mg reserves can be the highest in carbonate soils [22]. Anyhow Finnish provincial (Mg/Ca) of timothy has been the lowest in Åland [23], which suggests that high Mg availability cannot explain the low CHD mortality in Åland. (Mg/Ca).gw explained significantly Si.gw by 45 % and together with latitude by 64 % (p = 0.010) (Figure 2). High (Mg/Ca) ratio indicates not only on soil-type, but the same time on soil content of clay material [21].
Temperature (here latitude) can promote soil weathering (and production of Si(OH)4 and Mg, Ca and K cations [1-4]). This explains, why in (Figure 2) [Lat.cap] fortified the explanation of Si.gw by (Mg/Ca).gw. (Figure 2) suggests that high Si.gw of Vaasa could be based on statistical bias, as by Ostrobotnia, included in Vaasa [17] or soil pH [6]. Possible explanation, why (Ca+Mg) is a better measure for weathering [1] than (Mg/Ca), is that Si(OH)4 and cations can be produced not only from clay material, but even from such granite components, which produce cations in different proportions to clay [24]. Latitude and longitude increased both Keto and CHD risk. (Table 7). [Latit.cap] explained (Ca+Mg).gw by 32.2 % (p = 0.054)(-) and [Longit.cap] by 51.6 % (p = 0.009)(-). So (Ca+Mg).gw can be included to “east risk factors”. (It was more strongly associated with longitude than (Ca+Mg).soil. This can be calculated e.g. data in [6]) Combined regression by [Lat.cap;Long. cap] explained CHD better than the gw factors. Both Keto series associated stronger with latitude than with longitude, oppositely to CHD. Latitude is associated with shorter pasture period and shorter period to get fresh grass and with less effective weathering (temperature dependent). Longitude is associated with soil age: period open for weathering and erosion (erosion = weathering + transport), additionally associated with altitude and higher number of rainy days [25] and so obviously with lower level in vitamin D synthesis in the skin.
Explanation for rainy days is the higher altitude in the eastern regions [25]. Earth elevation in the western Finland has been ca 250 m during the last 9,000 yrs [26]. Earth elevation moved the southern coast northwards, so that elevation was not purely east-west phenomenon. (Elevation affected on Altitude, which could possibly be a better factor to longitude if it could be properly determined.) The lower areas have been receivers of minerals and the higher areas have been losers. These parameters are largely explained by gw (and soil) parameters, but factor longitude possibly needs other explanations, as vitamin D and genetic factors by humans. It seems that in interpretation of effects of genetic factors, other geographic factors need assessment. It is obvious that cattle ketosis was not caused by the same genes as human CHD. Combined regression by temperature and soil-type indicators: [Lat.cap;Prp.(mor/coms).88], (Table 8), explained better Keto.(94-96) than CHD. Relative weights of these factors were nearer each other than in other combined regressions. [(Ca+Mg).gw] is an indicator of weathering but cannot tell as well as the (Ca+Mg) of the rivers [1] about the speed of its formation (weathering/erosion rate). Obviously estimated CO2 consumption via silicate weathering ca 200 Mt/yr (58 Mt C/yr) [1] is an underestimation because coarse soil fragments, including stones, have a much higher short term impact on nutrient input than previously thought based on weathering rates, [27].
Obviously, inorganic soil tests results can be used only as (lower) estimates of weathering. The biological function of soil (or its potential) seems to be underestimated. In cattle ketosis low grade inflammation and problems in intestinal integrity (so called “leaky gut”) is believed to be the source of LPS infiltration and cause of systemic inflammation [28]. I.e. in cattle Ketosis structural factors and inflammation can be associated with silicon as in atherosclerosis of humans [29]. Anyhow veterinary surgeon Haaranen wrote that in the prophylaxis and treatment of cattle Ketosis the “only healthy procedure for reinforcement/supply of blood sugar is to guide fermentation in rumen to produce more propionic acid and reduce formation of acetic acid so that their proportions would be 1:1 [30]. He wrote that traditionally farmers had given Ketose cows moldy hay (which cows eagerly ate [30]) and that after rainy summers 1954, 1962, 1967 and 1974 incidence of cattle ketoses was unusually low. (Haaranen wrote that these observations on moldy hays are not yet given as a recommendation,” before studies have given more knowledge on bacterium-mold ratios in soil, plant, fodder and rumen, as well as on fermentation processes in rumen” [30]). In 1974 was discovered in USA, that moldy hay contains monensin, produced by a mold Streptomyces cinnamonensis, which can increase relatively propionic acid production by 50 % [30]. Monensin is not available in all countries [5].
On the other hand, via changes in fodder quality and delivery, cattle Ketosis is nearly totally disappeared until today in Finland [31]. Remarkable was the low Keto during both periods in Northern Karelia (e.g. Figures 3 & 4), (caused by monensin?).
Open question has been the low CHD mortality in Åland, which is associated with highest provincial (Ca+Mg).gw and lowest (gw and) cropland (Mg/Ca) in Finland [17]. Earlier (2018) (semiskimmed) milk contents of acid-soluble Si in seven Finnish dairy samples was 90 (+/-83) ppm (mg/kg), in Åland 133 (+/- 120) ppm and in continental Finland 58 (+/- 17) ppm. Results varied between 30 -270 ppm: highest in July (Åland) and lowest in October (Åland) [32,33]. This year, between April 21 and Sept 3, were analyzed together 25 samples of semi-skimmed milk from Åland and continental Finland. Milk samples of continental Finland were collected by a dairy locating in a region of southern Finland, where Si.gw, (Ca+Mg).gw and (Mg/Ca).gw were remarkably higher than the regional mean of the whole country. Anyhow area of milk collection included several regions, why these associations cannot be benefited as such (or not at all) in conclusions. 40 % of the results were below the detection threshold. “<2” ppm. After replacing “<2” by 1, the whole country mean of acid soluble Si of semi-skimmed milk was 1.9 (+/- 0.86) ppm, no clear differences was found between continental (1.9 +/- 0.83) and Åland (1.9 +/- 0.94) values nor caused by agricultural practices (organic or conventional).
(Benefiting of silicate amendments seems not to be a standard
routine in organic nor conventional agriculture). The analyze
method was checked by Eurofins: no differences were found
between analyze methods of 2018 and 2020 [32]. The difference
between 2018 and 2020 could obviously be explained by the very
dry and hot weather in summer 2018: The temperature was 2.1
°C above the normal and rainfall (precipitation) 46 % below the
normal [34]. Low precipitation affected especially the west Finland
as Åland (“rainfall was unusually low in the western half of the
country” [35]. The author was reported that the yield of crops in
Åland was only about 50 % from normal. These could have caused
increased weathering via the elevated temperature and need of
plants to take water and nutrients from groundwater and deeper
soil layers than usually. Although the Si values in 2018 were ca
50 times higher than in 2020, they were related with each other
as Australian wheat (500 - 5,000 ppm) to Finnish wheat (50 – 100
ppm) [33,36]. Results from 2018 and 2010 together: 1) Temperature
can effect on Si content of milk (and plants) as suggested in [33]. 2)
Si content of milk and other food in Åland can be, independent of
lower Si.gw value as high as (or higher than) in continental Finland.
More accurate determination of geographic milk origin (or farm
related samples contra mean dairy samples), history of agricultural
practices and silicate supplementation, soil-type distribution, and
temperature during 1-3 days before sampling are needed in the
further studies. Acid-soluble and water-soluble Si are suggested to
be analyzed separately, coincidentally.
Benefits of weathering are associated with mineral elements existing in or supplemented to the croplands. Active weathering can release besides of Si even tin (Sn). Both of them have geographic associations with CHD, musculoskeletal diseases, and chemical associations with mucopolysaccharides (glycosaminoglycans, GAG) [29].
Conclusion
Regional CHD and Keto.(94-96) associated significantly with each other and factors associated with soil weathering. Milk Si can be associated with local weathering rate of silicates and is suggested to become one candidate for the measures of farm relating CO2 consumption.
Acknowledgement
I am grateful to Professor Osmo Hänninen and late veterinary surgeon Seppo Haaranen for several discussions.
References
- Gaillardet J, Dupre´ B, Louvat P, Allègre CJ (1999) Global silicate weathering and CO consumption rates deduced from the chemistry of large rivers. Chemical Geology 159(1-4): 3-30.
- Weathering.
- Orthosilicic acid.
- Price J, Velbel M (2014) Rates of Biotite Weathering, and Clay Mineral Transformation and Neoformation, Determined from Watershed Geochemical Mass-Balance Methods for the Coweeta Hydrologic Laboratory, Southern Blue Ridge Mountains, North Carolina, USA. Aquatic Geochemistry 20(2): 203-224.
- Herdt TH (2014) Overview of Ketosis in Cattle (Acetonemia, Ketonemia). MSD MANUAL, Veterinary Manual.
- Toysa T, Osmo Hanninen (2016) Soil Weathering, Silicon and CHD in Finland. JJ Agriculture 2(1): 008.
- Timo Töysä (2018) Regional Groundwater Hardness and Silicon, Cropland Fertility and CHD in Finland. Biomed J Sci & Tech Res.
- (1980) Statistical Yearbook of Finland 1980. Tilastokeskus 1981. Helsinki.(map of Finnish provinces down left on the page XXX).
- (1983) Farm register. Official Statistics of Finland, XLIII:4. Milk cows.10.2 Number of cattle on farms on 31 December 1983. 10.2 By provinces. National board of Agriculture, Helsinki 1986 pp. 122.
- (1995) Yearbook on Farm statistics SVT. Agriculture and Forestry 1995:5. Dairy cows. 2.2.1 Number of cattle by Rural Business District on 1.5.1995. Information Centre of the Ministry of Agriculture and Forestry. Helsinki p.79.
- (1997) Dairy cows, total, 1980-1996. Table 2.2.1. Number of cattle by Employment and Economic Development Centre on 1.5.1997 and in the whole country 1980-1997. Yearbook of Farm Statistics 1997. SVT Agriculture and Forestry 1997:5. Information Centre of the Ministry of Agriculture and Forestry. Helsinki 1997. Forestry.
- (1986) Dairy cows, total, at 15 June 1979. Table 2.2.1.1 Number of cattle by agricultural centre at 15 June 1983 and in the whole country in 1972-1983. Yearbook of Farm Statistics 1983. Official Statistics of Finland III:82. National Board of Agriculture. Helsinki.
- I-XI. Incidence of some animal diseases according monthly veterinary reports. (“Eräiden eläintautien esiintyminen Suomessa eläinlääkäreiden kuukausi-ilmoitusten mukaan”) [In Finnish]. December 1979, December 1981, December 1985, December 1989, December 1991, December 1992, December 1993, Year 1994, Year 1995, Year 1996. Ministry of Agriculture and Forestry.
- Valkonen T, Martikainen P (1990) Sepelvaltimotaudin väestöryhmittäinen kehitys Suomessa. Summary: Development of mortality from ischaemic heart disease in subgroups of the population in Finland. Sosiaalilääketieteellinen Aikakauslehti. Journal of Social Medicine 27: 273-288.
- Lahermo P, Tarvainen T, Hatakka T, Backman B, Juntunen R, et al. (2002) Tuhat kaivoa - Suomen kaivovesien fysikaalis-kemiallinen laatu vuonna 1999. Summary: One thousand wells - the physical-chemical quality of Finnish well waters in 1999. Geological Survey of Finland, Report of Investigation 155. Groundwater database of Geological Survey of Finland 2013 p. 92.
- Töysä T (2020) Regional Groundwater Si and Mg/Ca, Soil Mg/Ca, Soil-Types, Cardiac Diseases and Local Long-Term Dolomite Application - Soil Values from Two Periods Suggest on Different Roles of Mg and Si in Cardiac Epidemiology. Biomed J Sci & Tech Res.
- Eurofins Viljavuuspalvelu Oy. Liite_1.2. Eri maalajien keskimaarainen happamuus ja_86_90. xls 117.50 KB. (Attachment 1.2, Acidity, and mineral element contents by soil-types in Finnish Rural Centres 1986-1990).
- Jones A (2005) Soil Atlas of Europe, European Soil Bureau Network, European Commission.
- Toysa T, Hänninen O (2015) Agro-Geology and CHD in Finland. JJ Agriculture 1(2): 006.
- Ajayi AE, Horn R (2016) Comparing the potentials of clay and biochar in improving water retention and mechanical resilience of sandy soil. International Agrophysics 30(4): 391-399.
- Kurki M (1982) On fertility of Finnish croplands III [in Finnish”Suomen peltojen viljavuudesta III”]. Viljavuuspalvelu Oy. Helsinki. Pariset Oy ISBN 951-99399-0-3. p. 53.
- Broek JMM Van den, Marel HW van der (1959) Magnesium in Soils of Limburg. Part I. Magnesium supply to crops, yields, limiting values and manuring. Zeitschrift fuer Pflanzenehrnährung, Duengung, Bodenkunde, Verlag CHEMIE GMBH. Weinheim. pp. 244-253.
- Kähäri J, Nissinen H (1978) The Mineral element Contents of Timothy (Phleum pratense L) in Finland. Acta agr Scand Suppl 20: 26-39.
- Silva B, Paradelo R, Vázquez N, García Rodeja E, Barral MT (2012) Effect of the addition of granitic powder to an acidic soil from Galicia (NW Spain) in comparison with lime. Environmental earth sciences 68(2): 429-437.
- Töysa T (2018) Rainy Days, Geographic Coordinates, Vitamin D, Silicon, Selenium and CHD in Finland in 1962-2014. Biomed J Sci & Tech Res.
- Tikkanen M, Oksanen J (2002) Late Weichselian and Holocene shore displacement history of the Baltic Sea in Finland. Fennia International J of Geography 180: 1-2.
- Koele N, Hildebrand EE (2008) The ecological significance of the coarse soil fraction for Picea abies (L.) Karst. seedling nutrition. Plant and Soil 312: 163-174.
- Abuajamieh M, Kvidera SK, Fernandez MVS, Nayeri A, Upah NC, et al. (2016) Inflammatory biomarkers are associated with ketosis in periparturient Holstein cows. Research in veterinary science109: 81-85.
- Töysä T (2018) Regional associations of CHD and musculoskeletal morbidity with environmental and geographic factors – e.g. Ca, Mg, Si, Sn. Biomed J Sci & Tech Res.
- Haaranen S (1977) Observations on cattle pareses and ketoses during current indoor feeding period [in Finnish: ”Havaintoja lehmien halvaus- ja ketoosisairauksista kuluvana sisäruokintakautena.” Karjatalous 5: 36-37.
- Töysä E, veteranian surgeon, personal communication.
- Eurofins Viljavuuspalvelu Oy.
- Töysä T (2020) Discussion on Different Seasonal Variation of Serum Cholesterol in East and West Finland 1956-57 - Milk, Magnesium and Acid Soluble Silicon. Biomed J Sci & Tech Res.
- web: en.ilmatieteenlaitos.fi > “Climate” > “Statistics from 1961 onwards” > select: ”Maarianhamina” (provincial capital of Åland), ”Summer” and “Temperature” (or Precipitation). “Touching” of column 2018 gives temperature deviation : +2.1 °C above the normal (15.1 °C) [or Precipitation -46 % below the normal (167 mm)].
- web: ilmatieteenlaitos.fi > “Ilmasto” > “Vuositilastot” > “vuosi 2018” > ”Kesä” (summer) …(only in Finnish language) “rainfall was unusually low in the western half of the country” – [in Finnish: “oli tavanomaista vähäsateisempi maan länsipuoliskolla”].
- Schultz JE, French RJ (1976) Silicon uptake by wheat and its relation to grain yield and water use. Australian Journal of Experimental Agriculture and Animal Husbandry 16(78): 123-128.
