 Research Article
Abstract
In the Anthropocene, researchers are to pay special attention to heavy metal pollution associated with urban dust particles, amid overwhelming concerns that heavy metals might exert considerable impacts on ecosystem and human health. In this research, 60 street dust samples were taken from five different urban locations namely high, and low traffic streets, parks, residential, and industrial areas of Hamadan, Iran, as well as background city soils. The samples were analyzed for Zn, Cu, Pb, Mn, Cr and Co, using the atomic absorption spectrophotometric technique and ICP MS. Data showed that mean values for Zn, Cu, Pb, Mn, Cr, and Co in the dust samples were 189.9, 63.8, 63.0, 378.5, 33.0, and 19.8 mg Kg-1, respectively. The street dust samples were found to contain significant levels of Cu, compared to the background; however, their geo-accumulation indices (Igeo) suggested them to be uncontaminated with Zn, Pb, Mn, Cr and Co, and moderately contaminated with Cu. The Igeo values were in the following order: Cu >Pb, Zn>Mn>Cr>Co. The enrichment factor (EF) was estimated for all studied heavy metals by using Mn as the reference element. Except from Cu, the mean values of EF were less than 2 for other heavy metals. The values of EF were in the following order: Cu> Zn, Pb> Cr and Co. The pollution index (PI) suggested that dust particles were uncontaminated with Mn, Cr, and Co; moderately contaminated with Zn and Pb; but contaminated with Cu. The values of PI were in the following order: Cu > Zn >Pb>Mn> Cr andCo.
Introduction
In recent decades, characterized as the Anthropocene epoch,
much attention has been paid to heavy metal contamination with
dust particles in many parts of the world [1,2]. Dust chemicals vary
from elemental wastes to organic and inorganic compounds. Natural
and anthropogenic heavy metals comprise the most important
part of the dusts’ inorganic components [3,4]. Disproportionate
accumulation of heavy metals is a serious threat to living organisms.
They pollute the natural environment and enact toxic impacts on
living humans. Some heavy metals are essential for life; however,
it must be taken into consideration that at higher levels, they can
also impose some toxicological risk [4,6]. When studying urban
atmospheric pollution, identification of source and location of the
dust stands out as a high priority [7]. Hence, such studies should
determine origin, distribution, environmental damage and health
effects of the concerned heavy metals [8]. Dust storms with their
important impacts on human health have turned into a frequent
phenomenon of Iran’s weather system. Their adverse effects on
humans causing respiratory and cardiovascular diseases, and
infections, in one hand, and on the environment, reducing visibility,
creating agricultural losses, affecting the industry, and making
satellite imagery complications are well-known [9]. On global scale,
most of the dust particles come from arid and semiarid areas [10].
Recently, the amount of dust particles coming to Iran from Arabian
countries has been dramatically increasing. They have viciously
affected western and even central parts of Iran [11].
They are an important way of exposing people to heavy metals.
In recent years, the large amounts of atmospheric dust particles
have been depositing in many cities, crossing the western borders
of Iran. The most dominant winds of the country blow from
west to east. Therefore, as sources of Iran’s dust storms; mainly western adjacent countries must be blamed for [12]. Saeedi et al.
reported that although there is no confirmed origin, it is suspected
that most of the dust particles originate from the dry wetlands of
south eastern Iraq and the desserts of Iran’s western neighbors
[13]. The growth of population, industrial activities, and vehicles
in large cities are the other major causes of pollution in urban
environments. Road dust particle play as the leading path in terms
of subjecting people to the toxic elements [14]. Cities have become
source points of toxic chemicals from the unrestrained use of fossil
fuels. Urban people are the most affected and the traffic policemen
are the worst sufferers, because they are particularly close to
the fumes of automobile exhaust [15]. The complexity of dust
particles makes their characterization and source identification
difficult [16]. Dust particles could be introduced as an indicator of
heavy metal contamination from atmospheric deposition [17-20].
The close association of heavy metals with dust particles may be
enhanced in the presence of anthropogenic sources of heavy metals.
Depending on the population and economical activities, the level
of contamination in a city varies from place to place. The presence
of heavy metals in high concentrations in the environment lead to
health hazards such as its adverse effects on the nervous, blood
forming, renal, and reproductive systems. The toxicity of elements
such as Cu, Cd, and Zn, have been identified as being able to alter
the purpose of the human central nervous and respiratory system,
while also disturbing the endocrine [21].
Others include reduced intelligence, attention deficit, and
behavioral abnormality, as well as increased cardiovascular
diseases in adults [22]. Dust particles may also cause other kind
of problems such as reduced soil fertility, damage to crops and
reduced solar radiation [23]. While there are many published
studies on the concentration of heavy metals in street dust of major
cities in the developed countries; few research projects have been
conducted addressing the issue in smaller cities of developing
countries. Therefore, contamination and spatial distribution of
heavy metals associated with street dust particles has become a
major environmental issue in many western cities of Iran including
Hamedan. The main objective of this study; therefore, was to
determine the concentration of heavy metals (Zn, Cu, Pb, Mn, Cr
and Co) in street dust samples collected from different parts of
Hamedan city; and then examine their spatial distribution.
Materials and Methods
Study Area
Hamedan province (23° 59´ to 25° 45´ N and 47° 34´ to 49° 36´E) is located on the west of Iran, with surface area of 70 km2 and urban population of 548378 based on the 2011 census. The sampling points were determined using a GPS. In total, 60 samples of dust particles were collected from urban locations in Hamedan city with 5 different traffic characteristics including heavy and low traffic density, industrial areas, residential districts, parks and the background. The background sample is an undisturbed soil that is representative of the genetic characteristics of soils of that region. The sampling points are marked on the map shown in Figure 1.
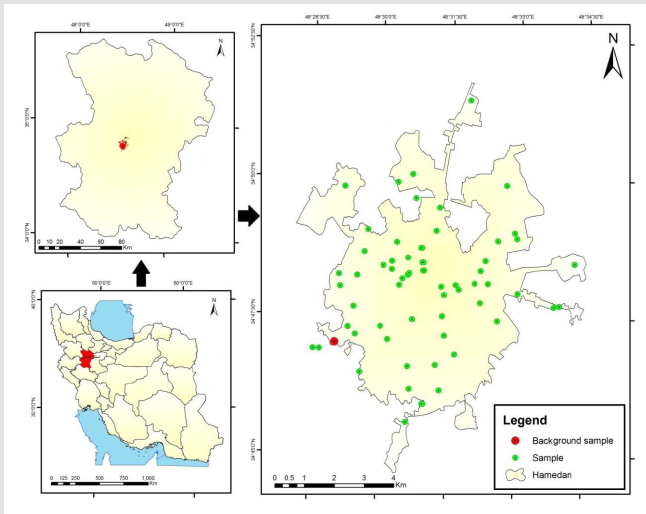
Figure 1: Location Map of the Studied Area Indicating Sampling Points in Hamedan City, Iran
Sample Collection
The street dust samples were collected and placed into polyethylene bags using a clean brush and dustpan. The sampling was conducted in May (prior to rainy season) to avoid heavy metals being washed out by rain. Each street dust sample was 300–700 g in mass and collected from a 1 m2 area which measured by a ruler. Then, the samples were transferred to soil science laboratory of Bu-Ali Sina university, Hamedan, Iran; and were dried at room temperature for 3 days. Later, they were sieved through a 1 mm stainless steel sieve.
Dust Analysis
At first, 0.6 grams from every sample was digested [24] with a mixture of perchloric, nitric, and sulfuric acid in proportion of 1:5:1 and heated at 215°C until white fumes given off and a creamy color appeared. Then, 10ml deionized water was added into each sample and heated at 100°C for 1 hour. The solutions were allowed to cool, then filtered and made up to 100 ml. Finally, the concentrations of Zn, Cu, Pb, Mn, Cr, and Co were determined using the atomic absorption spectrophotometric technique.
Contamination Assessment Methods
A number of calculation methods have been put forward for quantifying the degree of metal enrichment or pollution in dust particles [25]. In this study, geo-accumulation index (Igeo), enrichment factor (EF), and pollution index (PI) were calculated to assess the heavy metal contamination level in the road dust particles. However, the geo-accumulation index was originally used with bottom sediments [25]. It is also widely used to determine the pollution degree of heavy metals in dust particles and soil [26]. Igeo is computed by the following equation (eq. 1):
Igeo= log2[Cn/1.5Bn] eq. 1
Where Cn represents measured concentration of the element n in sampled street dust and Bn is geochemical background value of the element n in background sample. The geo-accumulation index is classified as shown in Table 1. The enrichment factor (EF) is used in studied samples to determine degree of metal contamination [27]. It was based on standardization of a determined element against a reference element. A reference element is often the one characterized by low occurrence variability such as Fe, Al, Ti, Mn, Sc, etc. [28-30]. The EF calculation is expressed below as eq.2:
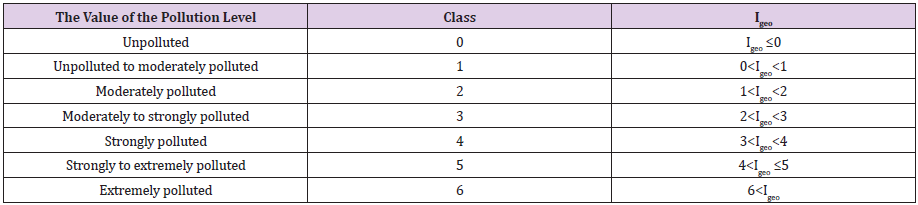
Table 1: Standard of Contamination Degree by Geo-Accumulation Index.
EF = |Cn(sample)/Cref(sample) | / |Bn(background)/Bref
(background)| eq.2
Where Cn demonstrates concentration of the examined
element in the dust sample; Bn stands for examined element for
the background value; Cref shows content of reference element for
normalization of the dust sample; and Bref delineates content of
reference element for normalization of the background. Therefore,
in this paper, the Mn was chosen as the reference element. Five
categories of pollution are shown as the following (Table 2). The
Pollution index (PI) was used to assess pollution degree and
environment quality in this study.
The PI is defined as eq.3:
PI= Cn/ Cref eq.3
Where Cn and Cref stand for the concentration of examined
element and the reference value, respectively (Table 3).

Table 2: Contamination Categories Based on EF Values.
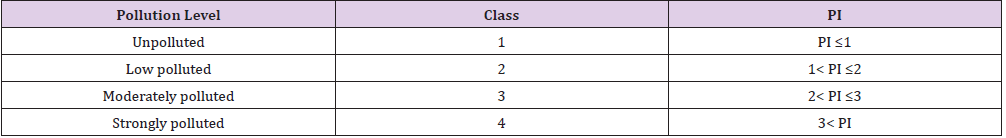
Table 3: Classification of PI Values.
Methods of Mapping Heavy Metal Concentrations
The spatial distribution maps of heavy metal concentrations were generated through the Inverse Distance Weighted (IDW) interpolating data from 60 street dust samples using Arc map software.
Results and Discussion
Heavy Metal Concentration
Concentrations of Zn, Cu, Pb, Mn, Cr, and Co were measured in all 60 street dust samples. Minimum and maximum concentrations, mean values, and standard deviations for each analyzed heavy metal as well as corresponding background values of the metals are presented in Table 4. The Zn concentration in the samples ranged from 85.7-333.3 mg kg−1 with an average concentration of 189.9 mg kg−1, which was higher than the average Zn concentration in the background (162.4 mg kg-1). The highest values of Zn were found in the heavy traffic and industrial areas,indicating that the Zn most commonly was coming from those locations.Faiz et al. also recorded that the concentration of Zn, compared to all of other studied elements, was manifested to be the highest. The average concentration of Cu in the street dust samples from Hamadan city was 63.8 mg kg-1with a range of 21.3–261.9 mg kg−1 (Table 4). The average concentration was greater than the background (15.16 mg kg-1). Industrial areas and parks, with the average of 86.7 and 49.3 mg kg-1,contained the highest and lowest content of copper in the studied area, respectively. Copper is an essential trace element that is widely distributed in the environment. Elemental Cu does not break down in the environment. The Cu can be found in plants and animals, in many foods and beverages, including drinking water [31].
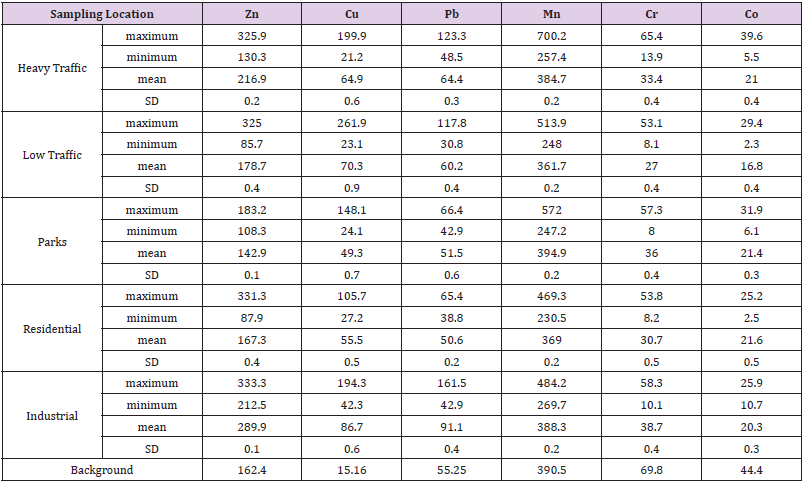
Table 4: Heavy Metal Concentrations (mg kg−1) in Dust Particles Collected from Hamedan City.
Shi and Wang reported that in their studied area, mean content of Cu particles was found to be almost 6 times higher than the background. Lu found the maximums Cu in the samples from heavy traffic sites, while their minimums were detected in dust samples from residential site with less traffic density. The source of Cu and Zn in street/road dust has been shown to betire abrasion, corrosion of metallic parts of cars, lubricants leakage, industrial and incinerator emissions [32].The Pb concentration of the dust samples fluctuated from 30.8-161.5 mg kg−1with an average concentration of 63 mg kg−1, which was higher than the background average (55.25 mg kg−1). The highest levels of Pb were found in the industrial locations showingthem as the most important sources of Pb in Hamadan city. It is believed that Pb is responsible for many negative effects on human bodies such as damaging kidneys, the nervous, and reproductive systems. It is also the element of most concern in environmental heavy metal pollution studies [32]. Wei et al.further observed that areas of high traffic density were associated with the highest levels of Pb.
The Mn concentration in the samples ranged from 230.5-700.2 mg kg−1with an average concentration of 378.5 mg kg−1, which was very close to Mn concentration in the background sample (390.5 mg kg−1). Many studies have manifested that raised concentration of Mn in road dusts were as a result of natural sources[33]. So, almost similar levels of Mn in the samples of different locations could endorsed that concentration of this metal in street dust from Hamadan city was influenced by natural sources.The average concentration of Cr in the street dust samples varied from 8–65.4 mg kg−1with an average of 33mg kg-1 (Table 4). The average concentration of Cr in dust samples was very much lower than the background sample (69.8 mg kg-1). The low levels of Cr in dust samples could suggest that the Cr in dust particle was also influenced by natural sources.
The Co concentration in the dust samples reached from 2.3-39.6 mg kg−1 with an average concentration of 19.8 mg kg−1, which was very much lower than the Co concentration in the background sample (44.4 mg kg-1). The low levels of Co in dust particle samples could imply that the Co was originated from natural sources.Findings showed that the mean concentrations of Zn, Cu and Pb, and Cu in particular, were much higher compared to their background values. This implied that such metals in dust particles from Hamedan city were impacted by anthropogenic sources. In contrast, the mean concentrations of Mn, Cr and Co were lower compared to their background values; this revealed that so-called metals in street dust from Hamedan City were induced by natural sources. Concentarations of As, Cd, Cu, Ni, Pb and Zn in a similar study in China exceeded the background values [34].
Spatial Distribution of Heavy Metals
The spatial distribution of metal concentrations is a useful method to assess the possible sources of enrichment, and to identify hot-spot areas with highest metal concentration. According to Burgos et al this form of spatial pattern supports the theory of reduction of heavy metal pollution caused by fine dust particles moving from West to East. For these elements, Wei et al observed relatively high spatial variability. Their hot-spot areas were mainly associated with main roads where high traffic density was identified. Such features suggested that the metals were probably due to vehicular emissions [34]. Distribution patterns of the studied elements in the whole area of Hamedan are represented in Figure 2. Similar patterns of spatial distribution were observed for Zn, Pb, and Cu. Their hot-spot areas were in North West and central parts of the city and mainly associated with industrial areas and main roads with high traffic density, which also suggested these metals, might be derived from industrial sources and vehicular emissions. The reason behind low concentrations of these metals in the West and South West areas of the city may be due to Abbas Abad mountains that act as a barrier against penetration of west winds. On the other hand, over population and high traffic density in central parts of city, could be blamed for high level of studied heavy metals in central parts of the city.
Mn, Cr, and Co also showed similar spatial distributions and had relatively high spatial variability. The mean concentration of Mn was very close to its background concentration while Cr and Co levels were lower than their backgrounds. These findings indicated that these three metals may not have been originated from anthropogenic sources. So, concentrations of Mn Cr, and Co in street dust samples are mainly attributed to natural sources. While it is theorized that heavy metal pollution reduces while fine dusts move from West to East, findings on these three heavy metals did not endorse this theory of reduction of heavy metal pollution. Levels of heavy metals found in the studied areas proved that sources of Mn, Cr and Co were natural and not anthropogenic.
Assessment of Pollution Level
Igeoof Heavy Metals: The calculated results of heavy metals' Igeoof Hamadan street dusts are presented in Table 5.The Igeo values for Zn, Cu, Pb, Mn, Cr, and Co ranged from -0.8 to 0.2, 0.9 to 2.3, -0.7 to 0, -0.7 to -0.6, -2.1 to -1.6, and -2.3 to -1.7; respectively, and with a mean value of -0.4, 1.4, -0.4, -0.6, -1.8, and -1.9. The mean values of Igeodecreased in the order of Cu>Pb, Zn>Mn>Cr>Co. The mean Igeo of Zn, Pb, Cr and Co were lower than zero-i.e unpolluted; while Cu with its mean Igeo ranging from 1 to 2, was classified as moderately polluted. The highest values of Igeo were observed in industrial areas followed by areas with heavy traffic density. In a similar study, Wei et al concluded that the main mean Igeo values ranged from 0 to 1 with Cr and Co as exceptions where their Igeo values were less than 0, indicating that road dust in the studied area was between uncontaminated and contaminated. A particularly high Igeo valuefor Cu at 2.3 suggested that the Cu in street dust sampleswere most notably affected by anthropogenic sources, originating primarily from traffic and industrial activities.
Enrichment Factor of Heavy Metals: The EF results from Hamedan street dusts are shown in table 5. The Mn was chosen as reference element in the studied areas. Frequently, Fe, Al, Li, and Mn are also used as reference metals. As an alternative, any other metal found to have little to no anthropogenic sources in the area may be used [35]. The EFs of Zn, Cu, Pb, Cr, and Co varied from 0.9-1.8, 2.3-5.8, 1-1.3, 0.4-0.5, and 0.4-0.5; correspondingly, with an average of 1.3, 4.4, 1.3, 0.5, and 0.5. Shi and Wang who used Mn as the reference element found Cu as the most polluted element in road dust particles (Table 6). The order of EF values was as the following: Cu >Zn, Pb> Cr, Co, similar to the Igeo order, which could also be interpreted as decreasing order of their overall contamination of street dusts from Hamedan city. The anthropogenic pollution is clearly identified when the maximum EF of each heavy metal is larger than 3. The mean EF of Cu was higher than 2, while the mean EF of Zn, Pb, Cr, and Co were less than 2. These findings showed that Cu in street dusts of Hamedan city was the main pollutant, and largely originated from anthropogenic sources.
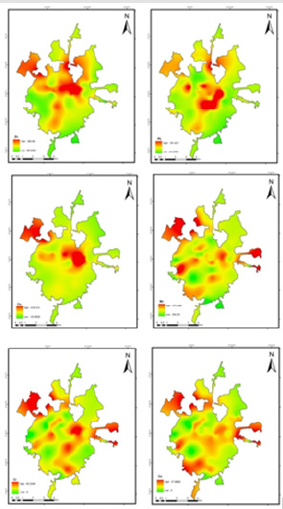
Figure 2: Spatial Distribution of the Concentrations of Heavy Metals in Hamedan.
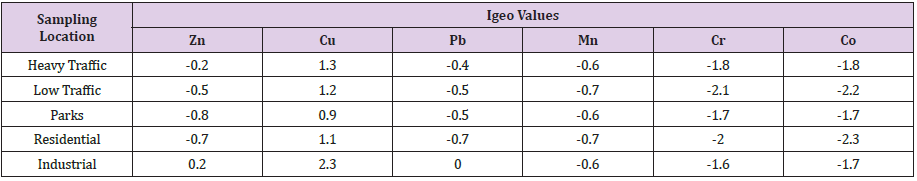
Table 5: Igeo for Heavy Metals in Street Dusts of Hamedan City.
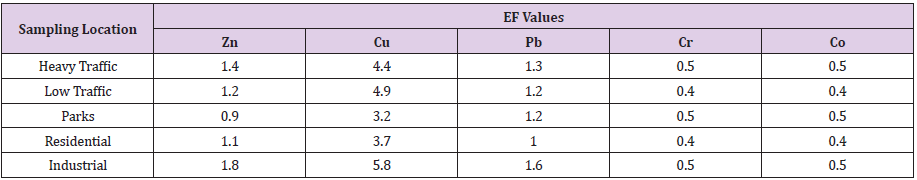
Table 6: EF for Heavy Metals in Street Dusts of Hamedan City.
Pollution Index of Heavy Metals: The PI of Zn, Cu, Pb, Mn, Cr, and Co fluctuated from 0.9-1.8, 3.2-5.7, 0.9-1.6, 0.9-1, 0.4-0.6, and 0.4-0.5, with the mean values of 1.2, 4.3, 1.1, 1, 0.5, and 0.5, respectively. The order of PI values was: Cu > Zn >Pb>Mn>Cr, Co .According to the PI values,at first, Mn, Cr, and Co were classified as unpolluted. Then, Zn and Pb were labeled as low polluted. Finally, Cu was found to be strongly polluted with highest level of pollution in the studied area. Faiz et al. discovered similar results illustrating that the overall pollution levels for all the elements, while employing this parameter, were correlated to the middle level except for the Cu that was found to be in the high-level range (Table 7).
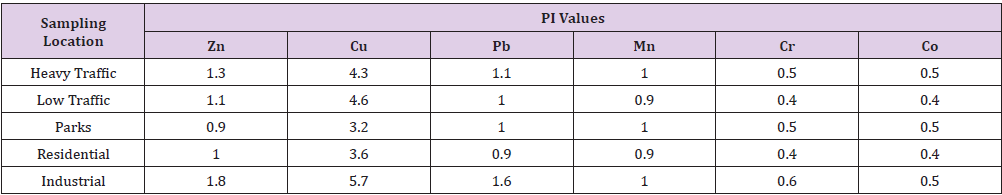
Table 7: PI Values of Heavy Metals in Street Dusts of Hamedan City.
Conclusion
The concentrations and contamination levels of Zn, Cu, Pb, Mn, Cr, and Co were studied in street dust collected from Hamadan city, Iran with three contamination assessment methods. The mean values for Zn, Cu, Pb, Mn, Cr, and Co in the dust samples were 189.9, 63.8, 63, 378.5, 33, and 19.8 mg.Kg-1respectively. Results showed that the mean concentrations of Zn, Cu and Pb were much higher than their background values. In contrast, the mean concentrations of Mn, Cr and Co were lower compared to their background values.Similar patterns of spatial distribution were observed for Zn, Pb and Cu. Their hot-spot areas were in North West and central parts of the city, while Mn, Cr and Co also showed similar spatial distributions and had relatively high spatial variability.The values of Igeo were in the following order: Cu >Pb, Zn>Mn>Cr>Co. The results ofIgeo showed that dust particles in Hamadan city were uncontaminated regarding Zn, Pb, Mn, Cr, and Co; however moderately contaminated with Cu. Except for Cu, the order for some other elements is in harmony with findings. The values of EF were in the following order: Cu > Zn, Pb> Cr, Co. The EF values showed that dust particles in Hamadan city were uncontaminated regarding Zn, Pb, Cr, and Co while moderately contaminated with Cu. The values of PI were in the following order: Cu > Zn >Pb>Mn> Cr, Co. These values of PI showed that dust particles in Hamadan city were uncontaminated regarding Mn, Cr, and Co, nevertheless moderately contaminated with Zn and Pb and of course contaminated with Cu.
The high values of Igeo, EF and PI for Cu in the sampled street dusts indicated that there was a considerable Cu pollution, which mainly originated from traffic and industry activities. The Igeo, EF and PI of other studied heavy metals were low and revealed low levels of these heavy metals' pollution in street dusts from studied area.These findings stressed on the fact that more attention should be paid on heavy metal contamination in the street dusts of the city, especially on the Cu. Some protective measures such as encouraging use of public transport; replacing liquid fossil fuels with gaseous fuel, and planting more green areas are suggested to combat the problem.
References
- Al Khashman, OA (2004) Heavy metal distribution in dust, street dustand soils from the workplace in Karak Industrial Estate. Jordan Atmospheric Environment 38(39): 6803-6812.
- Ashrafi KH, Shafiepour M, Aslemand A, Sarmad GH (2014) Dust stormsimulation over Iran using HYSPLIT. Journal of Environmental Health Science and Engineering 336: 9-21.
- Basart S, Vendrell L, Baldasano JM (2016) High-resolution dust modelling over complex terrains in West Asia. Aeolian Research 23: 37- 50.
- Burgos P, Madejón M, Pérez de Mora A, Cabrera F (2008) Horizontal and vertical variability of soil properties in a trace element contaminated area. International Journal of Applied Earth Observation and Geoinformation 10(1): 11-25.
- Charlesworth S, Everett M, McCarthy, R Ordonez, A De Miguell (2003) A comparative study of heavy metal concentration and distribution in deposited street dusts in a large and a small urban area: Birmingham and Coventry, West Midlands, UK.Environment International 29(5): 563–573.
- Christoforidis A, Stamatis N (2009) Heavy metal contamination in street dust and roadside soil along the major national road in Kavala's region, Greece. Geoderma 151(3-4): 257-263.
- Faiz A, Tufail M, TayyebJaved M, Chaudhry MM, Siddique N (2009) Road dust pollution of Cd, Cu, Ni, Pb and Zn along Islamabad Expressway, Pakistan. Microchemical Journal 92(2): 186-192.
- Ferreira Baptista L, Miguel E De (2005) Geochemistry and risk assessment of street dustin Luanda, Angola: a tropical urban environment. Atmospheric Environment 39: 4501-4512.
- Gerivani H, Lashkaripour G, Ghafoori M, Jalali N (2011) The source of dust storm in Iran: a case study based on geological information and rainfall data. Carpathian Journal of Earth and Environmental Sciences, 6(1): 297-308.
- Gordeev VV, Rachold V, Vlasova IE (2004) Geochemical behavior of major and trace elements in suspended particulate material of the Irtysh River, the main tributary of the OB River, Siberia. Applied Geochemistry 19(4): 593-610.
- Han X, Lu X, Zhang Q, Hai Q, Pan H (2016) Grain-size distribution and contamination characteristics of heavy metal in street dust of Baotou, China. Environmental Earth Sciences 75(6): 1-10.
- Han YM, Du PX, Cao JJ, Posmentier ES (2006) Multivariate analysisof heavy metal contamination in urban dusts of Xian, CentralChina.Science of the total environment 355(1-3):176-186.
- Hojati S, Khademi H, Faz Cano A, Landi A (2012)Characteristics of dust deposited along a transect between central Iran and the Zagros Mountains. Catena 88(1): 27-36.
- Jiries AG, Hussein HH, Halaseh Z (2001)The quality of water andsediments of street runoff in Amman, Jordan.Hydrological Process 15(5):815-824.
- Li X, Zhang S, Yang M (2014) Accumulation and risk assessment of heavy metals in dust in main living areas of Guiyang City, Southwest China. Chinese Journal of Geochemistry. 33: 272-276.
- Li J, Lu Y, Yin W, Gan H, Zhang C(2009) Distribution of heavy metals in agricultural soils near a petrochemical complex in Guangzhou, China. Environmental monitoring and assessment 153: 365-375.
- Lu X, Wang L, Li LY, Lei K, Huang L (2010) Multivariate statistical analysis of heavy metals in street dust of Baoji, NW China. Journal of Hazardous Materials. 173(1-3): 744-749.
- Lu X, Wang L, Lei K, Huang J, Zhai Y (2008) Contamination assessment of copper, lead, zinc, manganese and nickel in street dust of Baoji, NW China. Journal of Hazardous Materials 161(2-3): 1058-1062.
- Maa, Singhirunnusorn W (2012) Distribution and Health Risk assessment of heavy metals in surface dusts of MahaSarakham municipality. Procediasocial and behavioral sciences 50: 280-293.
- Mafuyai GM, Kamoh NM, Kangpe NS, Ayuba SM, Eneji IS (2015)Heavy metals contamination in roadside dust along major traffic roads in Jos metropolitan area, Nigeria. Journal of Environment and Earth Science5(5): 48-57.
- Mafuyai GM, Eneji IS, Shaato R (2014) Concentration of Heavy Metals in Respirable Dust in Jos Metropolitan Area, Nigeria. Open Journal of Air Pollution 3(1): 10-19.
- Meena M, Meena BS, Chandrawat U, Rani A (2014) Seasonal Variations and Sources of Heavy Metals in Free Fall Dust in an Industrial City of Western India. Iranica Journal of Energy & Environment 5(2): 160-
- Norouzi S, Khademi H (2015) Source identification of heavy metals in atmospheric dust using platanusorientalis L. leaves as bioindicator. Eurasian Journal of Soil Science 4(3): 144-152.
- Norouzi S, Khademi H, Cano AF, Acosta JA (2016) Biomagnetic monitoring of heavy metals contamination in deposited atmospheric dust, a case study from Isfahan, Iran. Journal of Environmental Management 173: 55-64.
- Raj SHP, NeenaK, Bir Singh SK, Kumari WK, Mahesh SH (2014) Determination of Heavy metals in Street Dust from Different Types of Land Use of Kathmandu Valley, Nepal.Research journal of chemical sciences 4(7): 82-92.
- Reimann C, Caritat P (2000) Intrinsic flaws of element enrichment factors (EFs) in environmental geochemistry. International journal of energy and environment34:5084-5091.
- Rezazadeh M, Irannejad P, Shao Y (2013) Climatology of the Middle East dust events. Aeolian Research. 10: 103-109.
- Saeedi M, Li LY, Salmanzadeh M (2012)Heavy metals and polycyclic aromatic hydrocarbons: Pollution and ecological risk assessment in street dust of Tehran.Journal of HazardousMaterials 9: 227-228.
- Sammut ML, Noack Y, Rose J, Hazemann JL, Proux O(2010) Speciation of Cd and Pb in dust emitted from sinter plant. Chemosphere 78: 445-450.
- Sezgin N,Ozcan HK, Demir G,Nemlioglu S,Bayat C (2003)Determination of heavy metalconcentrations in street dusts in Istanbul E-5 highway.Environment International 29(7): 979-985.
- Shao Y (2008) Physics and Modeling of Wind Erosion.Berlin of Germany, Springer Press pp. 172-174.
- Shi X, Wang J (2013)Comparison of different methods for assessing heavy metal contamination in street dust of Xianyang City, NW China.Environmental Earth Sciences 68(8):2409-2415.
- Tam NFY, Yao MWY (1998) Normalization and heavy metal contamination in Mangrove Sediments. Science of the Total Environment 216(1-2):33-39.
- Wang X, Qin Y (2007)Some characteristics of the distribution of heavy metals in urban topsoil of Xuzhou, China.Environmental Geochemistry and Health 29: 11-19.
- Wei B, Jiang F, Li X, Mu Sh (2009) Spatial distribution and contamination assessment of heavy metals in urban roaddusts from Urumqi, NW China.Microchemical Journal 93(2): 147-152.
