 Research Article
Abstract
Background: In patients with intracranial injuries the application of brain atlas technique is not evident in post-processing of MR images, since anatomical parts of the brain are shifted due to the mass effect of the lesion or the treatment-induced structural distortions. Therefore, the alignment of grey and white matter structures to atlas templates around the altered areas can only be predicted to be moderately precise. The quantitative characterization of the distortion effects can help the optimization of spatial alignment.
Objective: We aimed to characterize the accuracy of spatial normalization of T1-weighted MR images of 38 patients in three patient groups and 15 control subjects.
Methods: The accuracy of fitting was measured by the spatial variability in the atlas space of 12 predefined regions drawn on the patient images. The reference regions can be divided into two groups: volumetric regions (e.g. caudate nucleus, central sulcus) and point-based markers (e.g. anterior commissure, anterior point of corpus callosum). Five software has been used for the spatial standardization: SPM8, SPM12, DARTEL, FSL and MNI Tools. An integrated parameter has been constructed to examine the accuracy of the investigated spatial standardization methods. The relative volume and the Jaccard index metrics were used for the distance measurements of landmarks in the case of volumetric regions, at the point-based markers, the distance of reference points was used. The statistical comparison of the evaluated measurements helps to optimize the standardization pipeline for structural images of patients with tumors.
Results: The results of this research also may help in more accurate and personalized planning and can define newly developed biomarkers for further clinical and research goals.
Conclusions: We have a method for optimizing a brain atlas technique for clinical applications. This method is a good method because it provides scalable, usable parameters.
Keywords: Brain Atlas; Intracranial Space-Occupying Lesions; Spatial Normalization; Goodness of Fitting
Introduction
The application of brain atlas technique is not evident in the post-processing of MR images in patients with intracranial spaceoccupying lesions since brain structures are shifted due to the mass effect of the lesion or the treatment-induced structural distortions [1,2]. Therefore, the fitting of grey and white matter structures to atlas templates around the affected areas can only be expected to be partially accurate [3,4]. A typical demonstration of misalignment errors of spatial normalized T1-weighted MR images of tumorous patients can be seen in Figure 1. These misalignment errors are visible on the axial slice the area of the frontal lobe in the right side and around the lateral ventricles. Much publications and research groups studied the normalization problems of lesioned brains. Brett et al. [5] implemented cost function masking (CFM) using a “mask image” in which the voxel value 1 denotes the excluded area (masking technique), which seems to be a simple solution, but the applicability these types of mask images are not trivial. Cuadra et al. [6] examined the spatial normalization of MR images in patients with brain tumors in a common stereotactic space. They used brain atlases to pool data from different patients into a common space to perform group analyses. The transfer of atlas-based structural and functional information into the individual patient’s space can be achieved via the inverse mapping, to segment brain areas and facilitate surgical or radiotherapy treatment planning.
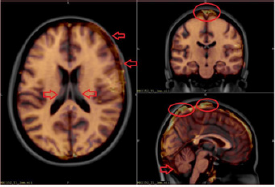
Figure 1: Misalignment of spatial normalized T1-weighted MR images of tumorous patients. The red arrows and circles illustrate in which areas were the fitting difference greater.
Bug et al. [7] created an image-based query system that can retrieve imagery based on anatomical location. The system accepts slide images as input and yields a matrix of transformation parameters that map each point on the input image to a standardized 3D brain atlas. Napadov et al. [8] have devised a two-stage automated, and reference mask guided registration technique (Automated Brainstem Co-registration, or ABC) for improved brainstem co-registration. Their approach utilizes a brainstem mask dataset to weight an automated co-registration cost function. Crinion et al. [9] examined different normalizations available in Statistical Parametric Mapping (SPM) and the effect of CFM. They concluded that the unified segmentation with CFM provides high accuracy of the fitting of damaged brains. The main difference between our study and the studies described is that the same image processing pipeline was used for tumorous patients and healthy subjects. Accordingly, our goal was to extend the spatial normalization procedure with a data-driven option: if the automated image processing script found a tumor mask, the script 3 will use this mask, so in this case, a “mask-based normalization” will run; otherwise, the spatial normalization parameters will be calculated in a “normal way” (i.e. developed for healthy subject).
In this study, we measured the accuracy of fitting by the spatial variability in the atlas space of 12 predefined anatomical regions and three types of tumor masks drawn on the images of patients and healthy controls by a radiographer. We divided the labels into two groups: volumetric regions (e.g. caudate nucleus, central sulcus) and point-based markers (e.g. anterior commissure, most rostral point of corpus callosum). We used five software for the spatial standardization procedure: SPM8, SPM12, DARTEL, FSL and MNI Tools. An integrated parameter has been constructed to examine the accuracy of the investigated spatial standardization methods and to compare the accuracy of delineations. In the case of volumetric regions for the distance measurements of landmarks we used the relative volume and the Jaccard index metrics, and for the point-based markers we applied the distance of reference points.
Materials and Methods
Subjects/Data
3D post-contrast MRI data from eight stroke patients were obtained from a therapeutic study [10], 3D post-contrast MRI data of 15 patients with meningioma, 15 patients with multiple metastases and 15 control subjects. A total of 53 patients’ data was used in this study.
Image Acquisition
Images were acquired at two scanners in the two diagnostic radiological centers of the University of Debrecen. Kenézy Hospital, Debrecen using a 1.5Tesla Siemens Magnetom Essenza magnetic resonance scanner. A 3D T1-weighted axial magnetizationprepared rapid acquisition with gradient echo (MP-RAGE) structural image was obtained (echo time (TE)=4.73ms, repetition time (TR)=1540ms, inversion time (TI)=800ms, flip angle=15 slices with 0.9×0.9×0.9mm voxels). The University of Debrecen earlier used a 1.5Tesla GE Signa Excite magnetic resonance scanner. A 3D T1-weighted axial image was obtained (echo time (TE)=7ms, repetition time (TR)=30 ms, inversion time (TI)=0ms, flip angle=45 slices with 0.68×0.68×1.1mm voxels).
Definition of the System of the Anatomical Reference Regions and Manual Segmentation
We defined 12 points and placed them within the intracranial space that matched easily recognizable but crucial anatomical landmarks that are commonly found adjacent to treatment sites or eloquent cortical areas. We saved the 12 anatomical regions as 12 different labels. The delineation of the reference regions aimed to measure the goodness of fitting the T1-weighted MR images into the atlas space. Therefore, reference regions were marked both on the native T1-weighted MR images and in atlas space by a radiographer. After the spatial normalization procedure, the reference regions were drawn in native space transformed into the atlas space. Differences between the spatial position and shapes of the transformed reference regions and the appropriate region in atlas space could be measured. We divided the reference regions into two groups, volumetric regions and point-based markers. Volumetric regions are caudate nucleus (left, right), putamen (left, right) and central sulcus (left, right) (Figure 2A/B); point-based markers are anterior commissure, posterior commissure, most rostral and most occipital points of corpus callosum, two endpoints of the horizontal line which placed on the optic chiasma and connected the temporal lobes in the axial plane (left, right) (Figure 3A/B). We delineated the caudate nucleus from the anterior horn of the lateral ventricle to the amygdala in axial plane (Figure 2A/B).
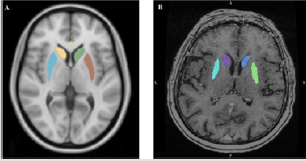
Figure 2: An example of volumetric regions. (A) Putamen and caudate nucleus in MNI152 space. (B) Putamen and caudate nucleus in native space.
Delineation of Tumor Masks
Tumor and surroundings affect the process of spatial standardization; therefore, tumor masks were needed.
Among the investigated cases, tumor boundaries were welldefined due to contrast enhancement. Not only the tumor had to be delineated, but the areas spoil the spatial standardization, e.g. edema, necrosis. It is called tumor mask for simplicity.
a) Method 1: precise tumor mask (tumor mask 1, Figure 4/A). Freehand drawing was used for the delineation of the tumor and the affected edematous tissues in every slice.
b) Method 2: raw drawing by polygon (tumor mask 2, Figure 4/B). Delineating the tumor and the surroundings with a polygon in every fifth slices.
c) Method 3: drawing with spheres (tumor mask 3, Figure 4/C). The tumor and the affected tissues were covered with spheres which had different diameters.
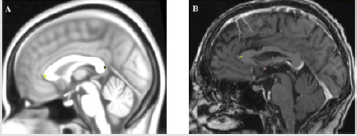
Figure 3: An example of point-based markers. (A) Anterior and posterior commissure, most rostral and most occipital points of corpus callosum in MNI152 space. (B) Anterior and posterior commissure, most rostral point of corpus callosum in native space.
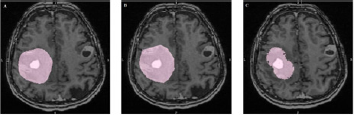
Figure 4: Tumor drawing methods. (A) Tumor mask 1 - precise drawing in patient with multiple metastases (B) Tumor mask 2 - raw drawing by polygon in patient with multiple metastases (C) Tumor mask 3 - drawing with spheres in patient with multiple metastases.
Spatial Normalization Procedures
For normalization we used five software: Statistical Parametric Mapping (SPM)8, SPM12 [11], Diffeomorphic Anatomical Registration Tool Through Exponentiated Lie Algebra (DARTEL) [12], FMRIB Software Library (FSL) [13] and Montreal Neurological Institute software (MINCtools) [14].
Comparison of Label Transformation
All warped regions had to compare with the reference regions delineated in the MNI152 space.
a) In the case of volumetric regions, we applied for comparison the relative volume:
Where the Vtrans means the volume of transformed label measured in atlas space and the Vatl means the similar label delineated in atlas space.
b) The second metric we used was the Jaccard index: Where Rtrans the binary mask of transformed label in atlas space and Ratl the binary mask of the same label delineated in atlas space. Hence the Jaccard index measures the binary mask similarity the transformed label with the delineated label in atlas space.
c) In the case of the point-based markers we used the distance of reference point:
Where the Ptrans means the MNI coordinates of transformed point-based marker and the Patl the same label delineated in atlas space.
Statistical Analysis
For the statistical investigation of the misalignment of reference region system we applied the R software.
For the first task, different kind of figures must be examined to show the distributions of the calculated region distances. For the second task, depending on the normality of the distribution of the calculated region distance metric (i.e. Jaccard distance [15]), parametric or non-parametric one-way ANOVA method was applied. For non-normal case, the Kruskal-Wallis test [16] implemented in coin package was used. For the multiple corrections, post-hoc Tukey test [17] implemented in “ls means” package was applied, which characterize by Student-t values how the different masking method reduced the misalignment of a given region. In this way accordingly, for the 12 reference regions, 12 Student-t parameters generated for each of the masking methods. Using these Student-t parameters, we selected the best method(s) for the investigated spatial normalization procedure.
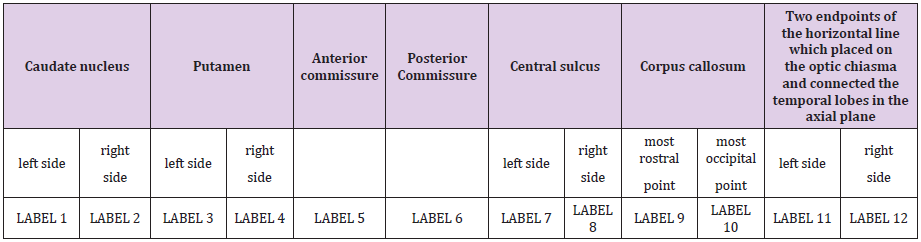
Table 1: Shows the anatomical reference points (landmarks).
Results
Our results showed that the most accurate standardization methods are FSL and SPM12 with default settings based on the processing of the data of 53 persons (Figures 5-8). The applicability of tumor masks in the warping part of the spatial normalization procedure could not reduce the misalignment of reference regions transformed into the atlas space (Figure 9). We have a tool for finetuning each method: the effect of changing linear and non-linear parameters becomes measurable with our method described.
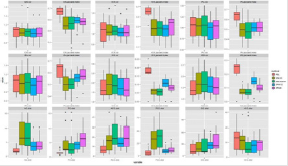
Figure 5: The applied software for normalization in the healthy control group. In one panel we show a distance-metric (vol, Jaccard index, dist) calculated by the transformed label and its reference label in the case of different transformation methods. In the first 2 rows we show the panels of volumetric labels’ distance characteristics measured by relative volume (vol) and Jaccard index. In the bottom row the six point-based labels and reference label distance are shown.
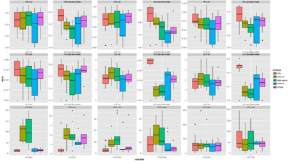
Figure 6: The applied software for normalization in the stroke group. In one panel we show a distance-metric (vol, Jaccard index, dist) calculated by the transformed label and its reference label in the case of different transformation methods. In the first 2 rows we show the panels of volumetric labels’ distance characteristics 8 measured by relative volume (vol) and Jaccard index. In the bottom row the six point-based labels and reference label distance are shown.

Figure 7: The applied software for normalization in the multiplex metastases group. In one panel we show a distance-metric (vol, Jaccard index, dist) calculated by the transformed label and its reference label in the case of different transformation methods. In the first 2 rows we show the panels of volumetric labels’ distance characteristics measured by relative volume (vol) and Jaccard index. In the bottom row the six point-based labels and reference label distance are shown.
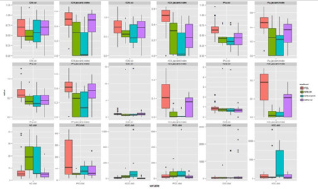
Figure 8: The applied software for normalization in meningioma group. In one panel we show a distance-metric (vol, Jaccard index, dist) calculated by the transformed label and its reference label in the case of different transformation methods. In the first 2 rows we show the panels of volumetric labels’ distance characteristics measured by relative volume (vol) and Jaccard index. In the bottom row the six point-based labels and reference label distance are shown.
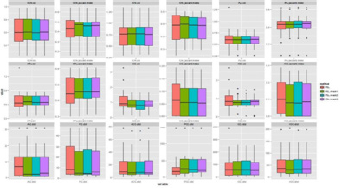
Figure 9: The Jaccard index of FSL software and the three-type of masks. In one panel we show a distance-metric (vol, Jaccard index, dist) calculated by the transformed label and its reference label in the case of different transformation methods. In the first 2 rows we show the panels of volumetric labels’ distance characteristics measured by relative volume (vol) and Jaccard index. In the bottom row the six point-based labels and reference label distance are shown.
Discussion and Conclusion
The measurement of the accuracy of the spatial normalization procedure is one of the most intensively examined multimodal image processing problems. In the case of the images of healthy subjects, a huge number of working groups described methods and metrics to measure the goodness of a dedicated algorithm or software used for spatial normalization [9,18-20] but only a few papers could be found which compare different methods [21]. They described two types of measurement technique: voxel-level similarity and landmark or reference region-based similarity measurement. The former use of any monotonic function (named similarity function) which evaluate a real number (scaled to [0,1], or non-scaled) from the template image and the transformed subject image that way the larger number represents the best anatomically alignment of investigated images. Two commonly used similarity functions are the voxelwise calculated cross-correlation and mutual information [22]. The landmark or reference region-based similarity measurement based on predefined - usually manually delineated - anatomical regions or segmented regions. In both cases, the reference regions must be defined on the original images of subjects and the atlas template, as well. During the spatial normalization procedure, the reference regions are transformed into the atlas space by the very same transformation used on images. The transformed reference regions are utilized to characterize the accuracy of spatial normalization since an arbitrary 3D spatial distance metric which measures two 3D object distances can be used to evaluate the distance between the transformed regions and the regions drawn in atlas space [23,24]. Thanks to some freely available software (MNI tools, SPMs, FSL, etc.) the brain atlas technique became available worldwide for neuroimaging researchers who have adopted more and more complex techniques to infer 10 the most of their datasets. The mains of these techniques are the brain activation studies, brain morphometry and fiber tracking [25, 26]. Nevertheless, the abovementioned brain-atlas based image processing techniques have applied successfully in a huge number of studies. The application of these methods is not available for researchers those want to investigate patients’ data with space-occupying lesions. The main limitation is simple technical: the accuracy of spatial normalization algorithms is not acceptable in space-occupying/tumorous cases.
According to the aims of this study, a complex system was developed which contain an image database and software to make it possible to analyze the efficiency of spatial normalization method for stroke patients. In the software, the reference regionbased distance metric method was adopted, and so the calculation was based on manually drawn regions. The regions were drawn in native (original) space represented by subject’s T1-weighted MR images and in the MNI152 atlas space represented by template image, as well. Thirteen regions have been determined for drawing: caudate nucleus (left, right), putamen (left, right), anterior and posterior commissure, central sulcus (left, right), most rostral and most occipital point of the corpus callosum, and two endpoints of the horizontal line which placed on the optic chiasma and connected the temporal lobes in the axial plane (left, right). The main challenge of this work was the definition and delineation of the reference regions in 3D. To solve this problem, a huge number of T1-weighted images were investigated to find which regions can be found effortlessly. After the appropriate software selection (Slicer 3D) stroke patient group was selected containing eight subjects. Using the T1-weighted images of the subjects, the reference regions had been drawn and combined with the images were stored into a dedicated image-database. The developed software was modified to automatically work on this database and create spatial normalized reference regions. The statistical scripts of the software system currently use Jaccard index to calculate the difference between the transformed and atlas regions. For the statistical inference, the software produced two types of plots organized by patient groups and regions: whiskers plots of the evaluated distance distributions and distance metric changing relative to the spatial normalization.
The main purposes of this study have been completed, and the spatial normalization accuracy measuring framework has been developed and tested. There are two strong points of this work: the extensible image database and the modular and scalable software. It is planning to extend the image database by adding more subjects and patient groups. We used 5 distance metrics to measure the fitting accuracy as closely as possible and we applied 5 spatial normalization software from which we could select those that gave the best results according to our research goals. In summary we have a method for optimizing a brain atlas technique for clinical applications and it provides scalable, usable parameters.
Acknowledgement
The study was supported by the National Brain Research Program (“Charting the normal and pathological macro-scale brain connectome by in vivo neuroimaging”, KTIA_13_NAP- A-II/3).
References
- Andersen SM, Rapcsak SZ, Beeson PM (2010) Cost function masking during normalization of brains with focal lesions: still a necessity? Neuroimage 53(1): 78-84.
- Mohamed A, Zacharaki EI, Shen D, Davatzikos C (2006) Deformable registration of brain tumor images via a statistical model of tumor-induced deformation. Medical Image Analysis 10(5): 752-763.
- Dawant BM, Hartmann SL, Pan S, Gadamsetty S (2002) Brain atlas deformation in the presence of small and large space-occupying tumors. Computer Aided Surgery 7(1): 1-10.
- Xue Z, Shen D, Karacali B, Stern J, Rottenberg D, et al. (2006) Simulating deformations of MR brain images for validation of atlas-based segmentation and registration algorithms. Neuroimage 33(3): 855-866.
- Brett M, Leff AP, Rorden C, Ashburner J (2001) Spatial normalization of brain images with focal lesions using cost function masking. Neuroimage 14(2): 486-500.
- Cuadra MB, Pollo C, Bardera A, Cuisenaire O, Villemure JG, et al. (2004) Atlas-based segmentation of pathological MR brain images using a model of lesion growth. IEEE Transactions on Medical Imaging 23(10): 1301-1314.
- Bug W, Gustafson C, Shahar A, Gefen S, Fan Y, et al. (2007) Brain spatial normalization. Methods in Molecular Biology 401: 211-234.
- Napadow V, Dhond R, Kennedy D, Hui KK, Makris N (2006) Automated brainstem coregistration (ABC) for MRI. Neuroimage 32(3): 1113-1119.
- Crinion J, Ashburner J, Leff A, Brett M, Price C, et al. (2007) Spatial normalization of lesioned brains: Performance evaluation and impact on fMRI analyses. Neuroimage 37(3): 866-875.
- Vér C, Emri M, Spisák T, Berényi E, Kovács K, et al. (2016) The Effect of Passive Movement for Paretic Ankle-Foot and Brain Activity in Post-Stroke Patients. European Neurology 76(3-4): 132-142.
- Friston KJ, Jezzard P, Turner R (1994) Analysis of functional MRI time-series. Human Brain Mapping 1(2): 153-171.
- Ashburner J (2007) A fast diffeomorphic image registration algorithm. Neuroimage 38(1): 95-113.
- Jenkinson M, Beckmann CF, Behrens TE, Woolrich MW, Smith SM (2012) FSL. Neuroimage 62(2): 782-790.
- Collins DL, Neelin P, Peters TM, Evans AC (1994) Automatic 3D intersubject registration of MR volumetric data in standardized Talairach space. Journal of Computer Assisted Tomography 18(2): 192-205.
- Niwattanakul S, Singthongchai J, Naenudorn E, Wanapu S (2013) Using of Jaccard Coefficient for Keywords Similarity. Proceedings of the International MultiConference of Engineers and Computer Scientists 1.
- Theodorsson-Norheim E (1986) Kruskal-Wallis test: BASIC computer program to perform non-parametric one-way analysis of variance and multiple comparisons on ranks of several independent samples. Computer Methods Programs in Biomedicine 23(1): 57-62.
- Rice WR (1989) Analyzing tables of statistical tests. Evolution 43(1): 223-225.
- Smith SM, Zhang Y, Jenkinson M, Chen J, Matthews PM, et al. (2002) Accurate, Robust, and Automated Longitudinal and Cross-Sectional Brain Change Analysis. Neuroimage 17(1): 479-489.
- Crivello F, Schormann T, Tzourio-Mazoyer N, Roland PE, Zilles K, et al. (2002) Comparison of spatial normalization procedures and their impact on functional maps. Human Brain Mapping 16(4): 228-250.
- Robbins S, Evans AC, Collins DL, Whitesides S (2004) Tuning and comparing spatial normalization methods. Medical Image Analysis 8(3): 311-323.
- Klein A, Andersson J, Ardekani BA, Ashburner J, Avants B, et al. (2009) Evaluation of 14 nonlinear deformation algorithms applied to human brain MRI registration. Neuroimage 46(3): 786-802.
- Hill DLG, Batchelor PG, Holden M, Hawkes DJ (2001) Medical image registration. Physics in Medicine and Biology 46: R1-R45.
- Greenspan H, Ruf A, Goldberger J (2006) Constrained Gaussian mixture model framework for automatic segmentation of MR brain images. Medical Imaging, IEEE Transactions 25(9): 1233-1245.
- Papademetris X, Jackowski AP, Schultz RT, Staib LH, Duncan JS (2003) Computing 3D Non-rigid Brain Registration Using Extended Robust Point Matching for Composite Multisubject fMRI Analysis. Springer Berlin Heidelberg pp. 788-795.
- Nagata T, Tsuyuguchi N, Uda T, Ohata K (2011) Non-normalized individual analysis of statistical parametric mapping for clinical fMRI. Neurology India 59(3): 339-343.
- Faro SH, Mohamed FB, Law M, Ulmer JT (2012) Functional Neuroradiology. Principles and Clinical Applications. Springer.
