 Research Article
Abstract
Danish paradox: Spanish flu affected Denmark in 1918-20. The total mortality was anyhow not increased. In order to avoid starvation Denmark had to replace the blocked imported foods by direct human utilization of crops by reducing amount of livestock and alcohol production. This article represents outlines of the Danish diet and monthly changes in mortality during 1917-21 based on old data. Dietary orders were planned by Hindhede in Apr 1917, were fully active between September 30, 1917 and November 1, 1918, withdrawn thereafter. The explanation on stability in total mortality in 1918 has been associated with decrease in non-flu mortality, but not fully explained. A closer assessment of “age-adjusted” data shows that flu lethality in Oct – Dec 1918 (1.9 %) was lower than during later (parts of flu) waves (2.2 % and 2.1 %) during 1919 and 1920. In virtual experiment Finnish food from the 1970’s was replaced by foodstuffs (energy-%) as follows: wheat bran (1%), potatoes and barley meal 24.5 %, both. These maneuvers and restriction in butter export caused increase in availability of vitamin C, vitamin D, silicon (Si), magnesium (Mg) and antioxidants, with highest change in Si availability (about 10-fold). Changes in protein were not remarkable, possibly because of different levels of sugar consumption and potato lysine. The direct, opposite to indirect, utilization of the “Hindhede” supplement saved 80 % of its energy for humans, was a climate-smart and obviously a human health promoting maneuver.
Conclusion: Climate-smart diet associated with slightly lower non-flu mortality and possibly lethality of Spanish flu in Danish towns during 1916-21. Discussion on roles of potatoes and silicon is suggested.
Keywords: Virus Pandemic; Mortality; Silicon; Low-Protein Diet; Potato; Lysine; Phytosterols; Ecologic; Economic
Abbreviations: BW: Body Weight; Jan: January; Feb: February, etc; Jan.17: January 1917; Feb.17: February 1917, etc; “Experimental Year”: period “between Oct 1, 1919 and Oct 1, 1918” (in this article: from Oct 1 to Sept 30, 1918); Tot: Total Mortality
Introduction
There is much discussion on the origin of the “Spanish flu”. It is known that it did not originate from Spain and it had milder forms before August 1918, when the more deadly form begun to spread from France [1]. Spanish flu pandemic was most active in Denmark during 1918, with half a million cases, but it did not increase absolute total number of deaths, while total mortality increased in Sweden by 26 % [2]. The resistance of total mortality on moderately high influenza activity has been discovered e.g. by Kolte [2]: “both the cause-specific and the total mortality must be examined in order to obtain a full picture of the pandemic, as focusing on only 1 of them will clearly miss some of the important aspects of the pandemic.”. Suggestion that Swedish-Danish difference could be based on higher population density in Denmark than Sweden [2] is questionable. During 1917-18 Denmark had to make a nationwide “dietary experiment” because of commercial blockade [3,4,5].The dietary change included e.g. reduction of protein intake, but Hindhede, the leader of the change, knew based on old studies [6,7], e.g. by soldiers and athletes, that 50 g protein is enough for daily need of adult people. The aim of this study is 1) to assess time-related associations of dietary changes with public heath parameters in Denmark and 2) in a virtual study to assess effects on dietary parameters, when 50 % of Finnish diet from the 1970’s were replaced by the three main foodstuffs in Hindhede experiment, by “Hindhede” supplements.
Materials and Methods
“Age-specific” data concerning incident influenza rate, influenza death rate and total death rate in Danish towns are attained from Figure 1 in [2]: Y-axis values (on logarithmic scale) were measured by ruler. First was measured distance between y-value 1 and y-value 100,000 ( = Power(10;5). It was 9.6 cm. Then was measured parameter values, e.g. of total number of deaths (Tot) as cm (x) of each month. Equation Tot = Power(10;x/(9.6/5)) gave the number of deaths. Similarly, were attained data for incident influenza rate and influenza death rate. Obviously because accurate diagnoses for mild incident influenza cases were not available, ‘alii morbi epidemici’ was used as an account for the influenza mortality [2] and gives freedom to use “flu” instead of “influenza” for mortality. It seems that all “incident influenza cases” were not caused by Spanish flu, because they existed every month before, between and after the epidemic. In the tables are used the same labels for incidence “influenza” as in [2], but in the text often the more realistic “flu”. Historical data on the dietary experiment are from [3-5].
Historical
Climate-Smart Diet: Commercial blockade placed Denmark in a very serious situation during The I World War [3]. Before blockade Denmark had imported more than half of her bread cereals and a very considerable amount of corn and oil cakes for the use of domestic animals [3]. Earlier butter was mainly exported, people used margarine and skimmed milk was given to pigs [5]. Since Apr 1917 committee of Hindhede begun to work with following consequences [3]: the stock of cattle was dropped by 35 % and number of pigs by 83 % [4], brandy distillation was stopped totally and the beer production was reduced by a half [3]. Principal foods were bran bread, barley porridge, potatoes, greens, milk, and some butter [3]. Bran bread was composed of rye (milled to 100 per cent), 24 % of barley meal (milled to 95 %) and all available wheat bran. No wheat bran was used as fodder [3]. This procedure gave more than twice the amount of bread compared with alternative when rye had been milled to 70% [3]. Direct consumption of crops by humans saved nutritional energy ca 80 %. Perfect food restrictions were realized between Sept 30, 1917 and Nov 1, 1918. (“By October 1917, food restrictions had become very severe” [3] and after October, 1918, it was not possible to continue the experiment “because of the epidemic of influenza” [3]. Statistically assessed “experimental year” in [3] occurred between Oct 1 of 1917 and 1918 (including Oct 1917 and Sept 1918) (Figure 1). During 1900- 1916 the range of variation in total mortality of middle aged men in Copenhagen had been 7 %, but during “the experimental year” it was 34 % lower than the average in 1900-1916 [3]. “The death rate for women was also been lowered 17 per cent. “in” the four year period 1910-14.” [3]. (Possibly “in” must be “to”. 1910-1914, “four years” means period from Jan 1 to Jan 1?)
Result
The estimated, from [2] attained data, show that flu epidemic affected Denmark most seriously in 1918. Number of incident influenza cases was highest in Oct 1918 (ca 83,500) and influenza deaths in Nov 1918 (ca 1,700). White spots with black margins show the (selected) limits of “the experimental year” (Figure 1). Figure 1 shows monthly age specific number of influenza (flu) deaths, number of incidental influenza (flu) cases and median of influenza (flu) deaths. Lethality of influenza (flu) was lower before Oct 1918 - during the first wave of the flu. Proportion of influenza as a cause of death exceeded 30 % in periods from Oct 1918 to Jan 1919 and in Feb 1920 (Figure 2) [2]. Mean lethality (deaths/ incidence) of influenza during periods of Spanish flu epidemics was as follows: July – September, 1918 (during the last months of “the experimental year”): 0.4 %, Nov – Dec, 1918: 1.9 %, Jan – May, 1919: 2.2 % and Jan – Apr, 1920: 2.1 % in [2]. (Figure 3) (Three month means are calculated by original data (Σ.deaths/Σ. incidences) – they differ from means of 3 months [(lethality.1 + lethality.2 + lethality.3)/3]. Figure 3 represents the lethality of Spanish flu during the epidemics in 1918-1919 and in 1920. Three month means were as follows: Jul.18 – Sept.18 (the first wave of the flu): 0.4 %, Oct.18 – Dec.18: 1.9 %, Jan.19 - Mar.19: 2.2 %, Mar.19 – May.19: 2.3 % and Feb.20 – Apr.20: 2.2 %.
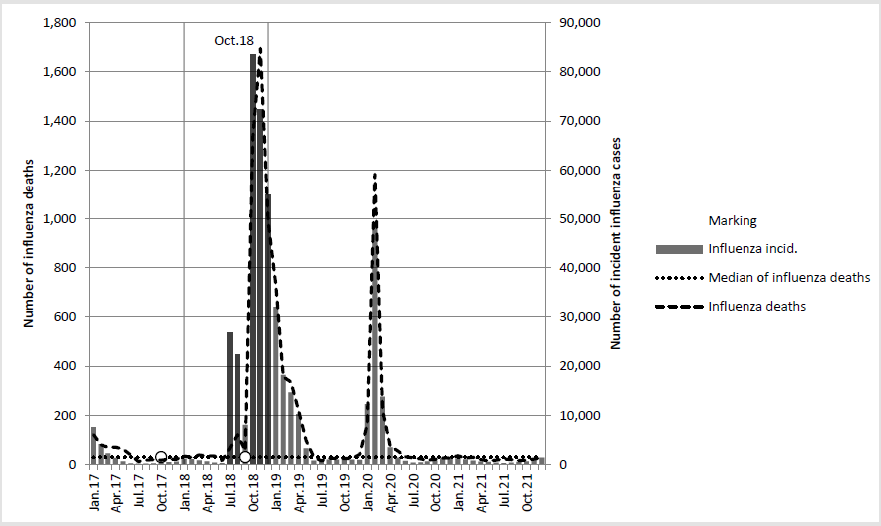
Figure 1: Shows monthly age specific number of influenza (flu) deaths, number of incidental influenza (flu) cases and median of influenza (flu) deaths. Lethality of influenza (flu) was lower before Oct 1918 - during the first wave of the flu.
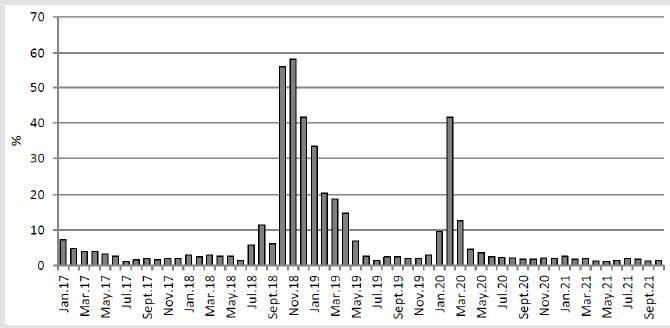
Figure 2: Shows the proportion of influenza deaths in total mortality in 1917-1921.
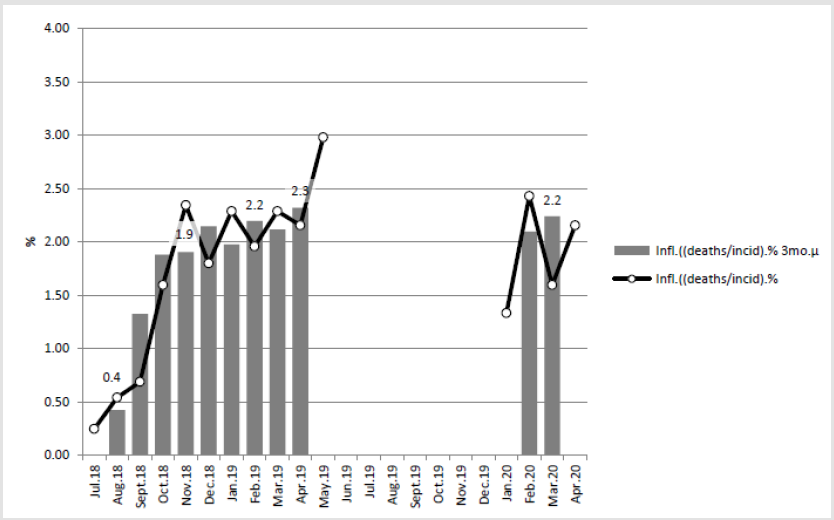
Figure 3: Influenza lethality in percent during Spanish flu epidemics - original and 3 month means.
Associations between Dietary Changes and Mortality
Figure 4 shows “age-specific” total (Tot) mortality and mean monthly total mortality [Tot.μ.mo’s.(17-21)] and mean annual mortality [Tot.μ.(17-21)] in Danish towns during 1917-1921. Black spots (and one white spot) show the limits of the periods of Spanish flu: Jul, 1918 – May, 1919 (which includes two waves: Jul.18-Sept.18 & Sept.18 – May.19) and Jan 1920 – Apr 1920. White spots: “Apr. 17” shows time point of the first decisions. “Oct.17” – “Sept.18” shows the “experimental year”. Figure 3 “Jan.18” – “Dec.18” (including the end points) shows the dramatic changes in total mortality in 1918. This picture, as in this article in general, which represents “agespesific”, by population of 1920 weighted data [2], is giving more weight for middle-aged people, Tot.18 is 7 % above the mean of “age-spesific”, Tot.16 & Tot.19 – as it seems to be). Paradox between high number of registered influenza cases and no change in total mortality is explained by changes in “Non-flu deaths” (Figure 5). Figure 5 shows “age-spesific” mean monthly variation [Tot.μ.mo’s. (17-21)] and mean annual mortality [Tot.μ.(17-21)] in Danish towns during 1917-1921. Other than influenza mortality (“Nonflu- deaths”) begun to decrease since Sep 1917. It was lowest in September 1918, during the first wave of Spanish flu. It stayed unusually low until May-Aug 1919.
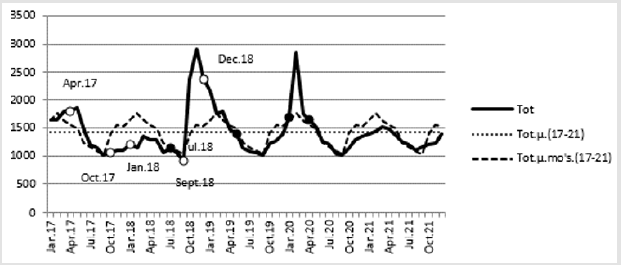
Figure 4: Monthly and mean monthly total mortality, as well as mean annual total mortality of Danish towns in 1917-1921, with historical remarkings.
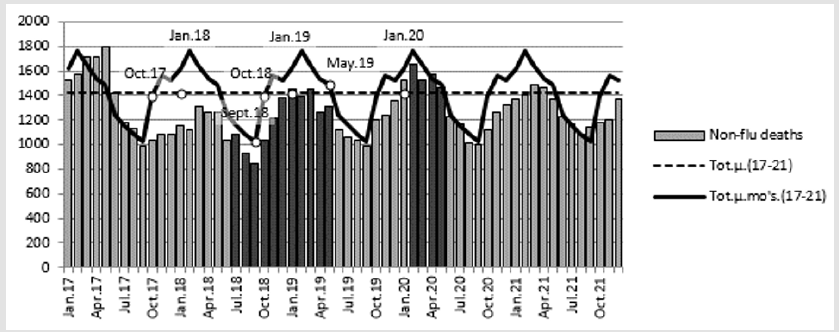
Figure 5: Mean monthly variation in total mortality, other than influenza mortality and mean total mortality of Danish towns in 1917-1921. Darker columns show periods of the Spanish flu.
Discussion on Statistics
Influenza epidemics affected seriously Danish towns in 1918- 1920 (Figures 1,2,4). Spanish flu incidence was highest in Oct.18 and death-rate in Nov.18 (Figure 1), but lethality was highest in the springs 1919 and 1920 (2.2 - 2.3%) opposite to Oct – Dec 1918 with 1.9% and Jul.18 – Sept. 18 (first wave of the flu) with 0.4%. (Figure 3). Lower lethality in Oct – Dec 1918 can be dependent on the normal monthly variation in mortality [8], but other factors cannot be excluded. In USA highest “lethality rate” has been reported from Oct 18 [9], but it is possible that the term “lethality rate” has been used as synonym for death-rate, not in its scientific meaning [10] and tells more about the simultaneousness of the epidemic: one month difference with the maximum peaks in Denmark and USA. Monthly non-flu mortality (Figure 5), was reduced during the experimental year, but after September 1918 begun slowly to increase and reached the 5-year monthly mean in May-August 1919. Remarkable is that the decrease in Non-flu mortality continued until September 1918, independent on the Spanish flu epidemic, which begun two months earlier (in July). The time needed to get the dietary restrictions “very severe” was about a half year before Oct.17, but achieving the pre-war level in meat production and consumption, after Oct.18 needed more time and was obviously possible first in September 1919, with normal non-flu mortality (Figure 5). The end of the war (in November 1918) [11] is not clearly seen in Figure 5.
Virtual Experiment
Hindhede describes that after the dietary changes in 1917
the principal foods were: bran bread, barley porridge, potatoes,
greens, milk and some butter [3]. Shortly said: imported food
was mainly replaced by the crops earlier given to pigs. “Hinhede”
(supplementation) contained mainly potatoes, barley and wheat
bran. In the following virtual experiment 50 % of the Finnish diet
from the 1970’s [12], which gives mineral element values per 10 MJ
[13], was replaced by barley, potatoes and wheat bran. The protein
amount (106.25 g) was attained by multiplying nitrogen (17 g) by
6.25 (as usually, discussable). The dietary fat was approximated
by fat energy-% (37.5) from 1982 in [14]. The energy-% (E%) of
protein (and later fats) are changed to grams (and vice versa) by
[15]. In the “Hindhede” (supplementary) diet energy proportion
from wheat bran was selected to be 2 % and from potatoes and
barley a´ 49 %. Parameter values for “Hindhede” supplementation are attained by multiplying the values in [16], given as g/MJ, by
10*(2/100) for wheat bran and by 10*(49/100) for potato and
barley meal values.
The virtual “Hindhede” supplementation [16] contained 78.9 g
(1.26 MJ, 12.6 E%) protein, 11.1 g (0.42 MJ, 4.2 E%) fat, 8,853 mg K
(potassium), 787 mg Mg (magnesium), 260 mg Ca (calcium), 2,390
mg P (phosphor) and 702 mg Si (silicon) per 10 MJ (Table 1). Values
of Koivistoinen [12] are given in Table 1. After supplementation
[(“Hindhede” & “Koivistoinen”) (1:1)] contained (in brackets ratio
to “Koivistoinen”) : 84 g, 1.35 MJ, 13.5 E% (94 %) protein, 55.3 g,
2.10 MJ, 21 E% (56 %) fat, 6,677 g (1.5-fold) K, 667 mg (1.5-fold)
Mg, 880 g (59 %) of Ca and 356 mg (13-fold) Si.
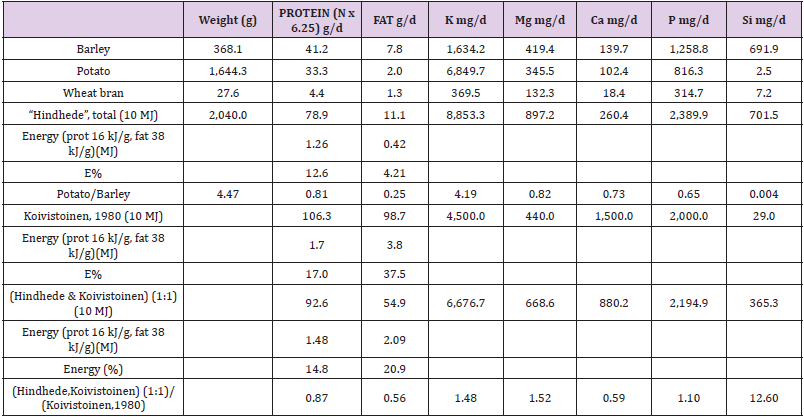
Table 1: Comparison of 10 MJ diets:
a) Virtual “Hindhede” supplementation,
b) Koivistoinen, 1980 and
c) [( Hindhede & Koivistoinen) (1:1)]
Discussion on Virtual Study
The surprisingly small change in protein and P content could
be explained by high sugar consumption in 1976-77: 112.5 g/d,
[17] resp a´ 117 kJ/g [n.15], total 1.9 MJ/d (19 %). (The study [12],
including planning and analytical work, was performed in 1975-78,
why only 1976 and 1977 are selected for determination of sugar
consumption. This is higher than 100 g in [12] represented). Alcohol
consumption, 13.6 g alcohol/d/capita [12], a´ 25 MJ/kg [18], which
responds 3.4 E%, seems not to be on an average as important, if we
assess mineral composition of food, because some alcoholic drinks
contain mineral elements, too (e.g. beer). It seems that the possible
effect of “Hindhede” supplementation was not based on low protein
content as sometimes suggested [5]. Changes in fat consumption
changed during the war: earlier butter was exported and Dänish
people consumed margarine (without vitamin supplementation)
[5]. Fat reduction was obviously not as great as caused by the above
virtual replacement, because of commercial blockage butter export
was not possible and cattle reduction was only 35% [4]. Ca content
in the “Hindhede” (supplementation) per 10 MJ was low (260 g/d).
The high content in “replaced diet” (880 mg) was caused by the high
Finnish Ca consumption [12]. Hindhede obviously had remarked,
this when he wrote: “The people must first have bread, potatoes
and cabbage in sufficient quantity, and then some milk. Meat is the
last requirement to be met” [3]. Cabbage is rich in Ca [16].
Potato is rich in vitamin C and contains essential amino acids
(isoleucine, leucine, lysine, methionine, phenylalanine, threonine,
tryptophan, valine) per energy unit about 90 % of that of cereals
(wheat, rye, barley) and about 1.5-fold lysine but 2/3 of methionine
to that of the cereals [16]. Lysine is important because it is present
only in limited amounts in plant proteins [19]. Hunger and obesity
caused by lysine deficiency is better to treat by potato than cereals.
Besides of vitamin C potatoes contain even phytosterols [16], e.g.
β-sitosterols with several benefits [20]. Important factors could be
the other protective nutrients in the “Hindhede” supplementation:
Mg content was about 2-fold and Si content ca 24-fold to [Table1].
Mg is a cofactor in more than 300 enzymatic reactions and supports normal functions of the cells [21]. Structural properties of Si are
obviously beneficial in CVD and musculoskeletal diseases [22] and
generally in cellular protection. It is possible that soluble silicon or
silicon compounds can protect against infectious diseases [23]. In
water stress Si can increase potato yield and proline content [24],
(proline content ca ad two-fold). Proline in an important part of
milk tripeptides with ACE function [25].
Finnish Paradox: In Finnish countryside during the 1950’s the diet was largely similar as guided by Hindhede: barley porridge was the most common breakfast, barley meal was added to rye bread, potato and cereals were the main food. Valkonen and Martikainen have presented in 1990 that male CHD mortality in the 1951-57 was about on the same level as next time after the CHD epidemic (1957- 1985) in 1985 [26], although milk fat-% was obviously remarkably higher than today. One of the suggested causes for the increase in male CHD could have been reduced recycling of plant nutrients and the delay in Mg-fertilization [27], as well as in Si fertilization. Silicon content of human diets has been “about 20 to 50 mg/day with the lower values for animal-based diets and the higher values for plantbased diets” [28]. Benefits of Hindhede diet have been possibly higher, if we knew the number of subclinical (symptomless) Spanish flu infections, which was obviously higher in Denmark than in Sweden, supposed by the higher population density [2]. Explanations on different resistance against infectious diseases (e.g. covid-19) [29] are suggested to be studied by different dietary habits, e.g. by different silicon availability, in public health via food balance sheets of FAOSTAT or in indual cases via serum Si values. Interesting mineral element could be even tin, which is associated with thymic functions [30]. If we remember cabbage and other “greens”, Hindhede diet seems to be more climate-smart, economic and ecologic than newer recommendations [31]. Renaissance of potatoes, possibly by selected cultivars, is expected.
Conclusion
Climate-smart diet associated with slightly lower non-flu mortality and possibly lethality of Spanish flu in Danish towns during 1916-21. Discussion on roles of potatoes and silicon is suggested.
Acknowledgement
I am grateful to Professor Osmo Hänninen and late veterinary surgeon Seppo Haaranen for several discussions.
References
- Spanish flu. Wikipedia
- Kolte IV, Skinhöj P, Keiding N, Lynge E (2008) The Spanish flu in Denmark. Scandinavian Journal of Infectious Diseases40(6-7):538-546.
- Hindhede M (1920) The Effect of Food Restriction During War on Mortality in Copenhagen. JAMA 74(6):381-382.
- Hindhede MUgesk. f. Laeger(1919) Abstr JAMA 72: 1198 (Apr 19) 1919.
- Karström H(1978) Oikea ravinto – terveytemme perusta. Kirjatoimi offset, Tampere pp. 94-95.
- Chittenden RH(1905) Physiological Economy in Nutrition. Heineman, London 73: 328-330.
- Hindhede M (1909) Min reform. Stockholm, PA Norstedt & Söners Fö
- Töysä T(2019) Monthly Variation in Finnish Total Mortality during 1891-2017, Temperature and Discussions. Biomed J Sci & Tech Res 14(4): 1-4.
- McGhee P (1918)“Influenza 1918” in Wikipedia. Spanish flu, refer.
- BENCKO V (2004) Lethality rate. Hygiene and Epidemiology: Selected Chapters. 2nd Prague. 2004. ISBN 80-246-0793-X First World War.
- Koivistoinen P (1981) Mineral Element Composition of Finnish Foods: N, K, Ca, Mg, P, S, Fe, Cu, Mn, Zn, Mo, Co, Ni, Cr, F, Se, Si, Rb, Al, B, Br, Hg, As, Cd, Pb and Ash. Acta Agriculturae Scandinavica Supplementum 22: 165-171.
- Koivistoinen P (1982) Food Technological Evaluation of Xylitol. Personal communication 28: 373-403.
- Uusitalo U, Pietinen P, Leino U(1990) Food And Nutrient Intake Among Adults in East and Southwest Finland - A Dietary Survey of the Finmonica Project in 1982, National Public Health Institute. Helsinki, Finland 1987. Kansanterveyslaitoksen julkaisuja - Publications of the National Public Health Institute. B 1/1987, Helsinki 1990.
- (2020) Energy density of food. Specific energy. Wikipedia.
- Online.web: ’www.sfk-online-net’.
- http://www.fao.org/faostat/en/#data/FBSH > Data > Sugar (Raw Equivalent).
- https://en.wikipedia.org/wiki/Energy_content_of_biofuel
- Beta-sitosterol. Wikipedia.
- White A, Handler P, Smith EL (1968) Priciples of Biochemistry. Chapter 48: 1015. McGraw-hill book company/Kōgakusha company, LTD. on pp. 93.
- Elin RJ (1994) Magnesium: the fifth but forgotten electrolyte. Am J Clin Pathol 102(5):616-622.
- Töysä T (2018) Regional associations of CHD and musculoskeletal morbidity with environmental and geographic factors – e.g. Ca, Mg, Si, Sn. Biomed J Sci & Tech Res. 4(2).
- Parantainen J, Tenhunen E, Kangasniemi R, Sankari S, Atroshi F (1987) Milk and blood levels of silicon and selenium status in bovine mastitis. Vet Res Commun11(5):467-477.
- Pilon C, Soratto RP, Broetto F, Fernandes AM (2014) Foliar or Soil Applications of Silicon Alleviate Water-Deficit Stress of Potato. Crop Ecology & Physiology106(6): 2325-2334.
- Rutella GS, Solieri L, Martini S, Tagliazucchi D (2016) Release of the Antihypertensive Tripeptides Valine-Proline-Proline and Isoleucine-Proline-Proline from Bovine Milk Caseins during in Vitro Gastrointestinal Digestion. JAgric Food Chem 64(45): 8509-8515.
- Valkonen T, Martikainen P(1990) Development of mortality from ischaemic heart disease in subgroups of the population in Finland. Sosiaalilääketieteellinen Aikakauslehti Journal of Social Medicine27:273-288.
- Toysa T, Hanninen O (2016) Compliance of Finnish Male CHD and Total Mortality with Soil Fertilization in 1957-1990. J Agriculture2(1): 013.
- Pennington JA (1991) Silicon in foods and diets. Food Addit Contam 8(1):97-118.
- Nordling L (2020) Africa’s pandemic puzzle: why so few cases and deaths? Science 2020: 756-757.
- Cardarelli N (1990) Tin and the thymus gland: a review. Thymus 15(4):223-231.
- Nordic Nutrition Recommendation 2012. Integrating nutrition and physical activity. (5th), Nord 2014:002.
