 Research Article
Abstract
Circulating microparticles are cell-derived vesicles that are generally released within the circulation by stressed cells upon tissue injury. Changes in microparticles circulating levels are associated with a wide range of pathologies. Since microparticles retain markers of their cellular origin they are of major interest as novel biomarkers of tissue injury. Platelets-derived microparticles are the focus of many studies as they are associated with several vascular and blood coagulation disorders. Flow cytometry analysis combined with the use of fluorochrome- coupled antibodies directed against specific microparticle markers is the most commonly technique for detecting and quantifying microparticle levels within blood and other biological samples. To be valid, this technique requires verifying the specificity of each of the antibody used by including in the experiments control isotype antibodies. During our studies aiming at characterizing by flow cytometry analysis basal level of PMPs in rat plasma we have consistently observed that commercially obtained-anti CD42 and anti CD61 antibodies and their respective control isotypes lead to positive signal. We have then analyzed and quantified by western blotting experiments total immunoglobulin content of the commercially available either anti CD42 or anti CD61 antibody or their control isotype solutions. We report that, as compared to anti CD42 or anti CD61 antibody solutions, the IgG concentration of the solutions corresponding to their isotype controls is much higher. Furthermore, we demonstrate that if prior to flow cytometry analysis of PMP levels in rat plasma, the isotype control solutions are diluted in such a way that the discrepancy in IgG concentrations between anti CD42 or anti CD61 antibody solutions or their corresponding control isotype solutions are suppressed, we no longer have non-specific signal. Therefore, in the light of our present report, IgG concentrations between specific and isotype control antibody solutions should be normalized for a better analysis of microparticle plasma levels that avoids non-specific signal.
Abbreviations: ATU: Antithrombin Units; MPs: Microparticles; PMPs: Platelet Derived Microparticles; PPP: Platelet Poor Plasma; PS: Phosphatidylserines; TBS: Tris Buffer Saline
Introduction
Microparticles (MPs) are 0.1 μm and 1 μm diameter vesicles that may be released by injured tissues or stressed cells [1,2]. They are formed by parts of cells plasma membranes and may contain many cell-derived molecules such as receptors, cytoskeleton, signal proteins and effector proteins [3]. Microparticles are characterized by both phosphatidylserines (PS) exposure at their external surface and by the presence of markers reflecting their cellular origin [4,5]. MPs are different from other types of cell-derived vesicles such as exosomes and apoptotic bodies. Exosomes are much smaller (40 to 100 nm diameter) than MPs and do not express PS at their external surface. Unlike exosomes, apoptotic bodies express PS on the outer membrane but their size (1 to 5 μm diameter) is bigger than that of MPs [6]. Under some stress conditions, cytoplasmic calcium level may increase causing the activation of calcium- dependentscramblases and floppases as well as the inhibition of flippase, which leads to the translocation of PS from the inner to the outer leaflet of the plasma membrane [7,8]. Externalized PS contribute to the activation of the prothrombinase complex, which triggers in turn the activation of the blood coagulation cascade and platelet aggregation [9,10]. Externalized PS are also eat-me signals that play a major role in phagocytosis and consequently in tissue lesion and repair [11].
Increases in MP levels have been reported in a variety of prothrombotic and inflammatory states, cardiovascular or autoimmune disorders and infectious diseases. Thus, measuring MP levels in blood or in other biological fluid may provide useful information as a prognostic biomarker for a wide variety of diseases [2,12,13]. In healthy subjects, platelet derived microparticles (PMPs) are the major circulating MPs (70-90 %). Studies have suggested that PMPs promote the expression of adhesion molecules on a variety of cells, stimulate the release of cytokines, alter vascular functions, induce inflammation and angiogenesis, and are also involved in cancer metastasis [13-15]. A large variety of markers have been used to characterize PMPs such as CD41, CD41a, CD42a, CD42b, CD42d, CD61, CD62P [2,16].
Flow cytometry using fluorescent probes is the most widely used technique to characterize and quantify MPs in blood as well as other biological liquids. Annexin-V binds strongly and specifically to PS and thereby fluorescent-labelled annexin-V is used for the detection of PS-exposing bodies among which MPs. Therefore, based on the size (50-1000 nm diameter) and on the exposure of PS (annexin-V positive vesicles) flow cytometry analysis enables to detect MPs within a given biological sample. Furthermore, fluorescent-coupled antibodies recognizing a cellular marker may be used to identify the cellular origin of the MPs. However, to ascertain the specificity of the signal, it is necessary to conduct parallel experiments using control isotype for each antibody. Control isotype corresponds to an antibody labelled with the same fluorochrome and produced in the same species as the specific antibody but lacking reactivity with the targeted marker. In the present report, we initially undertook to detect basal levels of platelet-derived microparticles in rat plasma using commercially available anti CD42 and anti CD61 antibodies. However, the control isotypes of either of these antibodies lead to non-specific signal. We then investigated the raisons for this nonspecific signal and we provide clues on how to avoid such nonspecific signal in MPs detection by flow cytometry experiments.
Material and Methods
Animals
Wistar rats were used in our study for preparing platelet poor plasma (PPP). Animal care and manipulations for experimentation were conducted in accordance with the guidelines of the French Agriculture and Forestry Ministry (decree 87849) and of European Communities Council Directive (86/609/EEC) and were approved by the local ethics committee (COMETHEA:CE2012-06).
Preparation of Platelet Poor Plasma (PPP)
Rats were anaesthetized with 4 % isoflurane + oxygen 4 ml/ min for induction and 2 % isoflurane + oxygen 2 ml/min for maintenance. Arterial blood was collected intracardially using 5 ml syringes containing 100 μl of anticoagulant (sodium citrate 0.109 M). PPP is obtained by two successive centrifugations at 2500 g, 20°C for 15 min. Each time, the pellet is removed and the supernatant is collected and stored at -80°C.
Flow Cytometry Analysis
The detection of MPs was performed by flow cytometry using the following commercially available antibodies: anti Mouse/ Rat CD61-PE (BioLegend, 104307) and anti-Mouse/Rat CD42d- APC (eBioscience, 17-0421-82) which are both widely used as specific anti platelet -derived MPs. Their control isotype antibodies (BioLegend, 400907; eBioscience, 17-4888-81), were used in parallel experiments. 30 μl of PPP were incubated, with 2 μL Hirudin at 1 ATU/μL (Sigma, H0393-100UN) and 5 μl of antibodies, for 20 min in the dark at room temperature. After incubation, 1 ml of Annexin V buffer (BD Bioscience, 556454) is added. Sizing beads of 0.16 μm, 0.20 μm, 0.24 μm and 0.5 μm (Mega mix Plus-SSC Biocytex, 7803) were used to set up the assay, with the threshold being set on SSC as recommended by the manufacturer, for maximum accuracy to detect MPs in the size range of 0.1 μm to 1 μm. Flow cytometry was performed using a FACSVerse (BD Biosciences).The analysis was performed by the Flow Jo v10 software.
Western Blotting Analysis
Western Blot experiments was performed to quantify the IgG present in anti CD61-PE (BioLegend, 104307) and anti CD42d-APC (eBioscience, 17-0421-82) antibody solutions and their control isotype (Hamster anti IgG, BioLegend, 400907; Hamster anti IgG, eBioscience, 17-4888-81). Antibody solutions were diluted and incubated with Laemeli buffer 1X (Tris HCl 50 mM, SDS 70 mM, Glycerol 20 %, Bromophenol Blue 1.5 mM, pH 6.8) and heated to 98°C for 10 min. The proteins are then resolved using 4-15 % gradient polyacrylamide gel (Bio Rad, 3450048). The proteins are transferred, at 250 V for 7 min, to a nitrocellulose membrane (Bio Rad, 1704159) via Bio Rad Trans-Blot Turbo Transfer System. This membrane was then saturated in a solution of TBS (TRIS buffered saline; 250 mM Tris-base, pH 7,4, 1.37 M sodium chloride, 27 mM KCl) - tween 0.1 % - milk 5 % and incubated with the anti IgG hamster antibody coupled to the horseradish peroxidase (Abcam, ab 5745), for 2 hours. The membrane was then washed 3 times in TBS - tween 0.1 % for 10 min. The proteins recognized by the hamster anti IgG antibody are revealed by bioluminescence using a Luminata solution (Millipore, WBLUF0100) and Bio Rad Chemi Doc MP Imaging System. Quantification is performed using Image Lab 5.0 and ImageJ software.
Statistical Analysis
Western Blot quantification are given as means SEM. Comparison between anti CD61-PE, anti CD42d-APC and their control isotype was performed using t-test.
Results
Figure 1 represents a typical flow cytometry analysis of rat PPP. An unstained sample was acquired to set the photomultiplier for considered channels as represented in Figure 1A. In Figure 1B, the PPP was incubated with anti CD42d-APC antibody. It reveals the presence of a putative CD42d-APC positive population representing about 33.58 % of total MPs within the PPP. However, as depicted in Figure 1C, if under identical conditions PPP is incubated with the control isotype antibody a similar pattern to that observed with anti CD42d-APC antibody is obtained with APC positive population representing about 37.40 % of total MPs within the PPP. For Figure 1D, PPP was incubated with anti CD61-PE antibody. It reveals the presence of a putative CD61-PE positive population representing about 19.17 % of total MPs within the PPP. However, as depicted in Figure 1E, if under identical conditions PPP is incubated with the CD61 control isotype antibody a similar pattern to that observed with anti CD61-PE antibody is obtained with PE positive population representing about 1.41 % of total MPs within the PPP. Altogether, data from Figure 1 suggest that the signal observed with either anti CD42d-APC antibody or with anti CD61-PE antibody may be due totally or at least partially to non-specific labelling of MPs as the signal obtained with the control isotype antibodies used in the experiments is far too high to be considered as negligible. Therefore, we hypothesized that the strong non-specific signal observed with control isotype antibodies may be due to a much higher concentration of IgG in the control isotype antibody solutions than in anti CD42d-APC or in anti CD61-PE antibody solutions, used at the same dilution.
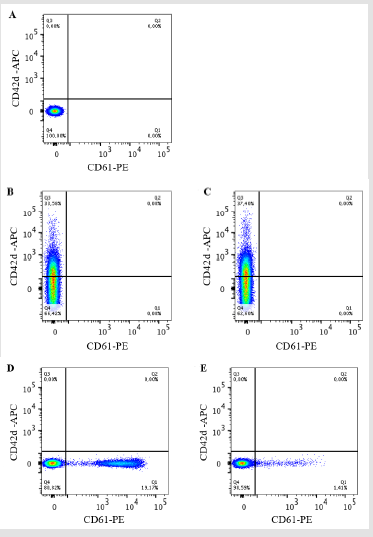
Figure 1: Dot plot graphical representations of rat PPP analyzed by flow cytometry. The size/granulometry gate was chosen in order to highlight the MPs. In A, unstained PPP. The PPP was labeled with either anti CD42d-APC in B or its control isotype antibody in C or anti CD61-PE antibody in D or its control isotype antibody in E. The results were analyzed on Flow Jo v10 software n = 4.
To verify this hypothesis, we undertook western blotting experiments in which the anti CD42d-APC antibody, anti CD61- PE antibody as well as control isotype antibody- solutions were resolved by SDS PAGE, transferred to a nitrocellulose membrane and probed with an anti IgG antibody. Figure 2 shows that both anti CD42d-APC (Figure 2A-2B) and anti CD61-PE antibody (Figure 2C- 2D) solutions revealed a similar pattern with four major (100, 75, 50 and 25 kDa) bands among which IgG heavy chain at 50B V kDa and light chain at 25 kDa. Both isotype solutions revealed a similar pattern with only three major (100, 75, 50 kDa) bands among which IgG heavy chain at 50 kDa, the 25 kDa band corresponding to the IgG light chain is not detected. Therefore, the intensity of the 50 kDa IgG heavy chain band was used for comparisons between samples. Furthermore, quantification of band intensities revealed that the concentration of IgG heavy chain is 33 times higher in the control isotype of anti CD42d-APC solution than that of the anti CD42d-APC antibody solution, for anti CD61-PE, its control isotype solution is 4.6 times more concentrated in IgG heavy chain than the anti CD61 antibody solution.
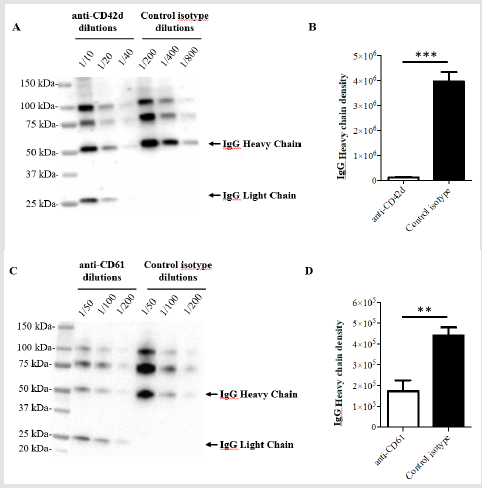
Figure 2: Western blotting analysis of antibody solutions used in the study. In A, anti CD42d-APC or its isotype control antibody solutions and in B anti CD61-PE or its isotype control antibody solutions were analyzed at multiple dilutions by western blotting using anti total IgG antibody. In C, D quantification of the intensity of heavy chain band using ImageJ software is represented. **: p<0.01; ***: p<0,005. In all the experiments n was 3 or higher.
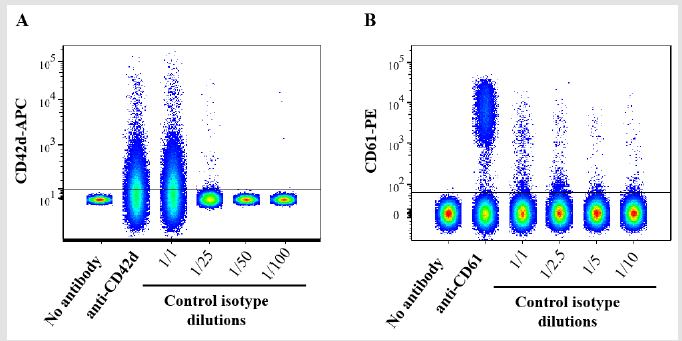
Figure 3: Dot plot graphical representations of rat PPP analyzed by flow cytometry. The PPP was incubated with either anti CD42d-APC antibody or its control isotype antibody (A) or with anti CD61-PE or its control isotype antibody (B) at the indicated dilutions prior to flow cytometry analysis. Data were analyzed and concatenated on the Flow Jo software n = 3.
Data from Figure 1 suggested that the strong non-specific signal observed in flow cytometry analysis with control isotype antibodies may be due to a much higher concentration of IgG in the control isotype antibody solutions than in anti CD42d-APC or in anti CD61-PE antibody solutions. Data from Figure 2 confirmed that the concentration of IgG heavy chain is much higher in the solutions corresponding to control isotype antibodies than that of the anti CD42d-APC or the anti CD61-PE antibody solutions. Therefore, we conducted an additional set of experiments of flow cytometry analysis of rat PPP using the control isotype antibody solutions at various dilutions. Figure 3 confirms that for both control isotype antibody solutions the non-specific signal drastically decreases and becomes insignificant if they are diluted at a rate that downs the concentration of IgG heavy chain to the same level than that of anti CD42d- APC or anti CD61-PE antibody solutions.
Discussion
The initial aim of our study was to set up and standardize a method for detecting and quantifying PMPs in rat PPP and possibly other biological fluids both under basal- and pathological conditions. However, we were confronted in the early steps of our study to a serious problem. Control isotype antibodies, which supposedly should define the background of the assay represented by non-specific antibody binding to MP, resulted in a strong signal comparable to that of the two-specific anti PMPs antibodies used: anti CD42d-APC or in anti CD61-PE. We aimed then at analyzing this experimental problem hoping to provide clues on how to ovoid it in future experiments. Since the same problem occurred with two different antibodies directed against distinct antigens (CD42d and CD61), we can rule out that this problem may not be linked to a given antibody source. In our experimental set-up, we initially used all the antibody solutions that were commercially obtained, at rigorously the same concentration that recommended by the supplier. All the antibodies (specific and isotype control) used in our study are IgG type. IgG heavy chains are much larger proteins than the IgG light chain which may be responsible for non-specific binding to other proteins. Therefore, we sought to estimate in a semi-quantitative manner using western blotting analysis, the IgG concentration of each of the antibody solutions used in our study. Such an analysis revealed that IgG concentrations are very heterogeneous between the 4 samples tested and are much higher in the antibody isotype control solutions than in the specific antibodies (CD42d and CD61) solutions. Furthermore and in confirmation that the higher concentration of IgG in the antibody isotype control solutions is responsible for the non-specific signal observed in flow cytometry analysis described in Figure 1, data depicted in Figure 3 provided evidence that normalizing the concentration of heavy chain IgG by diluting antibody isotype control solutions drastically reducedand ever suppressed the non-specific signal. Andersen et al. [1] have shown that non-specific labelling can be explained by the Fc part of the IgG heavy chain that binds to Fc receptors located on cell surface and therefore potentially on PMPs. These authors suggested to use antibody-based blocking solutions to block these Fc receptors. In the present report, we provide a novel clue to prevent non-specific signal, which is to normalize by dilution, all the antibody solutions used to have a similar heavy chain IgG concentration in all the solutions. In conclusion, the present report revealed a heterogeneity in term of IgG heavy chain concentration between anti CD42d, anti CD61 and their control isotype antibody solutions that distorts the analysis of MPs by flow cytometry. In the light of our finding, we recommend to use western blotting analysis to estimate IgG heavy chain concentration in each solution and to dilute solutions of control isotype antibodies in such a way that the IgG heavy chain concentration is similar in all solutions prior to MPs analysis by flow cytometry.
References
- Andersen MN, Al-Karradi SNH, Kragstrup TW, Hokland M (2016) Elimination of erroneous results in flow cytometry caused by antibody binding to Fc receptors on human monocytes and macrophages: FcR-Blocking Eliminates Erroneous Results in Flow Cytometry. Cytometry A 89(11): 1001-1009.
- Barteneva NS, Fasler-Kan E, Bernimoulin M, Stern JN, Ponomarev ED,et al. (2013) Circulating microparticles: square the circle. BMC Cell Biol 14:
- Peterson DB, Sander T, Kaul S, Wakim BT, Halligan B, et al. (2008) Comparative proteomic analysis of PAI-1 and TNF-alpha- derived endothelial microparticles. PROTEOMICS 8(12): 2430-2446.
- Buzas EI, György B, Nagy G, Falus A, Gay S (2014) Emerging role of extracellular vesicles in inflammatory diseases. Nat. Rev. Rheumatol10(6): 356-364.
- Mobarrez F, Svenungsson E, Pisetsky DS (2018) Microparticles as Autoantigens in Systemic Lupus Erythematosus. Eur. J. Clin. Invest 48(12): e13010.
- Żmigrodzka M, Guzera M, Miśkiewicz A, Jagielski D, Winnicka A (2016) The biology of extracellular vesicles with focus on platelet microparticles and their role in cancer development and progression. Tumor Biol 37(11): 14391-14401.
- Daleke DL (2003) Regulation of transbilayer plasma membrane phospholipid asymmetry. J. Lipid Res 44(2): 233-242.
- Key NS (2010) Analysis of tissue factor positive microparticles. Thromb. Res 125(s1): S42-S45.
- Lentz BR (2003) Exposure of platelet membrane phosphatidylserine regulates blood coagulation. Prog. Lipid Res 42(5): 423-438.
- Sinauridze EI, Kireev DA, Popenko NY, Pichugin AV, Panteleev MA, et al. (2007) Platelet microparticle membranes have 50- to 100-fold higher specific procoagulant activity than activated platelets. Thromb. Haemost97(3): 425-434.
- Happonen KE, Tran S, Mörgelin M, Prince R, Calzavarini S, et al. (2016) The Gas6-Axl Protein Interaction Mediates Endothelial Uptake of Platelet Microparticles. J. Biol. Chem 291(20): 10586-10601.
- Burger D, Schock SC, Thompson CS, Montezano AC, Hakim AM, et al. (2013) Microparticles: biomarkers and beyond. Clin. Sci 124(7): 423-441.
- Poncelet P, Robert S, Bouriche T, Bez J, Lacroix R, et al. (2016) Standardized counting of circulating platelet microparticles using currently available flow cytometers and scatter-based triggering: Forward or side scatter? Cytom. Part J. Int. Soc. Anal. Cytol89(2): 148-158.
- Varon D, Shai E (2015) Platelets and their microparticles as key players in pathophysiological responses. J. Thromb. Haemost. JTH 13(Suppl 1): S40-s46.
- Zhang Y, Ma KL, Gong YX, Wang GH, Hu ZB, et al. (2018) Platelet Microparticles Mediate Glomerular Endothelial Injury in Early Diabetic Nephropathy. J. Am. Soc. Nephrol. JASN 29(11): 2671-2695.
- McFarland DC, Zhang C, Thomas HC, TLR (2006) Confounding effects of platelets on flow cytometric analysis and cell-sorting experiments using blood-derived cells. Cytom. Part J. Int. Soc. Anal. Cytol69(2): 86-94.
