 Research Article
Abstract
Anoikis is a cell death process that occurs subsequently to loss of cell-extra cellular matrix interactions. Anoikis contributes to the death of circulating tumor cell that detached from primary tumors preventing them thereby from colonizing distant organs. However, during the metastatic process, some tumor cells may acquire anoikis resistance which enables them to survive in the circulation and to invade other organs. Despite an increasing interest in anoikis, there are no standardized methods that directly and accurately measure tumor cell resistance to anoikis. In this report, we undertook a comparative study of three major anoikis assays commonly used to monitor tumor cell resistance to anoikis: low adherence and re-attachment-, low adherence flow cytometry analysis- and anchorage independent growth in soft agar- assays. To exclude that our conclusions may be altered by specific characteristics of a given tumor cell line, we undertook our study using three different tumor cell lines that are widely utilized in various in vitro metastasis assays. We used a human primary melanoma line A375, a human lung cancer line H661, and a murine melanoma metastatic line B16F10. For each cell line, our study monitored the extent of its resistance to anoikis as estimated from the three anoikis resistance assays described above. Our report points out strengths, weaknesses and the usefulness of each of these anoikis resistance assays.
Keywords: Anoikis; Neoplastic Cells; Circulating Cell Line; Tumor; Neoplastic Processes; Agar; Flow Cytometry
Abbreviations: AIGSA: Anchorage‐Independent Growth in Soft Agar; AV: Annexin V; ECM: Extra Cellular Matrix; FBS: Fetal Bovine Serum; LAFCA: Low Adherence Flow Cytometry Analysis; LARA: Low Adherence and Re-Attachment; NA: Normal Adherence; OD: Optical Density; PI: Propidium Iodide; PS: PhosphatidylSerine
Introduction
Tissue homeostasis depends on many factors among which
adequate interactions between cells and the surrounding
extracellular matrix (ECM). Anoikis or cell homelessness is a
detachment-induced cell death caused by loss of such interactions
[1-3]. Dislodged cells undergo anoikis through a process involving
integrin disengagements and, subsequently, the activation of
specific intrinsic or extrinsic death pathways [4-6]. The intrinsic
pathway leads to mitochondrial protein release into the cytosol
and the activation of caspases proteins [7,8]. The extrinsic
pathway is triggered by death ligands binding to their receptors
and the activation of downstream signaling [9-12]. Both pathways
ultimately lead to endonuclease activation, DNA degradation
and dislodged cell death. Anoikis prevents dislodged cells from
surviving, re-attaching to inappropriate environment, and
colonizing distant tissues. As such, anoikis plays a pivotal role in
many physio-pathological situations [1,13].
Circulating tumor cells migrate away from primary tumors via
the blood stream to form secondary tumors. While most tumor
cells do not survive in the circulation owing to their death mainly
by anoikis, some tumor cells acquire anoikis resistance, survive in the circulation under anchorage-independent conditions and
spread to distant organs [13-16]. Anoikis resistance of tumor cells
involve serval mechanisms among which epithelial-mesenchymal
transition, hyper-expression of some receptor tyrosine kinases
as well as changes in integrin signaling [16]. As such anoikis
resistance is a hallmark of the metastatic process and its study is
of major interest for cancer research and beyond. Although there
is a growing interest for tumor cell resistance to anoikis, there is
no standardized method that directly and accurately measures
anoikis resistance. The three assays listed below are the most used
to monitor tumor cell resistance to anoikis.
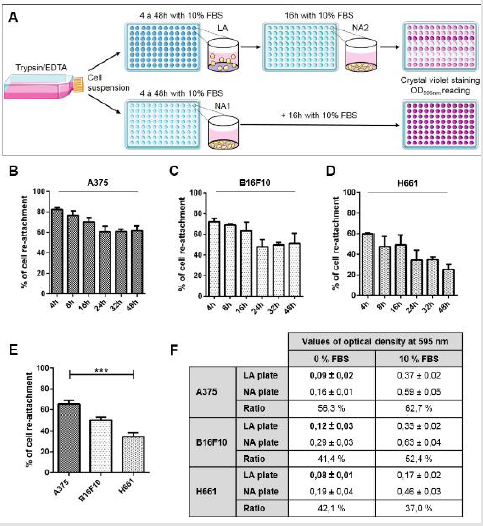
Figure 1: Anoikis resistance of tumor cell lines A375, B16F10 and H661 determined by low adherence and re-attachment assay (LARA)
A) Model for the low adherence and re-attachment (LARA) assay. Cells grown in flasks are detached using trypsin/EDTA
then seeded in parallel in either ultra-low attachment (LA) or in normal attachment (NA1) 96-well plates in media supplemented
with 10% FBS. Cells are maintained in low adherence plates (LA) for 4-48 hours and then transferred, by pipetting the content
of each well to normal adherence plates (NA2) for 16 hours. Cells that were seeded in normal adherence plate (NA1) are kept
under these conditions for 4-48 hours plus an additional 16 hours. At the end of the assay, plates are washed in PBS, adherent
cells are fixed, stained with a crystal violet solution and the OD595nm are determined. Maximum cell viability corresponds to OD
obtained in NA1 plate. The rate of cell survival and re-attachment is calculated from the ratio of mean OD595nm of NA2 plate to
the mean OD of NA1 plate.
B) Kinetics of cell re-attachment rate for A375 cell line.
C) Kinetics of cell re-attachment rate for B16F10 cell line.
D) Kinetics of cell re-attachment rate for H661 cell line.
For panels B, C and D, results from three independent experiments are presented as the mean ± SEM of 10 samples.
E) Percentage of cell re-attachment after 24h in low attachment culture conditions in presence of 10% of FBS. Results from seven
independent experiments are presented as the mean ± SEM of eight samples.
F) Mean optical density values obtained from low adherence plates (LA) and in normal plate (NA) ± SD and ratio OD595nm
NA2 / OD595nm NA1 for cells kept during 24h in low attachment culture conditions in the absence of FBS; data correspond to
the mean ± SEM of ten samples.
For all experiments presented in panels B to F, statistical analysis were performed by Kruskal Wallis test followed by Dunn’s
post-test.
The first assay, referred to as low adherence and re-attachment assay (LARA), takes place in two steps (Figure 1A) [17]. In the first step, cells are seeded in low attachment culture plates for a specific duration ranging from 4 to 48 hours. In the second step, cells are transferred to normal attachment plates for a duration ranging from 16 hours during which cells that survived the low attachment conditions may adhere. At the end of the assay, adherent cells are stained with crystal violet and the cell number is estimated by optical density (OD) measurement. Therefore, the LARA assay gives an indirect estimation of cells ability to both survive low attachment conditions during step 1 and re-attach under normal adherence conditions during step 2. The second method, referred to as LAFCA for low adherence flow cytometry analysis assay, consists in seeding cells in low attachment cell culture dishes for a specific duration at the end of which cells are labeled with both Propidium Iodide (PI) and FITC-Annexin V (AV) and analyzed by flow cytometry (Figure 2A) [18-21]. Apoptotic cells are characterized by phosphatidylserine exposure within the outer leaflet of the plasma membrane and are detected through the specific binding of AV (conjugated to fluorescent green dye FITC) to externalized phosphatidylserines.
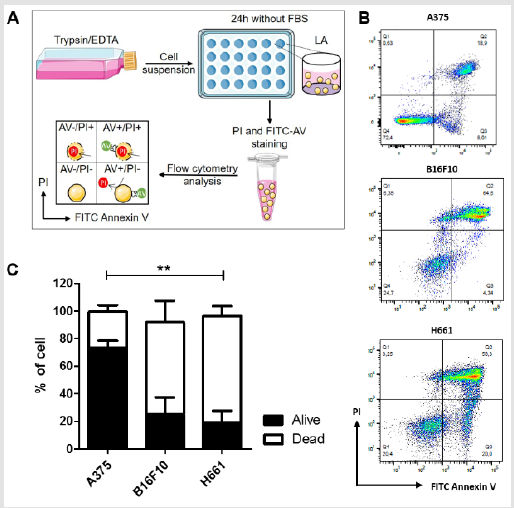
Figure 2: Anoikis resistance of tumor cell lines A375, B16F10 and H661 determined by flow cytometry analysis (LAFCA) assay
A) Model for the low adherence flow cytometry analysis (LAFCA) assay. Cells grown in flasks are detached using trypsin/
EDTA then seeded in media without FBS onto low adherence 24 well plates for 24 hours. Cells are labelled with PI and/
or FITC-AV and percentages of apoptotic cells (AV+/PI- and AV+/PI+) and living cells (AV-/PI-) are evaluated by flow
cytometry.
B) Typical plots obtained after flow cytometry analysis for A375, B16F10 and H661 cell lines are presented.
C) Percentage of the living (in black) and apoptosis dead (in white) cells after 24h of non-adherent culture without serum
for each cell line. Results are presented as the mean ± SD of duplicate samples from representative data of five independent
experiments. Statistical analysis were performed by Kruskal Wallis test followed by Dunn’s post-test.
Both PI positive- and double positive- (PI and AV) cells represent death necrotic cells. On this basis, cells that resist anoikis survive under low attachment conditions and are thereby double negative for PI or FITC-AV staining. The LAFCA assay allows an accurate quantification of cell resistance to low attachment conditions but does not take into account the ability of cells that survived to re-attach in a normal adherent environment. In the early phase of apoptosis, the translocation of phosphatidyl-serine is observed outside the plasma membrane. This is highlighted by specific fixation of annexin V coupled to a fluorophore and analyzed by flow cytometry. The third method is referred to as the AIG-SA assay for anchorage independent growth in soft agar (Figure 3A). In this assay, cells are seeded in a semi-solid medium formed by two successive layers of soft agar at a very low density, in such a way, that any colony formed may most likely represent a single isolated cell that divided many times rather than several neighboring cells that clustered and formed colonies.
Figure 2: Anoikis resistance of tumor cell lines A375, B16F10 and H661 determined by flow cytometry analysis (LAFCA) assay
A) Model for the low adherence flow cytometry analysis (LAFCA) assay. Cells grown in flasks are detached using trypsin/
EDTA then seeded in media without FBS onto low adherence 24 well plates for 24 hours. Cells are labelled with PI and/
or FITC-AV and percentages of apoptotic cells (AV+/PI- and AV+/PI+) and living cells (AV-/PI-) are evaluated by flow
cytometry.
B) Typical plots obtained after flow cytometry analysis for A375, B16F10 and H661 cell lines are presented.
C) Percentage of the living (in black) and apoptosis dead (in white) cells after 24h of non-adherent culture without serum
for each cell line. Results are presented as the mean ± SD of duplicate samples from representative data of five independent
experiments. Statistical analysis were performed by Kruskal Wallis test followed by Dunn’s post-test.
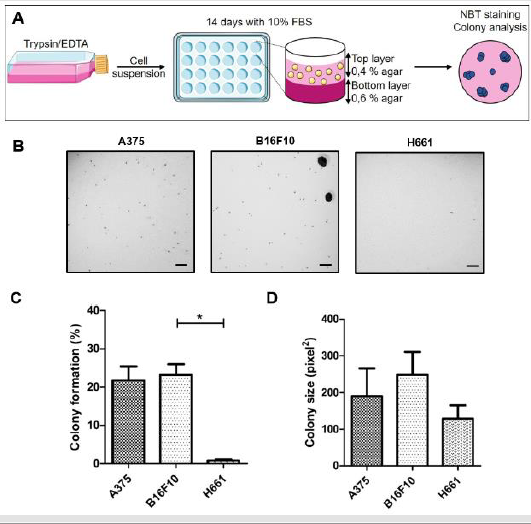
Figure 3: Anchorage-independent growth in soft agar (AIG-SA) of A375, B16F10 and H661 tumor cell lines
A) Model for the Anchorage-independent growth in soft agar (AIG-SA) assay. Cells growing in flasks are detached using
trypsin/EDTA, suspended in media containing 10% FBS and 0.6% agar (top layer) and seeded on a 0.4% agar layer (bottom
layer) in 24 well plates for 14 days. Plates are then stained with Nitrotetrazolium Blue Chloride (NBT) and colony size and
numbers are determined.
B) Typical photographs of A375, B16F10 and H661 plates are represented. Scale bars: 300 μm.
C) Percentages of colony formation are represented.
D) Colony size is represented.
The numbers and size of colonies > 0.5 mm were determined using ImageJ software. Results are presented as the mean ± SEM
of quadruplicate samples from data obtained from three independent experiments.
Since it may take 2-3 days for adherent cells to adapt to soft agar and since the anchorage independent growth may be slower than the attached one, the AIG-SA assay is commonly carried-out for 14-21 days, which would, depending on cell types, allow cells to undergo 6-8 divisions giving rise to colonies of approximately 40-200 cells [22-25]. Therefore, in the AIG-SA assay, each colony represents a single cell, which not only survived but also sustained several divisions, despite the lack of anchorage. The three assays, listed above, do not monitor the same parameters nor do they take into account the same aspects of cell resistance to anoikis: survival in the absence of anchorage and the ability of cells that survived to re-attach and grow in a different environment. We undertook the present study with an aim to compare these three widely used assays. To avoid that our conclusions may be altered by specific characteristics of a given tumor cell line, we undertook our study using three different tumor cell lines that are widely utilized in various metastasis assays. We used a human primary melanoma line A375, a human lung cancer line H661, and a murine melanoma metastatic line B16F10. For each cell line, our study monitored the extent of its resistance to anoikis as estimated from the three anoikis resistance assays described above.
Material and Methods
Cell Culture
The human melanoma cell line A375 [A375] (ATCC® CRL1619™), the human lung cancer cell line NCIH661 [H661] (ATCC® HTB183™) and the murine melanoma line B16F10 (ATCC® CRL6475™) were obtained from ATTC (Manassas, Virginia). A375 cells were cultured in DMEM Gluta Max medium, B16F10 and H661 cells were cultured in RPMI Gluta Max medium. Cells were cultured in media (DMEM or RPMI) supplemented with 10% fetal bovine serum (FBS) at 37°C in a humid atmosphere containing 5% CO2 and routinely passed at 70-80% confluency. All common cell culture dishes, media and reagents were obtained from Thermo Scientific (Waltham, Massachusetts). Both the flat bottom 24- and rounded bottom 96-well ultra-low attachment surface plates used were from Corning (Corning, New York).
Low Adherence and Re-Attachment (LARA) Assay
Each cell line (A375, B16F10 or H661) was seeded in parallel in either ultra-low attachment (LA) or in normal attachment (NA1) 96-well plates at a density of 5,000 cells per well in 200μl media supplemented with 10% FBS in 10 replicates for each condition (Figure 1A). For low attachment conditions, cells were kept in low attachment plates for the specified duration ranging from 4 to 48 hours. Cells were then transferred to normal 96-well plate (NA2) and kept for a 16 hour period at the end of which cells were fixed, stained for 2 hours with a methanol (25%) solution containing crystal violet (0.05%), washed with cold water and dried. The staining was then solubilized in 10% acetic acid for 1 hour and the OD was read at 595nm using the OD reader Varioskan from Thermo Scientific (Waltham, Massachusetts). For normal attachment conditions, cells were plated in normal attachment (NA1) plates for the specified duration ranging from 4 to 48 hours corresponding to step 1 plus an additional 16hour duration corresponding to step 2. 100% cell viability corresponds to OD obtained in NA1 plate. Results are represented in percentage of cell survival and reattachment calculated by the ratio of mean OD595nm read in plate NA2 to the mean OD595nm read in plate NA1.
Low Adherence Flow Cytometry Analysis (LAFCA) Assay
Each cell line (A375, B16F10 or H661) was seeded in 24-well ultra-low attachment plates at 200,000 cells per well in 0,5ml media without FBS (Figure 2A). After 24 hours, the content of each well was directly collected by pipetting; cells were labeled with FITC-AV and PI (FITC AV Apoptosis Detection Kit, BD Biosciences, Franklin Lakes, New Jersey). Numbers of dead cells (AV positive and double positive i.e. AV positive/PI positive) or live cells (double negative) were evaluated by flow cytometry (FACSVerse, BD Biosciences, Franklin Lakes, New Jersey) using the FlowJo 10.4.1 software for data analysis. For cytometer setting, a first population was selected using the plot SSC-A = f (FSC-A) in order to exclude cellular debris, and from this population a second population was chosen from the plot FSC-A = f (FSC -W) in order to analyze only isolated cells for FITC-AV / PI labeling. Signal acquisition was carried out on 20,000 events representing 10% of the total number of seeded cells.
Anchorage Independent Growth In Soft Agar (AIG-SA) Assay.
Cells are seeded in a semi-solid medium formed by two soft agar layers (Figure 3A). Preliminary experiments were first conducted to determine the optimal cell density that would be both low enough to reasonably exclude that colonies may result from the clustering of neighboring cells but sufficiently high to have a significant number of colonies over 14 days. Based on these preliminary experiments, we conducted the anchorage independent growth assay in 24 well plates with a cell density of 500 cells/well for B16F10 and A375 cells and 2,000 cells/well for H661 cells. Cells were suspended in culture medium containing 10% FBS and 0.4% soft agar at 37°C and then plated onto a solidified bottom layer containing culture medium of 10% FBS and 0.6% soft agar. Plates were incubated for 14 days after which cells were stained with a 1% Nitrotetrazolium Blue Chloride (NBT) solution from Sigma-Aldrich (Saint louis, Missouri) overnight at 37°C. Images were taken at the MacroView MVX10 Olympus (lens 1x, zoom 1x). Image processing, number and size of colonies analysis were performed on ImageJ 1.49v software.
Statistical Analysis
The results were plotted with the mean ± standard deviation
(SD). The statistical tests and the post-tests used are indicated in
the legend of the figures and were made with GraphPad Prism 5. *
p-value <0.05; ** p-value <0.01: *** p-value <0.001.
Figure 1A- 3A were generated using Servier Medical Art by
Servier.
Results
Low Adherence and Re-Attachment (LARA) Assay
As depicted in Figure 1A, this assay measures the ability of cells that survive low attachment conditions to re-attach as adherent cultures. First, we conducted kinetic studies to determine for each cell line (A375, H661, B16F10), the duration of culture under low attachment conditions that would lead to around 50 % cell death. Cells were cultured in media supplemented with 10% FBS in 96- well low attachment plates during 4 to 48 hours after which they were transferred to normal attachment plates for 16 hours. Cell re-attachment and survival were then assessed by crystal violet staining and quantified by measuring the OD595nm. Figure 1B shows that for A375 cells, the rate of cell survival and re-attachment decreases from 82,4 ± 1,7 % at 4 hours to 60,5 ± 5,4 % at 24 hours. Figure 1C & 1D show that for B16F10, this rate decreases from 72,4 ± 3,2% at 4 hours to 47,7 ± 7,2% at 24 hours while for H661 cells, which seem to be much more sensitive to low attachment conditions, this rate is 59,9 ± 0,7 % at 4 hours and decreases to 34,5 ± 9,5 % at 24 hours.
For A375 and B16F10 and to a lesser extend for H661 cells, the rate of cell survival did not significantly decrease any further at 32 and 48 hours. This stability of the rate of cell re-attachment and survival may reflect that after a 24 hour adaptation period to low attachment conditions, cell subpopulations representing respectively 61,6 ± 4,8 %, 51,2 ± 9,8 % and less than 25,3 ± 4,7 % of respectively A375, B16F10 and H661 that resist to anoikis are selected. Figure 1E, which represents data obtained from a larger scale experiment, confirms that after 24 hours under low attachment conditions, A375 cell survival (65,4 ± 3,6 %) was higher than that of B16F10 cells (50,6 ± 3,0 %) cells which, in turn, was higher than that of H661 cells (34,7 ± 3,9 %). If the LARA assay is conducted in the absence of serum during the 24 hour period corresponding to step 1 (low adherence plate), cells completely lose the ability to re- attach during step 2 (normal adherence) as illustrated by the very low levels of the OD595nm of crystal violet staining which are near zero, represented in Figure 1F. Obviously, such near-zero values of the OD595nm should not be used to estimate the percentage of cell survival.
Low Adherence Flow Cytometry Analysis (LAFCA) Assay
The second assay, referred to as LAFCA assay, combines plating cells in low adherence plates for a specific duration followed by direct analysis of the percentage of cell death or survival by flow cytometry using PI and FITC-AV labeling, as illustrated in Figure 2A. Since this assay does not include any secondary re-attachment step, it is suitable to be conducted in the absence of serum for a duration of typically 24 hours. Figure 2B depicts typical flow cytometry analysis for A375, B16F10 and H661 cell lines. Figure 2C shows that using the LAFCA assay, the rate of cell survival as estimated from AV and PI double negative cells, is over 73,4 ± 5,0 % for A375- while that of B16F10- and H661- cells are respectively 25,0 ± 12,3% and 19,0 ± 8,6%. As expected, for the three tumor cell lines, most cells which did not resist anoikis underwent apoptosis rather than necrosis as they were either AV positive or AV and PI positive and hardly any were solely PI positive. The comparison of the data obtained in the LAFCA assay (Figure 2C) to that obtained in LARA assay (Figure 1E). shows that for the three cell lines, the rate of cell survival estimated from the LAFCA assay was different from the rate determined from the LARA assay. This discrepancy between the data obtained by each assay may be accounted for by several experimental settings, which are different between the LAFCA and the LARA assays. First, the LARA assay is conducted in rounded bottom 96 well plates at 5000 cells/well corresponding to a cell density of 15150 cell/cm2 while the LAFCA assay is conducted in flat bottom 24 well plates at 200000cells/well corresponding to a cell density of 105260 cells/cm2.
Such a difference in cell density could directly influence cell-cell interactions as well as the concentration of cell secreted autocrine factors, some of which may contribute to cell resistance to anoikis. Second, the LARA assay is performed in cell culture media containing 10% FBS while the LAFCA is performed in the absence of serum which may contribute to the weakening of cell resistance to anoikis. Third, in the LARA assay, the rate of cell survival in low adherence- are normalized to that of cells in normal adherenceplates while in the LAFCA assay, there is no such normalization, but the rate of cell survival simply corresponds to the rate of cells that are negative for both PI and FITC-AV. Finally, while the LARA assay measures both the resistance of cells to low attachment conditions (step 1) and the ability of cells that survived to re-attach in a normal adherent environment (step2), the LAFCA assay only measures the ability of cells to resist low adherence conditions during 24 hours.
Anchorage Independent Growth in Soft Agar (AIG-SA) assay
The anchorage-independent growth of A375, B16F10 and H661 cell lines was monitored by soft agar colony formation assay (Figure 3A). Representative images of AIG assay for each cell line are represented in (Figure 3B). 3B. Since cell density was not the same for the three cell lines, results are expressed as percentage rather than number of cells that formed colonies. Figure 3C shows that this percentage is much higher for A375 cells (21,8 ± 3,7 %) and B16F10 (23,2 ± 2,8 %) than for H661 (0,8 ± 0.3 %) cell lines. The analysis of the AIG-SA assay in terms of colony size is represented in (Figure 3D). It shows that the average colony size is higher for B16F10 (248,5 ± 62,1 pixels2) and A375 (190 ± 75,8 pixels2) than for H661 colonies (129,3 ± 35,8 pixel2); for B16F10 cells colony size were heterogeneous. The percentage of colony parameter reflects the ability of cells to both resist the lack of anchorage and to sustain serval cell divisions. The colony size parameter reflects mainly the number of cell divisions that cells, which resisted the lack of anchorage, were able to sustain. Therefore, for the AIG-SA assay, the percentage of colonies parameter provides a more appropriate indication of cell resistance to anoikis.
Discussion
The arising interest in anoikis has led in the last few years to
the development of several anoikis resistance assays. The LARA,
LAFCA and AIG assays do not measure the same cell anoikisrelated
parameters. Nevertheless, as depicted in Figure 4, our study
suggests that qualitatively and to a lesser extend quantitatively;
these three assays lead to similar results for the three tumor cell
lines studied. In the LARA assay, the data represent a combination
of two parameters: the ability of cells to survive in low adherence
plates (step 1) and to re-attach to the normal adherence culture
dish (step 2). Combining these two distinct parameters in a single
measurement is the major strength of the LARA assay. The LARA
assay is simple to perform and is suitable for high- throughput
screening. There are however several shortcomings for this assay.
First, the duration of step 2 has to be sufficiently short for cell
proliferation to be insignificant; otherwise, data may represent a
combination of three parameters (cell survival in low adherence
plate, re- attachment and proliferation in normal adherence plate).
Second, for normalizing the data, the assay must be conducted
in parallel and in the same way in low adherence and normal
adherence plates. Since normal adherence plates are used to
provide maximal cell survival, which for many cell types requires
the presence of serum, the assay must be conducted in the presence
of serum in both types of plates. The presence of serum could
protect cells from anoikis and does not allow to work in defined
media conditions that are more appropriate for studying the effects
of exogenous factors on this process. Therefore, the experiments in
the presence of serum can be considered as another shortcoming of
the LARA assay. To determine optimal LARA assay conditions, it is
best to first undertake kinetic studies to determine the duration of
culture under low adherence conditions, which gives around 50%
survival. If the duration of cell culture in low adherence plates is
too short, cell survival may be too high to appreciate any protective
effects of the factors studied. Conversely, if it is too long, the rate
of cell death may be too high to appreciate potential effects of
exogenous factors.
The LAFCA assay enables to discriminate between necrotic
cells (PI positive), apoptotic cells (AV positive), and live cells (PI
and AV negative), and provides an accurate quantitation of cell
survival. Furthermore, since in the LAFCA assay, the percentage
of cell survival under low attachment conditions is determined
within total cell population, data do not need to be normalised to
the percentage of cell survival under normal adherence conditions.
Therefore, this assay may be conducted in defined medium without
serum and hence is suitable for testing exogenous factor effects on
cell resistance to anoikis. The fact that LAFCA assay measures only
cell resistance to low attachment conditions and does not take into
account the ability of cells that survived to re-attach in a normal
adherent environment is a shortcoming of this assay. The other
weakness of LAFCA assay is the requirement to use cells at high cell
densities to be able to perform flow cytometry analysis. High cell
density may favour the formation of cell-cell aggregates, despite
the low adherence conditions, and subsequently may not represent
an adequate condition to study cell resistance to anoikis. The AIG
assay is very informative, especially if both parameters (colony
numbers and size) are taken into account. The major shortcoming
of the assay is its long duration (from 14-21 days) which makes it
an unsuitable assay for rapid screening of anoikis resistance.
It should be added here that for each cell line, several
preliminary experiments are often necessary to determine the
optimal cell density that would be both low enough to reasonably
exclude that colonies may result from the clustering of neighboring
cells, but sufficiently high to have a significant number of colonies
over 14 days. Finally, the present study shows that the three widely
anoikis assays used, LARA-, LAFCA- and AIG- assays, do not in fact
measure the same cell anoikis-related parameters. Nevertheless, as
depicted in Figure 4, our study suggests that qualitatively and to
alesser extend quantitatively, for the three tumor cell lines studied,
A375, H661 and B16F10, these three assays lead to similar results.
Furthermore, the present study points out strengths, weaknesses
and the usefulness of each of these anoikis resistance assays. None
of these assays measures the events directly involved in anoikis
such as integrin disengagements but they rather all monitor
cell death or survival following the loss of cell-cell or cell-ECM
interactions. Therefore, combining any of these three assays with
direct or indirect measurements of either integrin disengagements
or signalling pathways associated with anoikis such as caspases or
death receptors activation may allow a better monitoring of anoikis
resistance and a better understanding of the specific molecular
mechanisms underlying anoikis resistance.
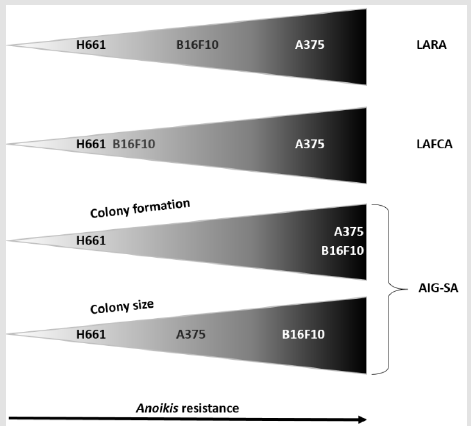
Figure 4: Trend and extend of H661, B16F10 and A375 cell lines resistance to anoikis
Data obtained from the LARA, LAFCA and AIG-SA assays for each cell line are compiled in a single representation.
Conflict of Interest
The authors declare that they have no conflict of interest.
Acknowledgement
The authors thank A. Cantereau, A.Delwail and IMAGEUP facility of the University of Poitiers for microscopy and FACS analysis. We thank Isabelle Lucet for critical reading of the manuscript.
Funding
This work was supported by La Ligue Nationale Contre le Cancer, comité de la Vienne (86) de la Charente (16) et des Deux- Sèvres (79). Aurélie Joussaume was funded by a Ph.D. fellowship from Sport & Collection, CHU Poitiers.
References
- Paoli P, Giannoni E, Chiarugi P (2013) Anoikis molecular pathways and its role in cancer progression. Biochimica et Biophysica Acta (BBA)-Molecular Cell Research1833(12):3481-3498.
- Gilmore AP (2005) Anoikis. Cell Death & Differentiation 12(S2):1473-1477.
- Frisch SM, Screaton RA (2001)Anoikis mechanisms. Current Opinion in Cell Biology13(5):555- 562.
- Chiarugi P, Giannoni E (2008)Anoikis: a necessary death program for anchorage-dependent cells. BiochemPharmacol 76(11):1352-1364.
- Grossmann J, Walther K, Artinger M, Kiessling S, Scholmerich J (2001) Apoptotic Signaling during Initiation of Detachment-induced Apoptosis (“Anoikis”) of Primary Human Intestinal Epithelial Cells. Cell Growth & Differentiation12(3):147-255.
- Reddig PJ, Juliano RL (2005) Clinging to life: cell to matrix adhesion and cell survival. Cancer and Metastasis Reviews24(3):425-439.
- Bozzo C, Sabbatini M, Tiberio R, Piffanelli V, Santoro C (2006) Activation of caspase-8 triggers anoikis in human neuroblastoma cells. Neuroscience Research56(2):145-153.
- Kroemer G, Galluzzi L, Brenner C (2007) Mitochondrial Membrane Permeabilization in Cell Death. Physiological Reviews87(1):99-163.
- Rosen K, Shi W, Calabretta B, Filmus J (2002) Cell Detachment Triggers p38 Mitogen-activated Protein Kinase-dependent Overexpression of Fas Ligand: A Novel Mechanism of Anoikis Of Intestinal Epithelial Cells. Journal of Biological Chemistry277(48):46123-46130.
- Mawji IA, Simpson CD, Hurren R (2007) Critical Role for Fas-Associated Death Domain-Like Interleukin-1-Converting Enzyme-Like Inhibitory Protein in Anoikis Resistance and Distant Tumor Formation. JNCI Journal of the National Cancer Institute99(10):811-822.
- Aoudjit F, Vuori K (2001) Matrix Attachment Regulates FAS-Induced Apoptosis in Endothelial Cells: A Role for C-Flip and Implications for Anoikis. The Journal of Cell Biology152(3):633-644.
- Bachelder RE, Wendt MA, Fujita N, Tsuruo T, Mercurio AM (2001) The Cleavage of Akt/Protein Kinase B by Death Receptor Signaling Is an Important Event in Detachment-induced Apoptosis. Journal of Biological Chemistry276(37):34702-34707.
- Taddei M, Giannoni E, Fiaschi T, Chiarugi P (2012)Anoikis: an emerging hallmark in health and diseases. The Journal of Pathology226(2):380-393.
- Simpson CD, Anyiwe K, Schimmer AD (2008) Anoikis resistance and tumor metastasis. Cancer Letters272(2):177-185.
- Liotta LA, Kohn E (2004) Cancer and the homeless cell. Nature430(7003):973-974.
- Guadamillas MC, Cerezo A, del Pozo MA (2011) Overcoming anoikis-pathways to anchorage- independent growth in cancer. Journal of Cell Science124(19):3189-3197.
- Drury LJ, Wendt MK, Dwinell MB (2010) CXCL12 Chemokine Expression and Secretion Regulates Colorectal Carcinoma Cell Anoikis through Bim-Mediated Intrinsic Apoptosis. Cookson MR PLoS ONE5(9):e12895.
- Attwell S, Roskelley C, Dedhar S (2000) The integrin-linked kinase (ILK) suppresses anoikis. Oncogene 19(33):3811-3815.
- Cheng Y, Hou T, Ping J, Chen T, Yin B (2018) LMO3 promotes hepatocellular carcinoma invasion, metastasis and anoikis inhibition by directly interacting with LATS1 and suppressing Hippo signaling. J Exp Clin Cancer Res.
- Tsai JY, Tsai SH, Wu CC (2019) The chemopreventive isothiocyanate sulforaphane reduces anoikis resistance and anchorage-independent growth in non-small cell human lung cancer cells. Toxicology and Applied Pharmacology362:116-124.
- Tzukert K, Gorodestky R, Avrahami I (2008) A novel dynamic matrix detachment model reveals a shift from apoptosis to necrosis in melanoma cells. Cancer Letters272(2):345-354.
- Borowicz S, Van Scoyk M, Avasarala S (2014) The Soft Agar Colony Formation Assay. J Vis Exp 92: e51998.
- Buchheit CL, Angarola BL, Steiner A, Weigel KJ, Schafer ZT (2015) Anoikis evasion in inflammatory breast cancer cells is mediated by Bim-EL sequestration. Cell Death Differ22(8):1275-1286.
- Horibata S, Vo TV, Subramanian V, Thompson PR, Coonrod SA (2015) Utilization of the Soft Agar Colony Formation Assay to Identify Inhibitors of Tumorigenicity in Breast Cancer Cells. J Vis Exp99: e52727.
- Silva Nunes JP, Martins Dias AA (2017) ImageJ macros for the user-friendly analysis of soft-agar and wound-healing assays. BioTechniques62(4): 175-179.
