 Research Article
Abstract
Background: Spinal cord injury is a debilitating CNS damage resulting in destruction of nervous fibers and development of neurological deficit. Regenerative medicine and especially cell therapy are commonly considered to be promising treatment options for SCI. Precise quantitative assessment of injury structure and volume is critical for evaluation of therapy efficiency. Current methods for calculation of the injured spinal cord parameters are based on manual delimitation of the interested area. However, this technique is often tedious and imprecise.
New Method: Standard rat models of severe acute SCI were used. Spinal cord MRI was performed in 1 day after SCI and further for 4 times with 1-week interval. We designed software “Spinal cavity Searcher” based on the algorithm of MRI T2-WI scans analysis and implementing binarization and Freeman chain code.
Results: ScS software semi-independently calculates the volume of SCI area and estimates the structure of the injured region. This simplifies the process of calculation and makes it more precise. We also compared results of implemented algorithm with manual calculation data and found no significant difference.
Conclusion: Described method of quantitative calculation of rat spinal cord posttraumatic region structure and volume simplifies the assessment procedure due to automatization of region of interest (ROI) separation comparing to manual calculation technique. The level of preciseness is comparable in both methods.
Clinical Relevance: Designed algorithm promotes the process of noninvasive control for therapy efficiency using MRI data.
Keywords: Spinal Cord Injury; Computed Analysis of Medical Images; MRI; Posttraumatic Changes; Animal Models; Software
Abbreviations:CNS: Central Nervous System; SCI: Spinal Cord Injury; BBB: Basso- Beattie-Bresnahan; T2-WI: T2-Weighted Image; ScS: Spinal Cavity Searcher
Introduction
Spinal cord injury is a complex dynamic process occurring after mechanical damage of the spinal cord and followed by a series of events leading to secondary central nervous system (CNS) injury and subsequent death of spinal cord nervous cells and fibers. This is followed by manifestation of neurological deficit. Secondary injury of the spinal cord occurs due to ischemia, inflammation, oxidative stress and subsequent tissue necrosis and apotosis followed by formation of posttraumatic cyst and development of glial and fibrous scar [1,2]. Finally, the certain level of cystic-glial-fibrous transformation of the injured spinal cord is observed. Spinal cord injury is one of the major medical and social problems of modern medicine. No effective pathogenetic treatment alternatives are available today. All routinely used treatment techniques are either palliative or have significantly low efficiency. This demonstrates that new treatment alternatives are highly demanded [3]. One of the most promising options for spinal cord injury (SCI) treatment is regenerative medicine. In preclinical and/or clinical studies, while assessing the efficiency of neuroprotective and/or neuroregenerative therapy, it is important to estimate the internal structure and volume of posttraumatic spinal cord region in the most precise manner [4].
Today we consider MRI scanning to be the gold standard for non-invasive diagnostics of spinal cord injury [5]. The problem of quantitative calculation of posttraumatic spinal cord region parameters (including area and volume) using MRI is currently unsolved. Each contusion area having highly heterogeneous and complex structure is consuming for any visualization techniques due to inexact borders and completely nonlinear dynamics of structure changes in time. In most cases quantitative calculations of posttraumatic spinal cord parameters are performed manually, often using routine software such as ImageJ or VG Studio Max [4,6,7] or other scan viewers. All algorithms of manual calculation include the stage of manual delimitation of the interested region (ROI). This process is consuming and long-lasting, especially in large studies including multiple animals. Thus, the automatization of spinal cord contusion region volume calculation in animal models appears to be extremely important for further therapy optimization and is interesting both for preclinical investigators and for clinical practitioners.
Materials and Methods
Selection and Examination of Animal Models
Total number of 10 animals were included into the study: white Sprague-Dawley rats, females only, weighting 250 - 350 grams. All animals were kept in standard conditions of preclinical facility in individual cages (day/night mode of 12 hours, free access to food and water). All surgeries were performed under strictly aseptic and antiseptic conditions using sterile surgical tools. All animal surgeries, further treatment and maintenance were performed under international GLP recommendations. We used combined injectable narcosis for all surgeries and other examinations requiring animal fixation. Combined anesthesia medication was composed of 5% solution of Ketamine (Calipsol) - 3.0 mL, 2% solution of Xylasine (Xyla) - 3.0 mL and 1% solution of Acepromasine (Vetranquil) - 1.0 mL. Combined solution was injected intramuscularly (i.m.) or intraperioneally (i.p.) in amount of 0.1 mL of solution for each 100 grams of animal weight. Spinal cord contusion injury was performed using high speed medical drill and surgical kit at the level of Th9 vertebra according to common “weight-drop” technique. This model corresponds the severe level of injury according to Basso-Beattie-Bresnahan (BBB) classification Basso, et al. [8].
MRI Scanning
MRI scanning was performed using high-field MRI Clin Scan 7.0 T tomography (Brucker BioSpin, Germany). T2-weighted images (T2-WI) relaxivity was analyzed using following scan parameters: TR = 40 ms, TE = 29 ms, base resolution 320 x 230, FOV 45 x 32 mm, flip angle 15°, slice thickness = 0.5 mm.
Image Analysis Techniques
Automatic delimitation of the interested region (ROI) in processed images was implemented using binarization algorithm with lower limitation. Such conversion allows decreasing significantly the amount of scan information avoiding the loss of detailing. The obtained binary images explicitly determine the boundaries of the object. Contour analysis was performed using the contour encoding technique - Freeman Chain Code [9]. Chain codes allow representing the objects borders (contours) as the sequence of strait line segments with certain length and direction. This representation is based on 8-linked (octagonal) grid (Figure 1). The length of each segment is determined by grid resolution while directions are set by the chosen code (e.g. all directions of 8-linked chain code require 3 bytes). We used Otsu method (Nobuyuki Otsu) [10] to select the optimal value of binarization lower limits. This algorithm separates two pixel classes (“valuable” and “background” pixels) using exact level of limitation within minimal intra-class dispersion. Manual calculation of isolated ROI area was realized using Gauss formula (calculation of polygonal shape area which vertexes are determined on a plane by Cartesian coordinates).
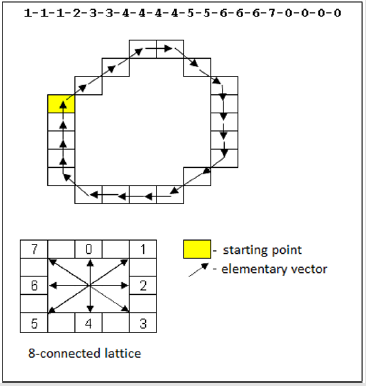
Figure 1: Freeman chain code algorithm.
Statistical Analysis and Programming
Microsoft Visual Studio 2017 environment and С# computer language added with OpenCVSharp library of image analysis were used for software engineering. Statistical analysis was performed using SPSS Statistics 21 by IBM program. All obtained data were verified in respect to normal distribution rule using Shapiro-Wilk test. Confidence intervals were defined for median spinal cord contusion volume values. Mann-Whitney criterion was applied for intergroup analysis.
Results
MRI scanning was performed the next day following spinal cord injury and then 4 more times with 1 week interval. Dynamics of alterations observed in spinal cord injury area were analyzed (Figure 2). At the first day following spinal cord injury T2-weighted image (T2-WI) analysis revealed the development of hemorrhagic transformation (hematomyelia) of the spinal cord tissue. This region appears to be hypointensive comparing to the intact spinal cord tissue. Hemorrhagic region is surrounded by moderate hyperintensive (T2-WI scans) areas of perifocal edema (Figure 2A). In most cases, we observed the expansion of central spinal canal as a result of CSF (cerebrospinal fluid) dynamics disturbance due to hemorrhage and edema development. In 7 - 10 days following SCI perifocal edema intensity and central spinal canal expansion level decrease (Figures 2B & 2C). In the next 5 weeks secondary mechanisms of spinal cord injury result in formation of posttraumatic cyst surrounded by glial and fibrous scar looking clearly hyperintensive in T2-WI scans (Figure 2D). This stage reflects the complex posttraumatic cystic-glial-fibrous transformation of spinal cord structure leading to persistent long-lasting neurological deficit and restricting the efficiency of the applied therapy.
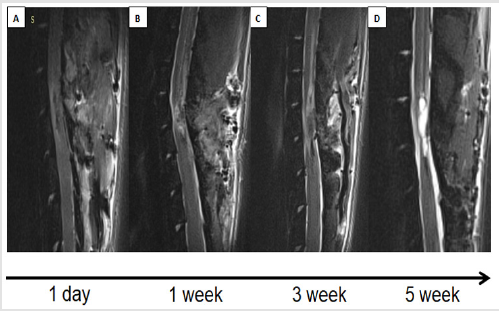
Figure 2: Dynamics of contusion area structure.
A) 1 day following spinal cord injury (SCI); B) 1 week following SCI; C) 3 weeks following SCI; D) 5 weeks following SCI.
The key feature of animal models MRI scans is the progressive
reduction of the injured spinal cord diameter as a result of fibrous
and atrophy processes and subsequent retraction of the injured
tissue. Therefore, the problem of quantitative volume calculation
assumes the precise delimitation of highly heterogeneous contusion
area. This requires certain hardware and software implementation
as well as application of specific analysis algorithms. Computed
algorithms of binarization and Freeman chain code can solve
this problem. Binarization protocol decreases the amount of
information provided in the scan solving the problem of structure
heterogeneity. It provides the inactivation of the chain code within
the borders of the interested area, thereby developing the single
outline around the examined object.
The developed software (“Spinal cavity Searcher” (ScS)
program) (completely uncommercial software; can be provided
to every interested person and/or lab via the contact with the
first author for correspondence) provides the precise and clear
calculation of contusion area volume by the implementation of
binarization algorithm with lower limitation with subsequent
application of Freeman chain code for outline encoding and
calculation of the interested area parameters (Figure 3). The
optimal values of the binarization lower limit were obtained using
Otsu algorithm. MRI developed DICOM files were downloaded to
ScS program, and then certain slices of the injured spinal cord area
are selected. Program functioning consists of automatic sequential
implementation of binarization and chain code processes for each
slice while interested area values are recorded to the hard drive.
Later volume calculation is performed automatically by summation
of obtained area values and multiplication by slice thickness using
this formula (1):
Q =Σi dSi …….(1)
in which: Q - volume of the interested object (e.g. SCI locus);
d - slice thickness;
Si - area of the interested region (ROI) on a certain slice i;
i - number of slices.
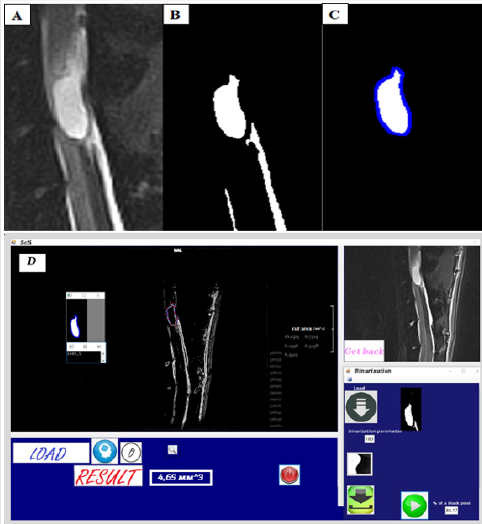
Figure 3: Spinal cavity Searcher program and algorithms of binarization and Freeman chain code.
A. Original T2-weighted image (T2-WI), sagittal plane.
B. Image after binarization algorithm implementation.
C. Image after Freeman chain code implementation for outline encoding.
D. Program interface.
We estimated the dynamics of contusion area volume changes using developed software. We also compared the obtained results with manual calculation technique to estimate the preciseness of the developed algorithm (Figure 4). Mann-Whitney criteria evaluation demonstrated no significant differences of contusion area volume in both calculation methods (e.g. computed vs manual) (Table 1).
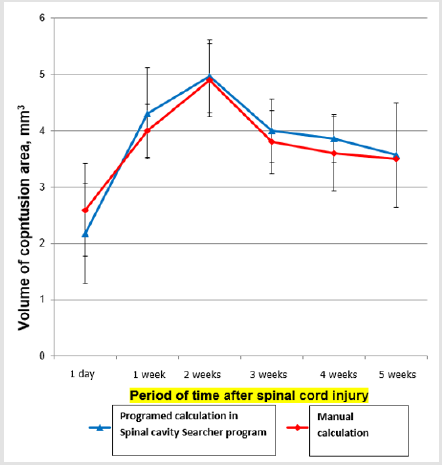
Figure 4: Dynamics of contusion area volume changes.
Blue line - Result of programed calculation using ScS implemented algorithm.
Red line - Result of manual calculation within the ScS program.

Table 1: Comparing results of programed and manual calculation techniques considering parameters of contusion area volume using Mann-Whitney criteria. H0 - no significant differences of parameter revealed
Discussion
Since experimental modelling for spinal cord injury treatment
studies is unavailable for humans, proper implementation of
animal modelling (in particular for small lab animals) is of
great importance. Developing of modern magnetic-resonance
tomographic technologies allowed to obtain highly effective
magnetic induction control, resulting in significant increase of
imaging resolution and precise visualization of CNS structure even
in small animals. However, the problem of quantitative assessment
of posttraumatic changes using MRI images is usually solved by
unspecialized software for image analysis, such as ImageJ or VG
Studio Max or other image viewers. This type of software requires
carefully controlled segmentation and precise delimitation of the
interested regions. Since each region can consist of up to 5 slices
and even more this task becomes complicated. The main objective
of our study was to automate the process of quantitative assessment
of rat injured spinal cord structure.
Considering MRI properties of the injured spinal cord we
have chosen optimal algorithms, such as binarization with lower
limitation and Freeman chain code. These algorithms were
implemented using C# computer language. Later we also used the
developed software “Spinal cavity Searcher” (ScS) to assess the
dynamics of contusion area volume changes. This program applies
also the algorithm for “manual” delimitation of the interested
region and allows the one to compare results obtained using both
algorithms (“manual” vs computed delimitation). Comparison
demonstrated no significant difference in calculation preciseness
between both methods; in both cases results were consistent.
However, a reported automatic ScS algorithm performs calculation
much quicker and is valuable while analyzing large amounts of
scans. Moreover, even less qualified specialists are able to perform
the analysis using ScS software avoiding complicated manual
delimitation of the interested region.
Reported Algorithm Limitations
Development of spinal cord contusion results in gradual formation of multiple cysts filled with cerebrospinal fluid and surrounded by glial and fibrous scars. This complex structure looks hyperintensive in T2-WI MRI scans. Freeman chain code algorithm is ineffective for analysis of multiple objects and results in overestimated area values due to significant excess of generated outlines. We observed the development of multiple posttraumatic cysts in two animals in 5 weeks following SCI. In this context we indicated this as the limitation for the reported algorithm requiring manually controlled delimitation of ROI in similar cases.
Conclusion
Developed computer algorithm for spinal cord contusion volume calculation provides the automatic process of objective data collection concerning structure, size and volume of spinal cord injured region using MRI imaging. This algorithm is available for future implementation in analytical preclinical and clinical studies of various regenerative technologies related to MRI imaging.
Acknowledgement
The authors would like to acknowledge the National Medical Research Center of Cardiology of Ministry of Health, Moscow, Russia and especially Ph.D., Prof. Vladimir N. Smirnov - the Head of Stem Cell Division. We also acknowledge the staff of Animal MRI Division for the assistance in MRI performance.
Conflict of Interest
The authors declare that they do not have any conflict of interest. The developed software “Spinal cavity Searcher” is a completely uncommercial product. Program can be provided to anyone interested (both persons and/or laboratories) via the contact with the first author for correspondence (M.Y.).
Other Declarations of Interest
None.
References
- Chen Y, Tang Y, Vogel L, DeVivo M (2013) Causes of spinal cord injury. Topics in spinal cord injury rehabilitation 19(1): 1-8.
- Silva NA, Sousa N, Reis RL, Salgado AJ (2014) From basics to clinical: a comprehensive review on spinal cord injury. Progress in neurobiology114: 25-57.
- Ryabov SI, Zvyagintseva MA, Pavlovich ER, Smirnov VA, Grin AA, et al. (2014) Efficiency of transplantation of human placental/umbilical blood cells to rats with severe spinal cord injury. Bulletin of experimental biology and medicine 157(1): 85-88.
- Ditor DS, John S, Cakiroglu J, Kittmer C, Foster PJ, et al. (2008) Magnetic resonance imaging versus histological assessment for estimation of lesion volume after experimental spinal cord injury. Journal of NeurosurgerySpine 9(3): 301-306.
- Bozzo A, Marcoux J, Radhakrishna M, Pelletier J, Goulet B(2011) The role of magnetic 0resonance imaging in the management of acute spinal cord injury. Journal of neurotrauma 28(8): 1401-1411.
- Byrnes KR, Fricke ST, Faden AI (2010) Neuropathological differences between rats and mice after spinal cord injury. Journal of Magnetic Resonance Imaging 32(4): 836-846.
- Song W, Song G, Zhao C, Li X, Pei X, et al. (2018) Testing Pathological Variation of White Matter Tract in Adult Rats after Severe Spinal Cord Injury with MRI. BioMed research international2018: 4068156.
- Basso DM, Beattie MS, Bresnahan JC (1995) A sensitive and reliable locomotor rating scale for open field testing in rats. Journal of neurotrauma 12(1): 1-21.
- Vaddi RS, Boggavarapu LNP, Vankayalapati HD, Anne KR(2011) Contour detection using freeman chain code and approximation methods for the real time object detection. Asian Journal of Computer Science and Information Technology 1(1).
- Vala HJ, Baxi A (2013) A review on Otsu image segmentation algorithm. International Journal of Advanced Research in Computer Engineering & Technology (IJARCET) 2(2): 387-389.
